
Abstract
Background
The coronary artery calcium score is widely used to assess the extent of coronary atherosclerosis and future cardiovascular risk. Red cell distribution width and the uric acid–albumin ratio have been associated with inflammatory activity and adverse cardiovascular outcomes, but their association with coronary artery calcium burden is still not clearly established. The present study evaluated the relationship between red cell distribution width, uric acid-to-albumin ratio, and coronary artery calcium score in patients undergoing coronary computed tomography angiography for suspected coronary artery disease.
Methods
We conducted a hospital-based, cross-sectional observational study involving 250 patients presenting with symptoms suggestive of coronary artery disease who underwent coronary computed tomography angiography. Coronary calcium score was determined using the Agatston scoring system, and patients were grouped into low (<100) and high (≥100) coronary artery calcium score categories. Red cell distribution width-coefficient of variation, red cell distribution width-standard deviation, serum uric acid, albumin, and uric acid-to-albumin ratio were measured. Correlation analysis and logistic regression models were applied to identify factors associated with an elevated coronary calcium score.
Results
Sixty-five patients (26%) had a high coronary artery calcium score. Patients with elevated calcium scores were generally older and more frequently had hypertension, diabetes mellitus, a smoking history, and male predominance. Higher pulse rate, blood pressure, leukocyte count, lower albumin levels, and reduced ejection fraction were also observed. The Framingham Risk Score increased with the coronary artery calcium score. Red cell distribution width-coefficient of variation and red cell distribution width-standard deviation showed no significant association with coronary artery calcium score. Uric acid levels were similar between groups, while the uric acid-to-albumin ratio showed a weak positive correlation (r = 0.132, P = .04) without independent predictive value. Older age, hypertension, and reduced ejection fraction independently predicted a high coronary artery calcium score.
Conclusion
Coronary artery calcium score remains superior for assessing atherosclerotic burden and risk stratification. Red cell distribution width showed no association, and uric acid-to-albumin ratio demonstrated only a weak, non-independent correlation.
Keywords
Introduction
Coronary artery disease is a complicated condition. It does not come from a single cause—it is a mix of the genes we are born with and the lifestyle habits we follow every day. 1 Over the years, atherosclerosis slowly builds up and narrows the coronary arteries. When that happens, the heart muscle does not get enough blood. This can lead to myocardial ischemia, acute coronary syndromes, or even sudden cardiac death. 2
We all know that common cardiovascular risk factors include hypertension, diabetes mellitus, smoking, dyslipidemia, sedentary lifestyle, alcohol consumption, and unhealthy dietary habits. 3 Even with all the progress we have made in prevention and treatment, coronary artery disease (CAD) is still a major contributor to global cardiovascular morbidity, particularly in low- and middle-income countries. That is exactly why early risk detection and proper patient classification matter so much. 4 Coronary artery calcium score is commonly assessed using non-contrast computed tomography (CT) imaging. It is a well-accepted, non-invasive way to see how much atherosclerosis is present in the coronary arteries. 5 Higher scores are clearly linked to a bigger chance of future heart events and often give us more useful information than traditional risk factors alone. 6 It works particularly well for catching silent, early-stage disease and for risk stratification in suspected CAD patients. 7 But when the coronary artery calcium score (CACS) is in the intermediate range, things are still not completely clear. That is why many researchers are now looking for additional blood-based markers to improve prediction. 8
Red cell distribution width (RDW) is a routine and cheap blood test parameter. It can reflect ongoing inflammation, oxidative stress, or problems in red blood cell production. 9 A number of studies have shown that a higher RDW is associated with more severe CAD, complex plaques, and worse cardiovascular outcomes.10, 11 It seems that RDW is actually capturing some of the hidden processes that drive atherosclerosis and make plaques unstable. In the same way, the uric acid-to-albumin ratio (UAR) has recently emerged as a promising inflammatory marker. It basically shows the balance between the harmful effects of uric acid and the protective role of albumin. 12 Previous work has linked higher UAR to greater CAD severity and poorer outcomes. 13 Because of how these two substances act in the body, UAR makes sense as a marker of cardiovascular risk.
Although RDW and UAR have both been studied on their own in CAD patients, hardly anyone has looked at how they work together with the CACS. If these simple, everyday blood tests can be connected to CACS, it could give us better insight into the actual atherosclerotic burden—especially in places where advanced tests are difficult or expensive. Keeping this in mind, the current study was conducted to evaluate the relationship between RDW, UAR, and CACS among patients diagnosed with CAD at a tertiary care center. Despite its established role, CACS has certain limitations. It may not fully capture early non-calcified plaque burden and has limited discriminatory ability in intermediate-risk individuals. Additionally, it does not directly reflect the underlying inflammatory and oxidative processes involved in atherosclerosis. Therefore, there remains a need for simple, cost-effective, and widely available biomarkers that can complement CACS and improve cardiovascular risk stratification.
Methodology
Study Design and Population
A hospital-based cross-sectional observational study was performed at a tertiary cardiac care and research center in India between April 2022 and April 2024. The study included 250 patients with symptoms suggestive of CAD who underwent coronary CT angiography and were selected through convenient sampling. Sample size estimation was performed considering the anticipated association between the study biomarkers and CACSs, considering a confidence level of 95% and adequate statistical power. Patients with systemic inflammatory disease, hematological or thyroid disorders, pregnancy, poor general condition, contraindications to multidetector CT, previous coronary artery bypass surgery, prior percutaneous coronary intervention, clinical evidence of heart failure, or those who declined participation were excluded. In addition, subjects with clinical conditions known to influence serum uric acid or albumin levels, such as chronic kidney disease, chronic liver disease, gout, active infection, malignancy, and those receiving drugs affecting uric acid metabolism or serum albumin levels, were excluded from the study.
Imaging Protocol and Definitions
Coronary artery disease was defined as the presence of calcified or non-calcified atherosclerotic plaque detected on coronary CTA. Coronary artery calcium score was derived from electrocardiogram-gated non-contrast CT using the Agatston method, and patients were categorized into low (<100) and high (≥100) CACS groups. Coronary CTA was performed using a single-source 128-slice CT scanner (GE Revolution, GE Healthcare, Chicago, USA) using a rotation time of 280 ms, detector collimation of 128 × 0.625 mm, and a tube voltage between 70 and 140 kV. Oral metoprolol (50 mg) was administered when required for heart rate control.
Clinical and Laboratory Assessment
Baseline demographic and clinical data, including age, sex, hypertension, dyslipidemia, diabetes mellitus, smoking status, and family history of CAD, were recorded. The Framingham Risk Score was calculated to estimate the 10-year coronary heart disease risk according to the National Cholesterol Education Program Adult Treatment Panel III recommendations. RDW was assessed using an automated hematology analyzer (Sysmex XN-1000). Fasting venous blood samples were analyzed to estimate serum uric acid and albumin concentration, following which the UAR was calculated. Additional biochemical parameters, including lipid profile, serum creatinine, and troponin I, and all other biochemical analyses were carried out in the institute’s central laboratory using standardized operating procedures and routinely calibrated, quality-controlled automated analyzers. Serum uric acid, albumin, creatinine, lipid profile, and troponin I were measured using standard laboratory methods as per the manufacturer’s instructions. Informed written consent was obtained from every participant, and ethical approval for the study was granted by the Institutional Ethics Committee.
Statistical Analysis
Statistical analysis was carried out using Statistical Package for the Social Sciences software version 26. Continuous variables were presented as mean ± standard deviation (SD), whereas categorical data were summarized as frequencies and percentages. Comparisons between low (<100) and high (≥100) CACS groups were performed by applying an independent-sample t-test for continuous data and chi-square tests for categorical parameters. Pearson correlation analysis was performed to evaluate the relationship between RDW and the UAR and CACS. Univariate and multivariate logistic regression models were applied to determine predictors of elevated CACSs (≥100). A P value <.05 was considered statistically significant.
Results
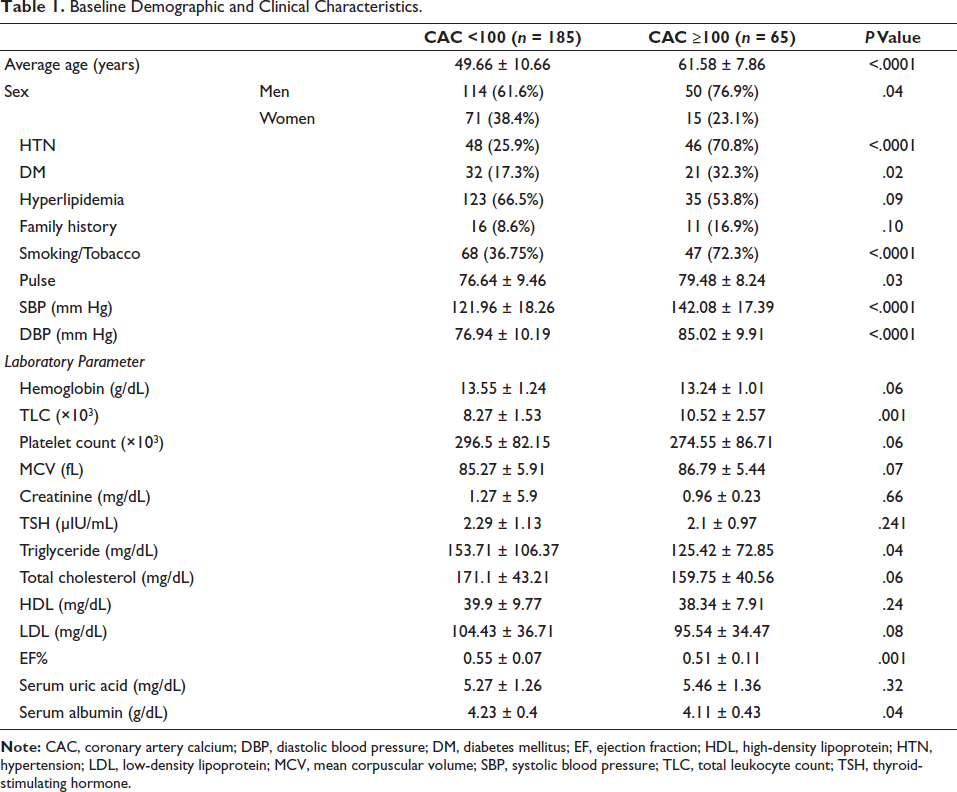
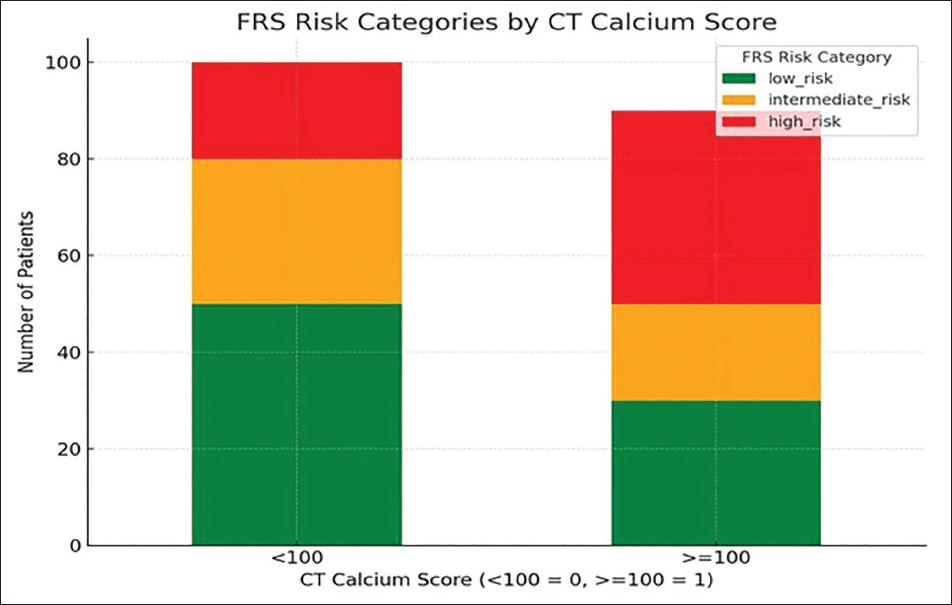
Baseline demographic and clinical features of the study participants, according to CACS categories, are presented in Table 1. Patients with a higher CACS (≥100) were significantly older than those belonging to the low CACS category (<100) (61.58 ± 7.86 years vs. 49.66 ± 10.66 years; P < .0001). Male participants were significantly more common among patients in the elevated CACS group compared with the low CACS group (76.9% vs. 61.6%; P = .04). The distribution of Framingham Risk Score categories according to CACS is illustrated in Figure 1. Among patients with CACS <100 (n = 185), 138 (55.2%) were in the low-risk category, 28 (11.2%) in the intermediate-risk group, while 19 patients (7.6%) belonged to the high-risk category. Among individuals with CACS ≥100 (n = 65), low-, intermediate-, and high-risk categories included 20 (8%), 20 (8%), and 25 (10%) patients, respectively.
Baseline Demographic and Clinical Characteristics.
Distribution of Framingham Risk Score Categories According to Coronary Artery Calcium Score.
Traditional major cardiovascular risk factors, such as hypertension, diabetes mellitus, and tobacco use, were observed more frequently in patients with CACS ≥100 (P < .05 for all), whereas hyperlipidemia and a family history of CAD did not differ significantly between the groups. Patients with higher CACS also had significantly higher pulse rates, systolic blood pressure, and diastolic blood pressure. Laboratory analysis showed a significantly higher total leukocyte count and a lower reduced left ventricular ejection fraction among patients with high CACS. Serum albumin levels were modestly but significantly lower among patients with higher CACS (4.11 ± 0.43 vs. 4.23 ± 0.40 g/dL; P = .04). Serum uric acid levels did not differ significantly between the groups (5.46 ± 1.36 vs. 5.27 ± 1.26 mg/dL; P = .32). Serum creatinine levels were also comparable between the two groups (0.96 ± 0.23 vs. 1.27 ± 5.9 mg/dL; P = .66), indicating no significant association with coronary calcium burden. Troponin I levels were measured; however, the difference between both groups was not statistically significant (P > .05).
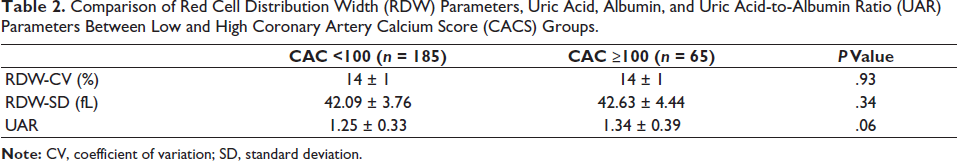
Table 2 shows the comparison of RDW parameters and UAR between the low and high CACS groups. There were no statistically significant differences in RDW-coefficient of variation (CV) or RDW-SD between the two groups. Although the UAR was numerically higher in patients with CACS ≥100, this difference did not reach statistical significance (P = .06).
Comparison of Red Cell Distribution Width (RDW) Parameters, Uric Acid, Albumin, and Uric Acid-to-Albumin Ratio (UAR) Parameters Between Low and High Coronary Artery Calcium Score (CACS) Groups.
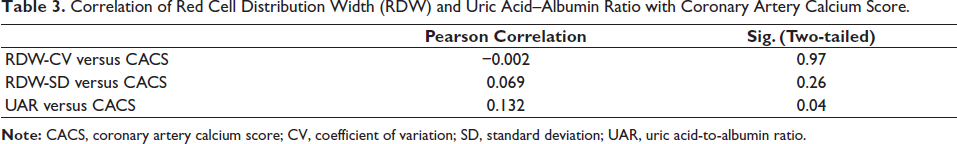
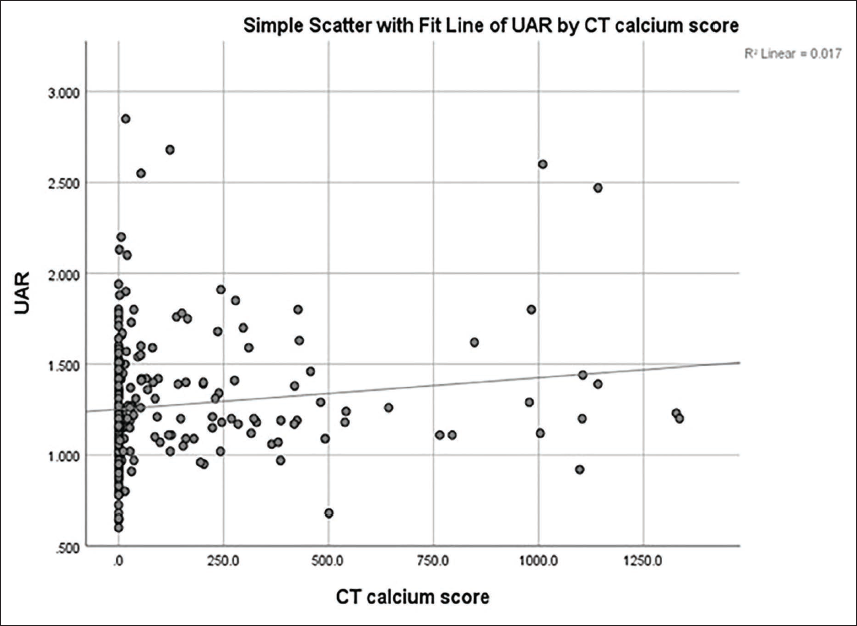
Pearson correlation analysis demonstrated no significant association between RDW-CV or RDW-SD and the CACS (Table 3). In contrast, the analysis demonstrated a weak positive correlation between the UAR and CACS (r = 0.132), indicating only a minimal association between higher UAR values and greater coronary calcification. The scatter plot depicting the association between UAR and CACS is shown in Figure 2 and demonstrates a mild upward trend consistent with the correlation findings. The strength of this correlation was low, suggesting that UAR alone is not a reliable predictor of coronary artery calcium burden as assessed by CT calcium scoring.
Correlation of Red Cell Distribution Width (RDW) and Uric Acid–Albumin Ratio with Coronary Artery Calcium Score.
Scatter Plot Showing the Association Between Uric Acid–Albumin Ratio and Coronary Artery Calcium Score.
Univariate and multivariable logistic regression analyzes identifying predictors of a high CACS (≥100) are summarized in Table 4. In univariate analysis, increasing age (OR 1.14; 95% CI 1.10-1.19; P < .001), male sex (OR 2.07; 95% CI 1.08-3.98; P < .001), hypertension (OR 6.91; 95% CI 3.69-12.94; P < .001), diabetes mellitus (OR 2.28; 95% CI 1.20-4.35; P = .012), smoking/tobacco use (OR 4.49; 95% CI 2.42-8.35; P < .001), and lower ejection fraction (OR 0.95; 95% CI 0.92-0.98; P = .002) were significantly associated with high CACS.
Univariate and Multivariable Logistic Regression Analysis for Predictors of High Coronary Artery Calcium Score (≥100).
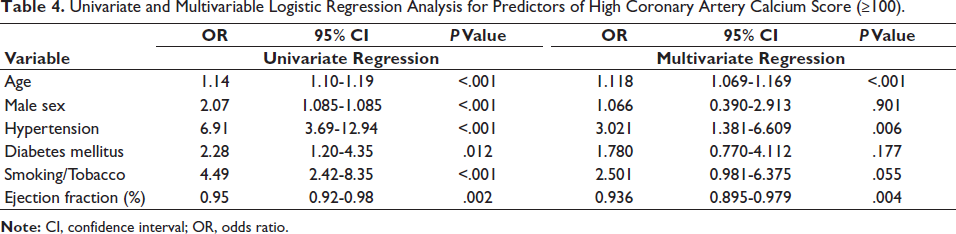
After adjustment in multivariable analysis, increasing age (OR 1.12; 95% CI 1.07-1.17; P < .001), hypertension (OR 3.02; 95% CI 1.38-6.61; P = .006), and lower ejection fraction (OR 0.94; 95% CI 0.90-0.98; P = .004) remained independent predictors of high CACS. Male sex (OR 1.07; 95% CI 0.39-2.91; P = .901), diabetes mellitus (OR 1.78; 95% CI 0.77-4.11; P = .177), and smoking/tobacco use (OR 2.50; 95% CI 0.98-6.38; P = .055) did not retain statistical significance.
Discussion
In our study, we did not find a strong link between RDW and coronary artery calcium burden. This actually fits with what a lot of recent research is showing: RDW seems to mainly pick up on systemic inflammation, how severe the disease is overall, and long-term prognosis rather than the actual amount of calcified plaque in the arteries.14, 15 Earlier studies did report some connection between RDW and CAD severity, but more recent work has shown that this relationship is not always consistent. It often depends on things like the type of patients studied, their level of inflammation, and other health conditions they have. 16 That probably explains why we saw no real correlation between RDW and CACS in our group of stable CAD patients.
When it comes to UAR, we found only a weak positive correlation with the CACS—meaning there is just a small association with coronary calcification. Uric acid-to-albumin ratio combines the pro-oxidant and inflammatory effects of uric acid with the protective antioxidant and anti-inflammatory role of albumin, so it makes biological sense as a marker of vascular inflammation.17, 18 Several previous studies have connected higher UAR to more severe CAD, worse coronary blood flow, and poorer cardiovascular outcomes.19, 20 Still, there is not much direct evidence yet linking UAR specifically to coronary calcification. The modest relationship we observed suggests that UAR might be useful as an extra supportive marker rather than something that can stand alone to show calcific atherosclerosis. However, despite this statistically significant correlation (P = .04), the strength of the association was weak (r = 0.132), and UAR did not demonstrate sufficient discriminatory ability to be used as a standalone predictive marker for coronary artery calcification severity.
We also noticed that patients with higher CACS tended to have higher blood pressure, faster pulse rates, raised leukocyte counts, lower ejection fractions, and lower serum albumin levels. Together, these point to a more unfavorable inflammatory and hemodynamic picture in people with advanced atherosclerosis. On multivariable analysis, older age, hypertension, and reduced ejection fraction came out as independent predictors of high CACS—results that line up well with other imaging studies showing how structural coronary disease and heart muscle function are closely connected.21, 22 The fact that higher CACS matched up with higher categories of the Framingham Risk Score also supports the idea that CACS is a valuable tool for overall cardiovascular risk assessment.
Conclusion
In the present cross-sectional study, higher CACSs were independently associated with advancing age, hypertension, and reduced left ventricular ejection fraction, supporting the role of CACS as an important indicator of atherosclerotic burden and cardiovascular risk assessment. RDW, assessed as RDW-CV and RDW-SD, showed no significant association with the CACS. The UAR demonstrated only a weak positive correlation with coronary calcification and did not independently predict a high calcium burden. Overall, CACS outperformed RDW and UAR in risk stratification, highlighting its continued importance as a major imaging modality for CAD evaluation.
Authors’ Contributions
Dr. AM: Concepts, design, literature search, data analysis, manuscript preparation, guarantor.
Dr. JP: Concepts, design, definition of intellectual content, manuscript preparation.
Dr. RT: Literature search, data acquisition.
Dr. AK: Literature search, data acquisition.
Ms. M: Data analysis, statistical analysis.
Dr. JP: Literature search, data acquisition.
Dr. VA: Literature search, data acquisition.
Footnotes
Declaration of Conflict of Interests
The authors declared no potential conflicts of interest regarding the research, authorship, and/or publication of this article.
Ethical Approval
The study was approved by the Institutional Ethics Committee with EC number UNMICRC/CARDIO/2022/01.
Funding
The authors received no financial support for the research, authorship, and/or publication of this article.
Informed Consent
Written informed consent was taken from the patient or their relatives.