
Abstract
This article presents recommendations for nonlinear site amplification models in Central and Eastern North America (CENA), which are developed from one-dimensional site response analyses results and accompanies linear site amplification model in a companion article. Two median nonlinear amplification models using identical functional forms are produced as a function of VS30 and peak ground acceleration for reference conditions (PGAr) of VS = 3000 m/s and VS30 = 760 m/s. An epistemic uncertainty model on median nonlinear amplification is proposed as a piecewise functional form to generate reasonable variations of nonlinear amplification across the period and VS30 ranges of interest. Limitations of the models are based on both the methodology of the model derivation and assumptions of nonlinear amplification model forms.
Introduction
The Next Generation Attenuation East (NGA-East) Project is a multi-disciplinary research project coordinated by the Pacific Earthquake Engineering Research Center (PEER) that generated a list of ground motion models (GMMs) for Central and Eastern North America (CENA). This current generation of GMMs developed for CENA during the NGA-East project are presented in Goulet et al. (2017). Most of these models produce ground motion intensity measure estimations as a function of earthquake source and wave propagation path for sites with a hard-rock reference condition with shear wave velocity VS = 3000 m/s and diminution parameter κ0 = 0.006 s.
In the current versions of USGS national seismic hazard maps (NSHM) in the CENA region (Petersen et al., 2015), a previous generation of GMMs, which were reviewed by an international team of experts as a part of the global earthquake model project (Stewart et al., 2015), are used. In general, these models do not include terms for nonlinear site effects, or the site effect terms in these models are not applicable for use in CENA (Stewart et al., 2015)
The two generations of models above have been developed for a hard-rock reference condition similar to the condition of VS = 3000 m/s (Hashash et al., 2014). However, NSHMs have been produced relative to reference condition of VS30 = 760 m/s (Frankel et al., 1996; Petersen et al., 2008, 2014) where VS30 is the time averaged shear wave velocity in the top 30 m of a site. This incompatibility of reference-rock condition between GMMs and hazard maps reveals the need to correct hard-rock GMMs to a 760 m/s reference condition.
This document is a companion article to Stewart et al. (in press), which presents a linear site amplification model developed by an expert panel (i.e. the authors of that article). This article presents recommendations for the nonlinear component of site amplification models for reference conditions of both 760 and 3000 m/s, which are previously presented in PEER Report 2017/05 (Hashash et al., 2017). As updates to Hashash et al. (2017), this article presents (1) coefficients for nonlinear site amplification median and uncertainty models at additional periods, (2) coefficients for a nonlinear peak ground velocity (PGV) amplification model, and (3) revision to nonlinear amplification term.
It should be noted that this report refers to several linear and nonlinear site amplification models from NGA-East Geotechnical Working Group (GWG) developed in Harmon et al. (2019b) and Parker et al. (2019). A key objective of this article is to describe judgments made by the expert panel to adapt the Harmon et al. (2019b) nonlinear model for application to USGS maps.
Recommended nonlinear amplification model
Approach
The response spectrum (RS) amplification (FS) is commonly represented as the sum of an intensity independent linear amplification component (Flin) and a nonlinear site amplification (Fnl) component as given in Equation 1:

The following sections present two recommended nonlinear site amplification models with epistemic uncertainty relative to reference conditions of 760 and 3000 m/s for Fnl. The model for a reference condition of 3000 m/s is the N2 amplification model presented in Harmon et al. (2019b), and the nonlinear model relative to 760 m/s is derived from the GWG-S nonlinear amplification model and is presented in Hashash et al. (2017). The suite of models in Harmon et al. (2019b) are hereafter referred to as the GWG Simulation-based (GWG-S) models. The conversion between the 760 and 3000 m/s reference conditions is applied on the input peak ground acceleration (PGA) at rock outcrop and is adopted from the depth-independent 760/3000 m/s correction at oscillator period (TOSC, that is, the response spectral period under consideration) of 0.001 s resulting from the linear amplification simulations in Harmon et al. (2019a) used to derive the GWG-S median models.
A judgment-based epistemic uncertainty on the recommended median nonlinear amplification models is derived from the functional form of the recommended nonlinear GWG-S median models (Hashash et al., 2017) and is developed with the objective of producing reasonable variations of Fnl across period and VS30 ranges of interest.
Recommended model form and coefficients
This study recommends the median nonlinear amplification model form given in Equation 2 as
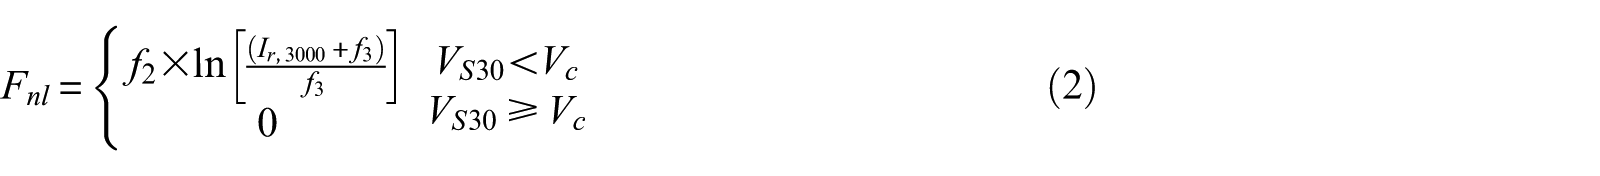
where Ir,3000 is the intensity measure (PGA at rock outcrop) for a reference condition of 3000 m/s, Vc is a period dependent limiting site VS30 for nonlinearity, f3 is a model coefficient, and f2 is defined in Equation 3 as

where f4 and f5 are model coefficients, and Vref is the reference-rock condition of 3000 m/s. Model coefficients are given in Figure 1 and Table 1. Figure 1 compares the coefficients of the recommended model and those provided in Seyhan and Stewart (2014) (for the Western United States) to emphasize that regional variations in nonlinear site amplification are expected.
Coefficients for the Fnl nonlinear amplification model and associated epistemic uncertainty model
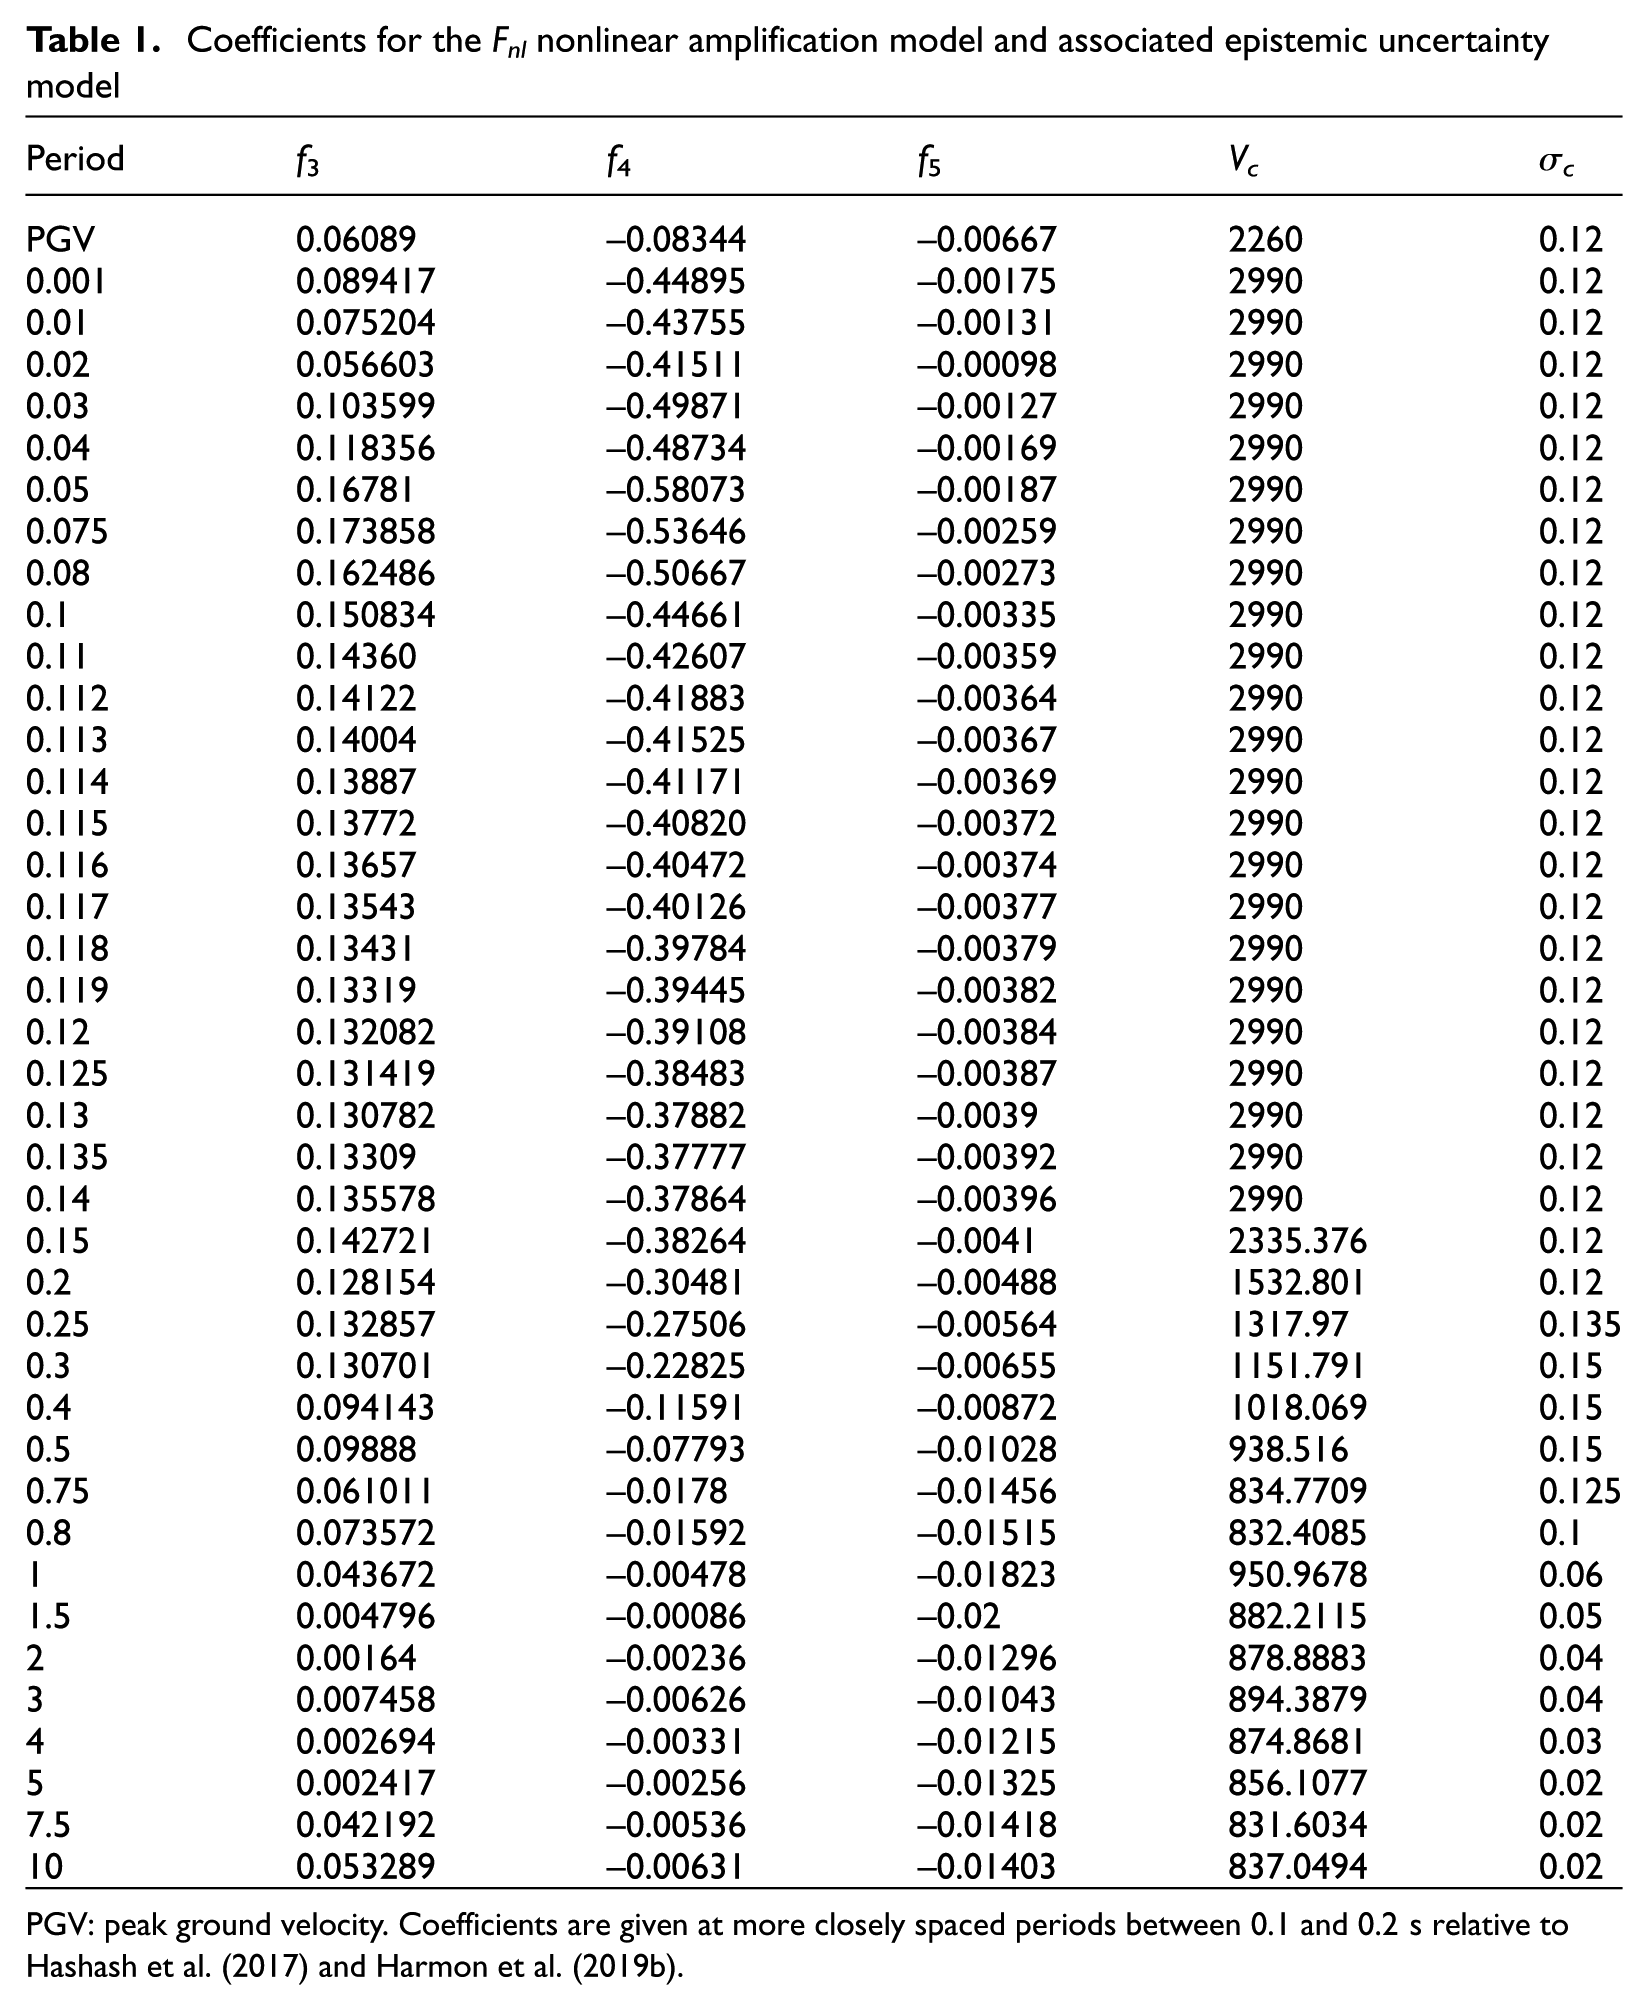
PGV: peak ground velocity. Coefficients are given at more closely spaced periods between 0.1 and 0.2 s relative to Hashash et al. (2017) and Harmon et al. (2019b).
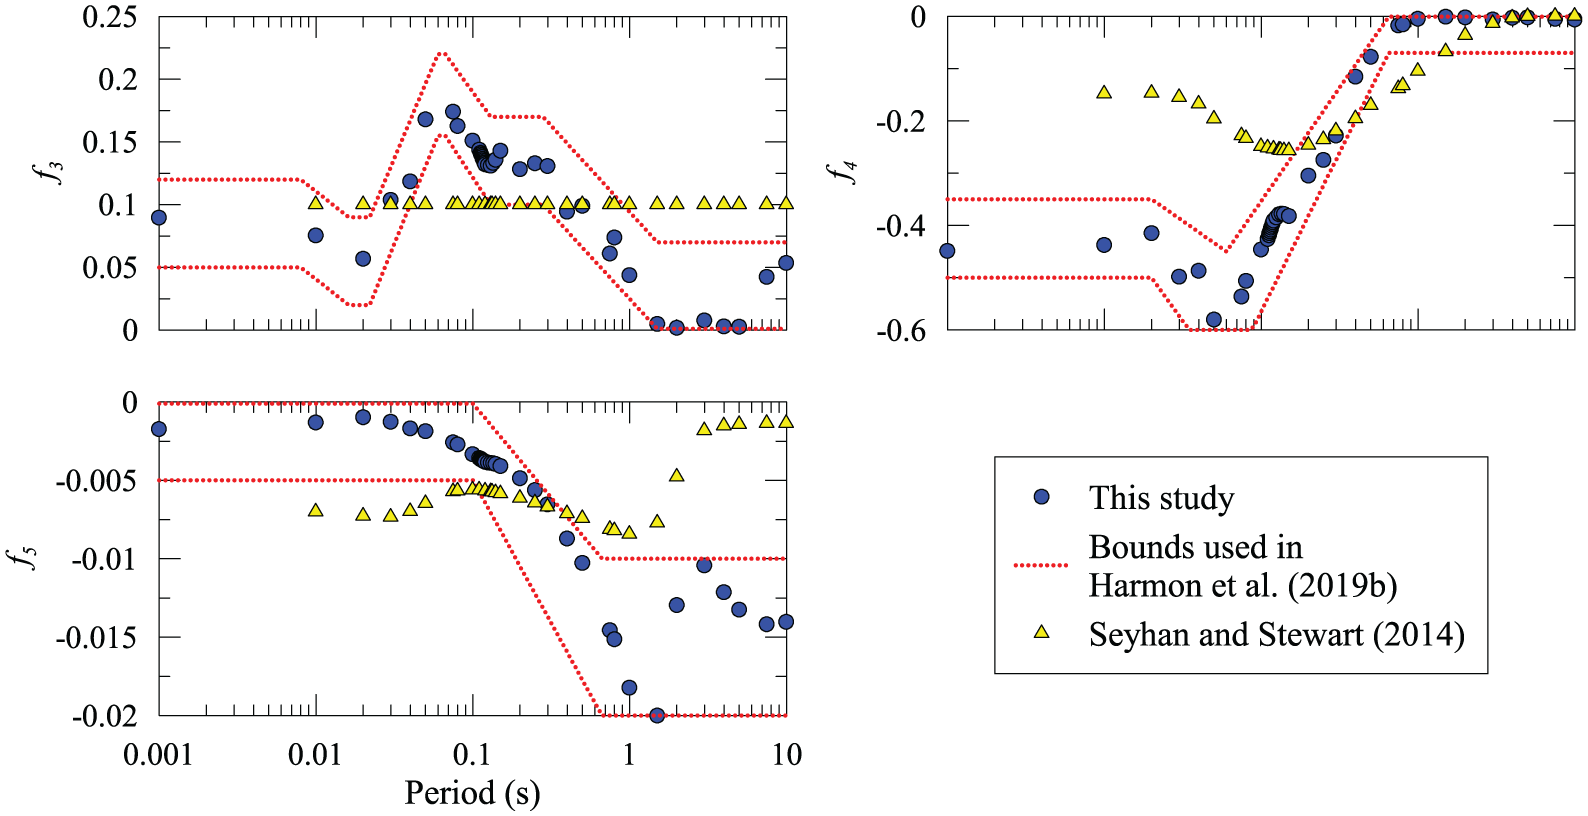
Coefficients of response spectrum nonlinear amplification recommended model relative to 3000 m/s as originally provided in Hashash et al. (2017) and as interpolated for more closely spaced periods between 0.1 and 0.2 s (Table 1). Dotted red lines indicate bounds used in regressions of coefficients in Harmon et al. (2019b). Seyhan and Stewart (2014) model coefficients are also provided to be compared with those in this study.
The model form in Equation 2 can be modified using the reference-rock conversion in Equation 4 to provide the recommended median nonlinear amplification model for reference condition of VS30 = 760 m/s,

where Ir,760 is the rock outcrop PGA relative to 760 m/s, and C760/3000 is a conversion factor from a reference condition of 760–3000 m/s. C760/3000 is the depth-independent 760–3000 m/s correction factor at 0.001 s presented in Harmon et al. (2019b) and is given as 2.275. In addition, the Vref parameter in Equation 3 is modified to 760 m/s for TOSC < 0.4, but is retained as 3000 m/s for TOSC ≥ 0.4 s.
The epistemic uncertainty model recommended in this study for the nonlinear amplification models relative to both 3000 and 760 m/s is computed using the functional form in Equation 5 as
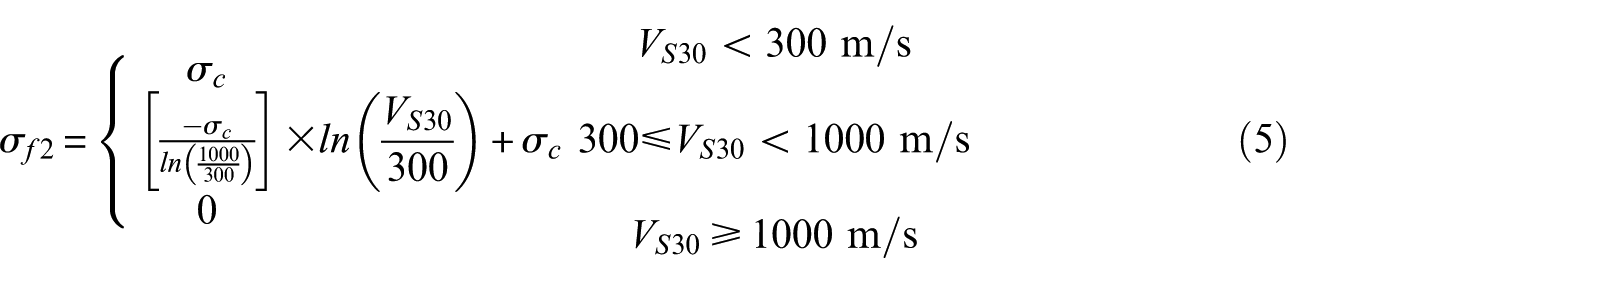
where σc is given in Table 1 for 39 periods between 0.001 and 10.0 s. If the epistemic uncertainty of the nonlinear and linear amplification models are assumed as uncorrelated, the combined site response uncertainty can be taken as

where σnl represents the epistemic uncertainty of the recommended nonlinear amplification model and is calculated from application of the σf2 on f2 term in Equation 2. σlin accounts for the epistemic uncertainty of the recommended linear amplification model (Stewart et al., 2019) and is defined as the square root of sum of squares error of the σv and σ760 terms, the epistemic uncertainty of the linear amplification model relative to 3000 m/s and the uncertainty of the reference site factor (F760) representing the amplification of a VS30 = 760 m/s site condition relative to a 3000 m/s reference condition, respectively.
Nonlinear amplification models
Prior work on amplification functions
CENA is a stable continental region (SCR) and is located far from the plate boundaries that are typically the source of earthquakes in active tectonic regions. GMMs for SCRs are typically developed from sparse datasets with relatively weak ground motions or are adjusted from GMMs for active tectonic regions. For low intensity ground motions, the soil at a site experiences low levels of strain, and the response of the site is approximately the linear site amplification (Flin). Because of the sparse nature of site condition and ground motion data in CENA (Goulet et al., 2014), site response simulations have been used to evaluate nonlinear site amplification to supplement the linear amplification models developed using the low intensity datasets characteristic of SCRs.
Site amplification model forms are generally defined as functions of site condition (usually VS30) and ground motion intensity measures. The Choi and Stewart (2005) site amplification models propose separate model terms for linear amplification as a function of VS30 and nonlinear amplification as a function of both VS30 and PGA at reference-rock condition, PGAr, commonly referred to as the driver of nonlinearity for these models.
Simulation-based nonlinear amplification models have been previously adopted to constrain the nonlinear site effects in empirical models. Walling et al. (2008) for the Next Generation Attenuation relationships (NGA-West) project used the results of one-dimensional (1-D) ground response simulations to develop a model with linear VS30-scaling (i.e. a linear increase in the log-amplification of a site with decreasing log-VS30) model terms and nonlinear site amplification terms as a function of both VS30 and PGAr. This functional form was also used by Sandikkaya et al. (2013) to model empirical site amplification data. Kamai et al. (2014) updated the constraints on nonlinearity for the subsequent NGA-West2 project through additional 1-D simulations using a wider range of site conditions along with two alternative formulations: using PGAr or Sa(TOSC) as the driver of nonlinearity, where Sa(TOSC) is the spectral acceleration (SA) from the 5% damped RS at the period of interest. The Chiou and Youngs (2008, 2014) and Abrahamson and Silva (2008)/Abrahamson et al. (2014) site amplification models distinguish the linear and nonlinear amplification components, with the linear component constrained empirically and the nonlinear component taken from Walling et al. (2008) or Kamai et al. (2014). The site amplification function proposed by Seyhan and Stewart (2014) similarly constrains the linear term empirically, but the nonlinear term is developed in consideration of data analysis and simulations. A term in their nonlinear model is modified from the nonlinear site amplification model in Chiou and Youngs (2008).
The next sections present recommended median site amplification models for reference conditions of 3000 and 760 m/s with estimated epistemic uncertainty. The functional form of the epistemic uncertainty of the recommended median models is derived from visual inspection of the site amplification. The recommendations presented in this study are updates to the models originally proposed in Hashash et al. (2017). Changes to the Hashash et al. (2017) models are due to not accounting for nonlinearity at sites with VS30 ≥ 760 m/s for strong shaking at short periods as detailed below.
Recommended RS amplification model formulations
The next two sections present the recommended median nonlinear site amplification models relative to a 3000 and 760 m/s reference site condition originally proposed in Hashash et al. (2017) and the adjustments to the nonlinear model term along with model coefficients at additional periods.
GWG-S nonlinear site amplification model relative to 3000 m/s reference condition
As a part of the NGA-East GWG, two nonlinear site amplification models relative to a reference condition of VS = 3000 m/s were developed in Harmon et al. (2019b), which are denoted as the N1 and N2 amplification models. The nonlinear amplification models were regressed using the difference between nonlinear and linear site amplifications obtained from a large suite of 1-D linear and nonlinear site response simulations (Harmon et al., 2019a). To capture the variability and uncertainty of site conditions in CENA, that parametric study used 13 representative seed VS profiles assigned by geology-dependent soil and strength properties, and 30 random realizations on these profiles and random realizations of dynamic nonlinear curves by Darendeli (2001). The rock outcrop motions used in the parametric study include 247 motions of which (1) 186 synthetic and recorded rock motions are from NUREG-6728 (McGuire et al., 2001) and (2) 61 motions are generated using point source stochastic simulations (SMSIM; Boore, 2005) for different magnitude and distance ranges. The N1 and N2 models use the same functional form as Seyhan and Stewart (2014) (i.e. Equations 2 and 3) with different model coefficients and adopt Sa(TOSC) and PGA at rock outcrop as drivers of nonlinearity, respectively. The N2 model is recommended because of the uncertainty in the correlation between Sa(TOSC) and PGA and the ease of implementation within the framework of the USGS hazard maps. The N2 model is hereafter referred to as the GWG-S nonlinear model. The Vc parameter in the GWG-S model is a velocity condition where site amplification relative to the reference-rock condition of 3000 m/s is not observed and comes from the VS30-based linear (L1) model in Harmon et al. (2019b) for linear amplification. The Vc values in the GWG-S model were included in the model for stability and are high VS30 values above which little to no site nonlinearity is observed in mean amplification data.
It should be noted that model coefficients at additional periods from those in Hashash et al. (2017) are required for compatibility with Stewart et al. (in press). Table 1 provides the additional model coefficients for PGV, and SA at periods of 0.001, 0.01, 0.02, 0.03, 0.04, 0.05, 0.075, 0.11, 0.12, 0.13, 0.14, 0.15, 0.25, 0.75, and 1.5 s. In addition, denser coefficients than those provided in the Harmon et al. (2019b) source model are required for periods between 0.1 and 0.2 s. These coefficients in Table 1 are estimated via log-linear interpolation.
GWG-S nonlinear amplification model relative to 760 m/s reference condition
The GWG-S nonlinear amplification model is developed for a reference-rock condition of 3000 m/s. A method of converting the GWG-S model to a 760 m/s reference condition is proposed by Hashash et al. (2017) by converting PGA between reference conditions as follows:

where Ir,3000 is the PGAr for a 3000 m/s condition, Ir,760 is the PGAr for a 760 m/s condition, and C760/3000 is a conversion factor obtained from the depth-independent 760 / 3000 correction of Harmon et al. (2019b) at TOSC = 0.001 s (to approximate PGAr). C760/3000 is derived from 29,541 linear site response simulations for sites with 700 m/s ≤ VS30 ≤ 800 m/s. The correction term C760/3000 is computed as

where ln(Amp(VS30 = 760 m/s)) is the natural logarithmic mean of the amplification for sites with VS30 between 700 and 800 m/s relative to sites with VS30 = 3000 m/s. The simulation data used for the calculation of C760/3000 are presented in Figure 2, in which a sudden drop in linear amplification is observed after VS30 ≈ 1800 m/s, representing the boundary between near-surface rock sites (or a weathered rock zone) and those with soil material underlined by a hard-rock condition (VS = 3000 m/s). Because near-surface rock sites have a lower impedance contrast relative to soil sediments underlined by hard rock, less amplification is observed at these sites.
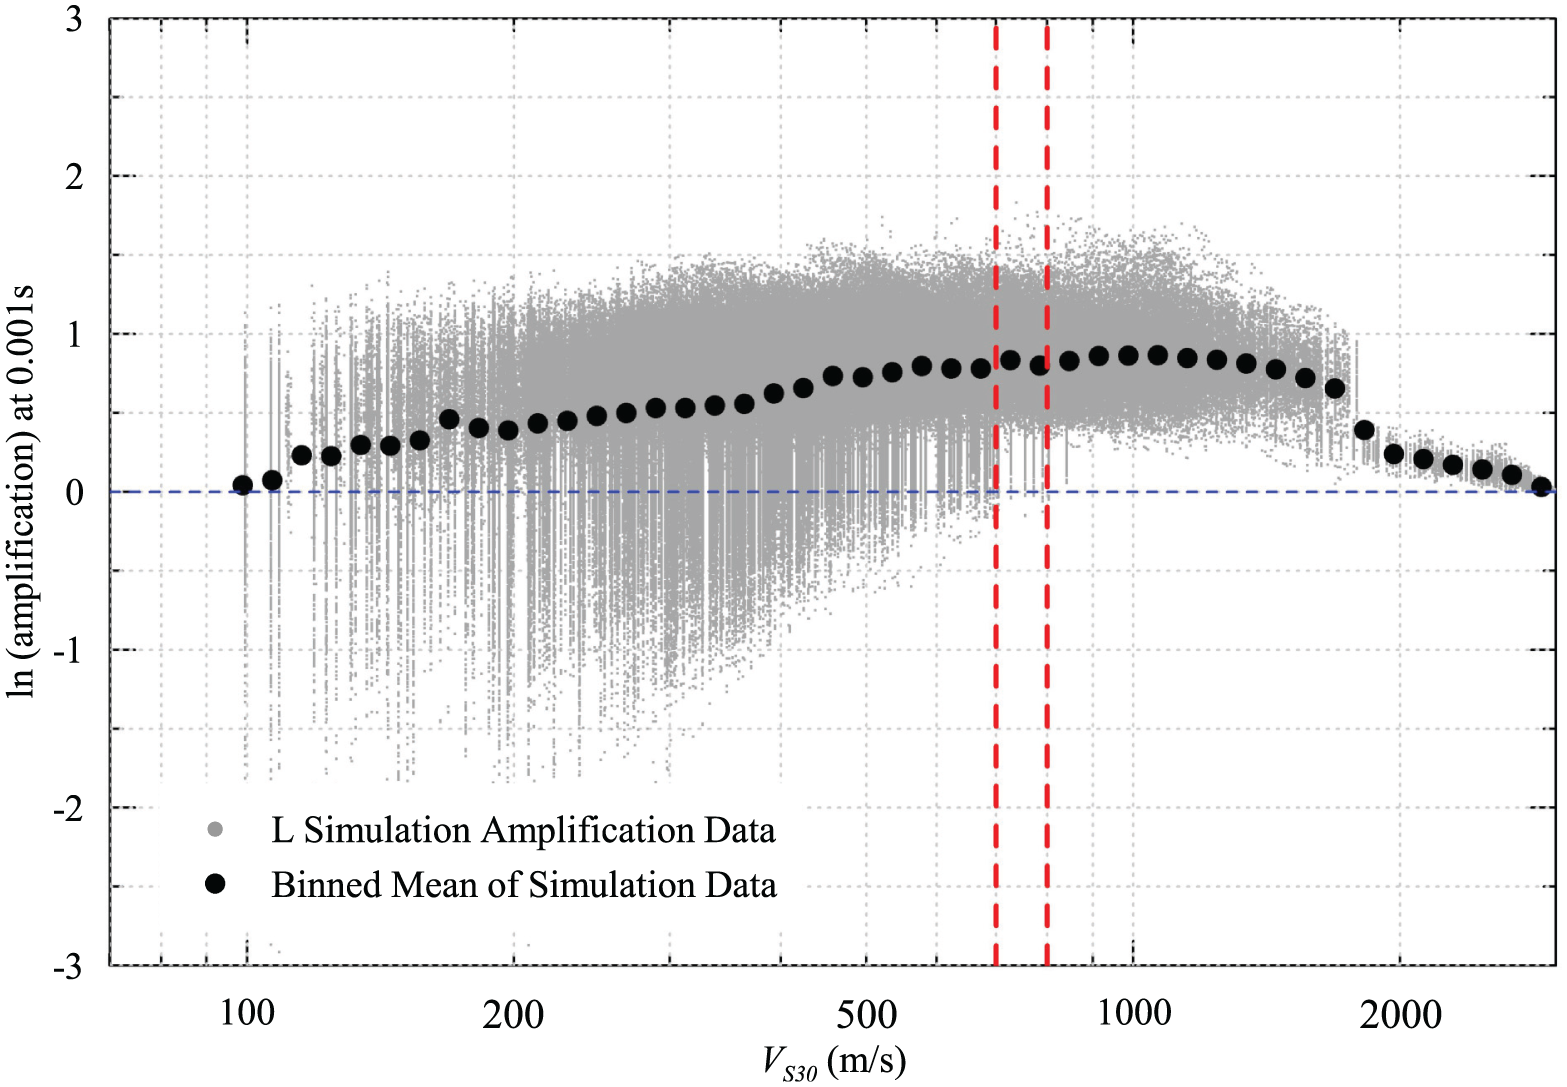
One-dimensional linear simulation amplification results and their binned means in log10(VS30) space for pseudo spectral acceleration at oscillator period of 0.001 s. The red lines denote the data range used to calculate 760/3000 correction value (C760/3000).
Using the Hashash et al. (2017) model for Fnl, a small amount of nonlinearity in site amplification is encountered for VS30 = 760 m/s at short periods, as evident from the reduction in response spectral amplification, FS, as given in Figure 3(a). The expert panel decided to remove this nonlinearity by adjusting the Fnl model above VS30 = 760 m/s (Figure 3). In Hashash et al. (2017), nonlinearity is quantified by the f2 term, with the Vref parameter set to 3000 m/s, which results in some nonlinearity for 760 m/s ≤ VS30 < Vref. The panel recommended to retain Vref = 3000 m/s for oscillator periods of 0.4 s and greater, but to set Vref = 760 m/s for shorter periods (Equation 3.3 in Hashash et al., 2017). This discontinuity produces a step in the Fnl term at 0.4 s, but it is sufficiently small as to be of negligible importance (Figure 3(b)).
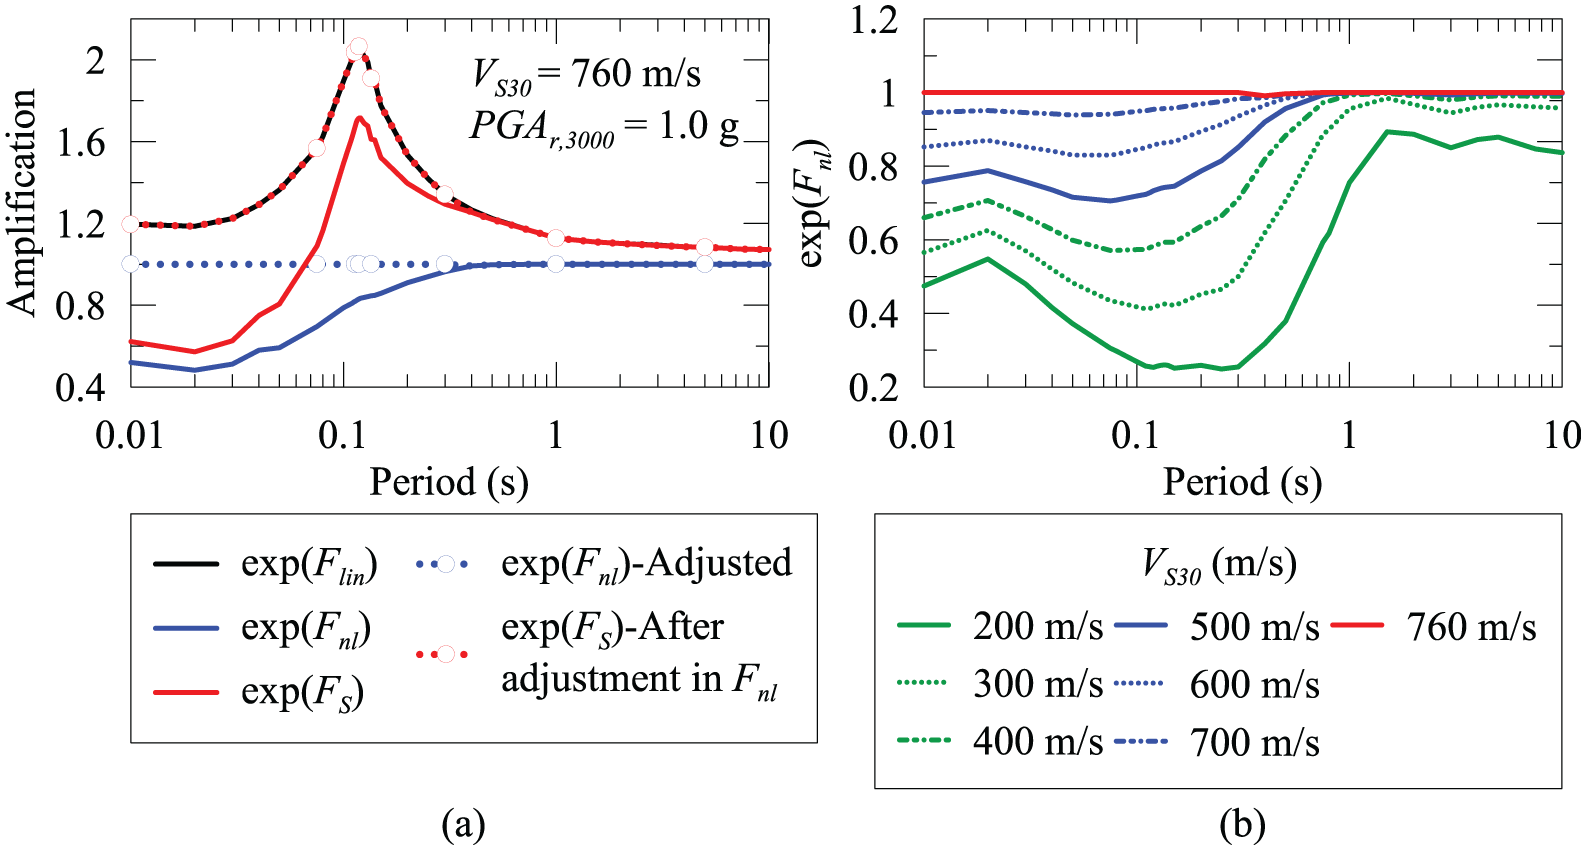
(a) Previous (solid red) and corrected (dashed red) FS term after adjustment to Fnl model (dashed blue) for VS30 = 760 m/s and PGAr,3000 = 1.0 g. (b) Adjusted Fnl term for various VS30 values and PGAr,3000 = 1.0 g to show that any undesired step in Fnl term does not occur for sites of VS30 < 760 m/s subjected to strong shaking.
GWG-S nonlinear amplification model with modified coefficients
As part of its work on the 2018 NSHM (Petersen et al., 2020), the USGS implemented the nonlinear amplification model described in the previous section, the linear amplification model (Stewart et al., 2019), and NGA-East GMMs (Goulet et al., 2017) to compute median ground motions for various combinations of magnitude, distance, and site condition (corresponding to various NEHRP (National Earthquake Hazards Reduction Program) site classes). For cases involving strong shaking on the reference site condition (large
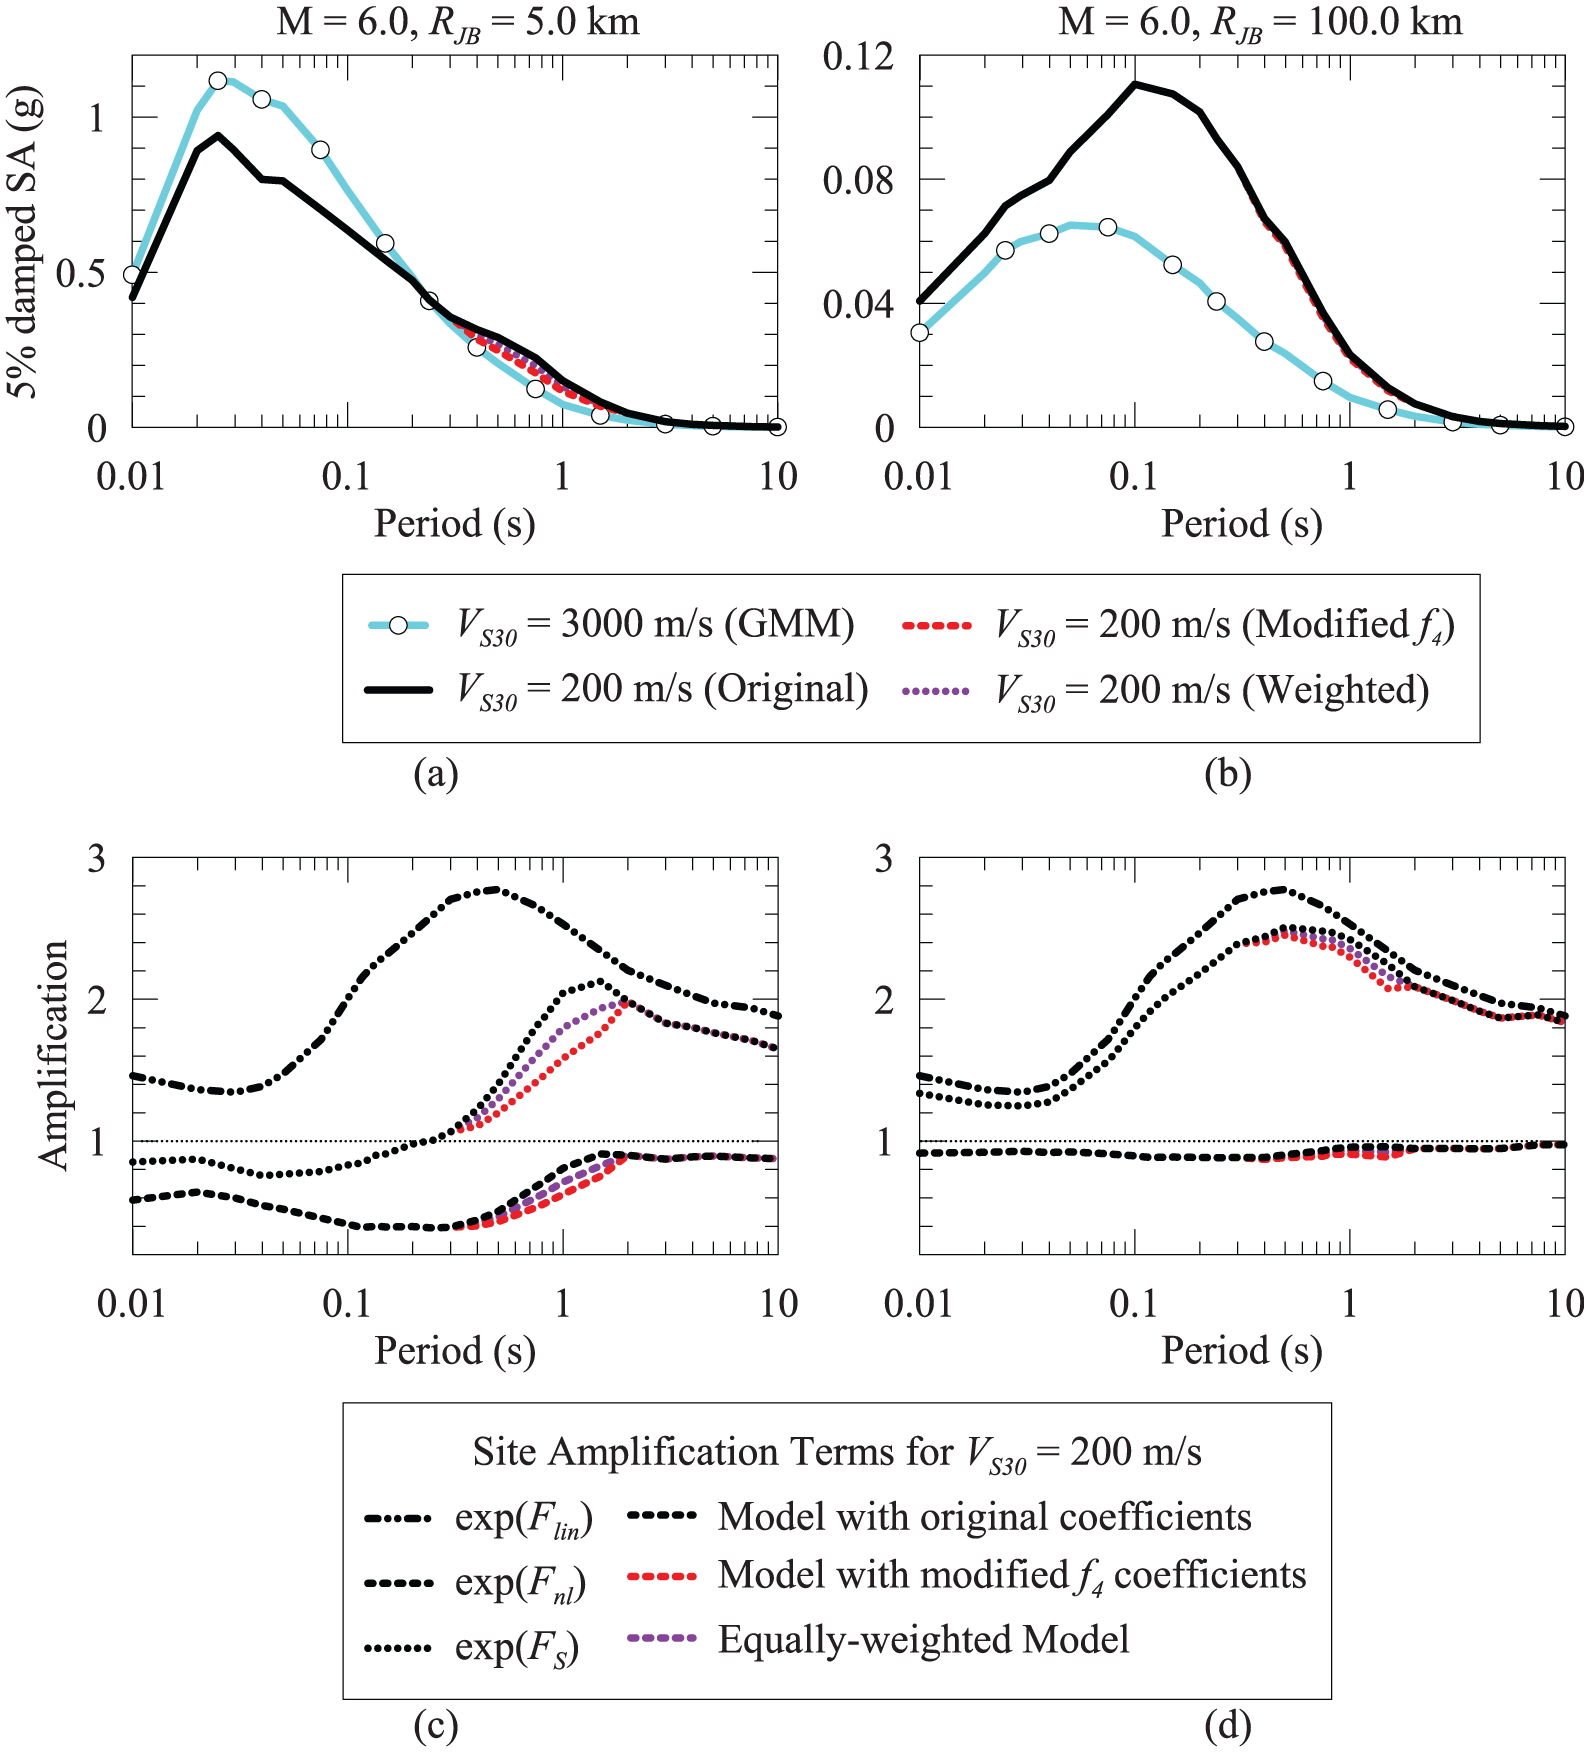
(a) GMM (Darragh et al., 2015) estimations relative to VS30 = 3000 m/s and 5% damped SA surface obtained from multiplication of GMM by exp(FS) terms using nonlinear amplification models with original coefficients (Table 1), modified f4 coefficients (Table 2) and equally weighted model for sites of VS30 = 200 m/s, and (c) corresponding linear (exp(Flin)), nonlinear (exp(Fnl)), and total (exp(FS)) amplification terms for strong shaking scenario of M = 6.0, RJB = 5.0 km. (b) and (d) illustrate the same for low shaking scenario of M = 6.0, RJB = 100.0 km. PGAr estimations for two shaking levels are calculated through Darragh et al. (2015) as 0.44 and 0.028 g, respectively.
The authors of this article developed alternate interpretations of this feature in the ground motion. One interpretation is that the peak is caused by resonance effects that are different for weak and strong shaking conditions, with the peak emerging at relatively long periods (near 1.0 s) for strong shaking conditions but being hidden for weak shaking conditions within the reference site spectral peak (approximately 0.01–0.2 s). According to this interpretation, as a feature with physical meaning, the peak should be retained in the model. A second interpretation is based on the observation (illustrated in Figure 4) that while the GMM spectral shape and linear site amplification shape are smooth with period, the nonlinear component ramps gradually upward toward zero as period increases toward 1.0 s. The shape of the ramp matches the peak in the spectrum, and hence is the cause of the peak. Accordingly, given that the shape of this nonlinear model represents a modeling decision, and different decisions could be made regarding that shape, the second interpretation concludes that the peak feature in the spectrum is a model artifact that perhaps should not be included in an ergodic model.
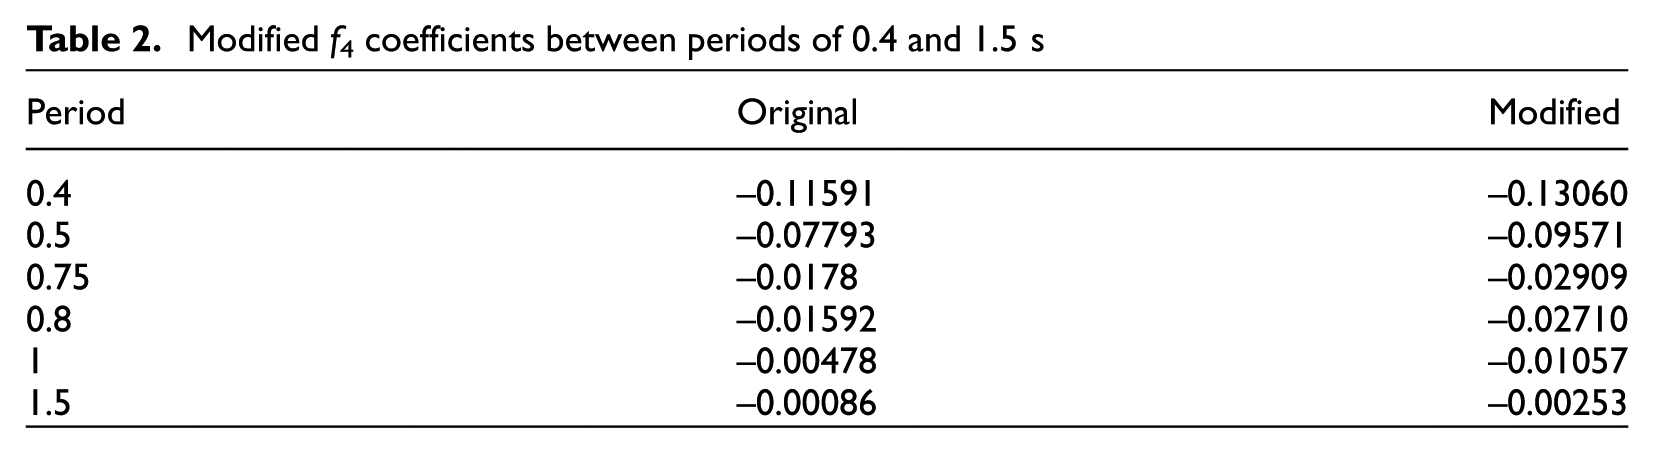
Given that both interpretations are viable, it was decided to retain the original nonlinear model as one option, but also to develop an alternative model in which different modeling decisions were made that would smooth across the peak for strong shaking, soft soil conditions. This was achieved by reducing f4 coefficients between TOSC of 0.4 and 1.5 s (Table 2) by judgment. This has the effect of increasing nonlinearity, and reducing ground motions, within the period range, thus smoothing out the peak in surface SA. In addition, a weighted nonlinear amplification model based on equal weights given to f2 coefficients for the original and modified models (Tables 1 and 2, respectively) could potentially be used. This model is referred to as an “equally weighted nonlinear amplification model” subsequently. Figures 5 to 7 illustrate the comparison of GWG-S models relative to 3000 and 760 m/s reference conditions for TOSC of 0.1, 0.4, and 1.0 s.
Modified f4 coefficients between periods of 0.4 and 1.5 s
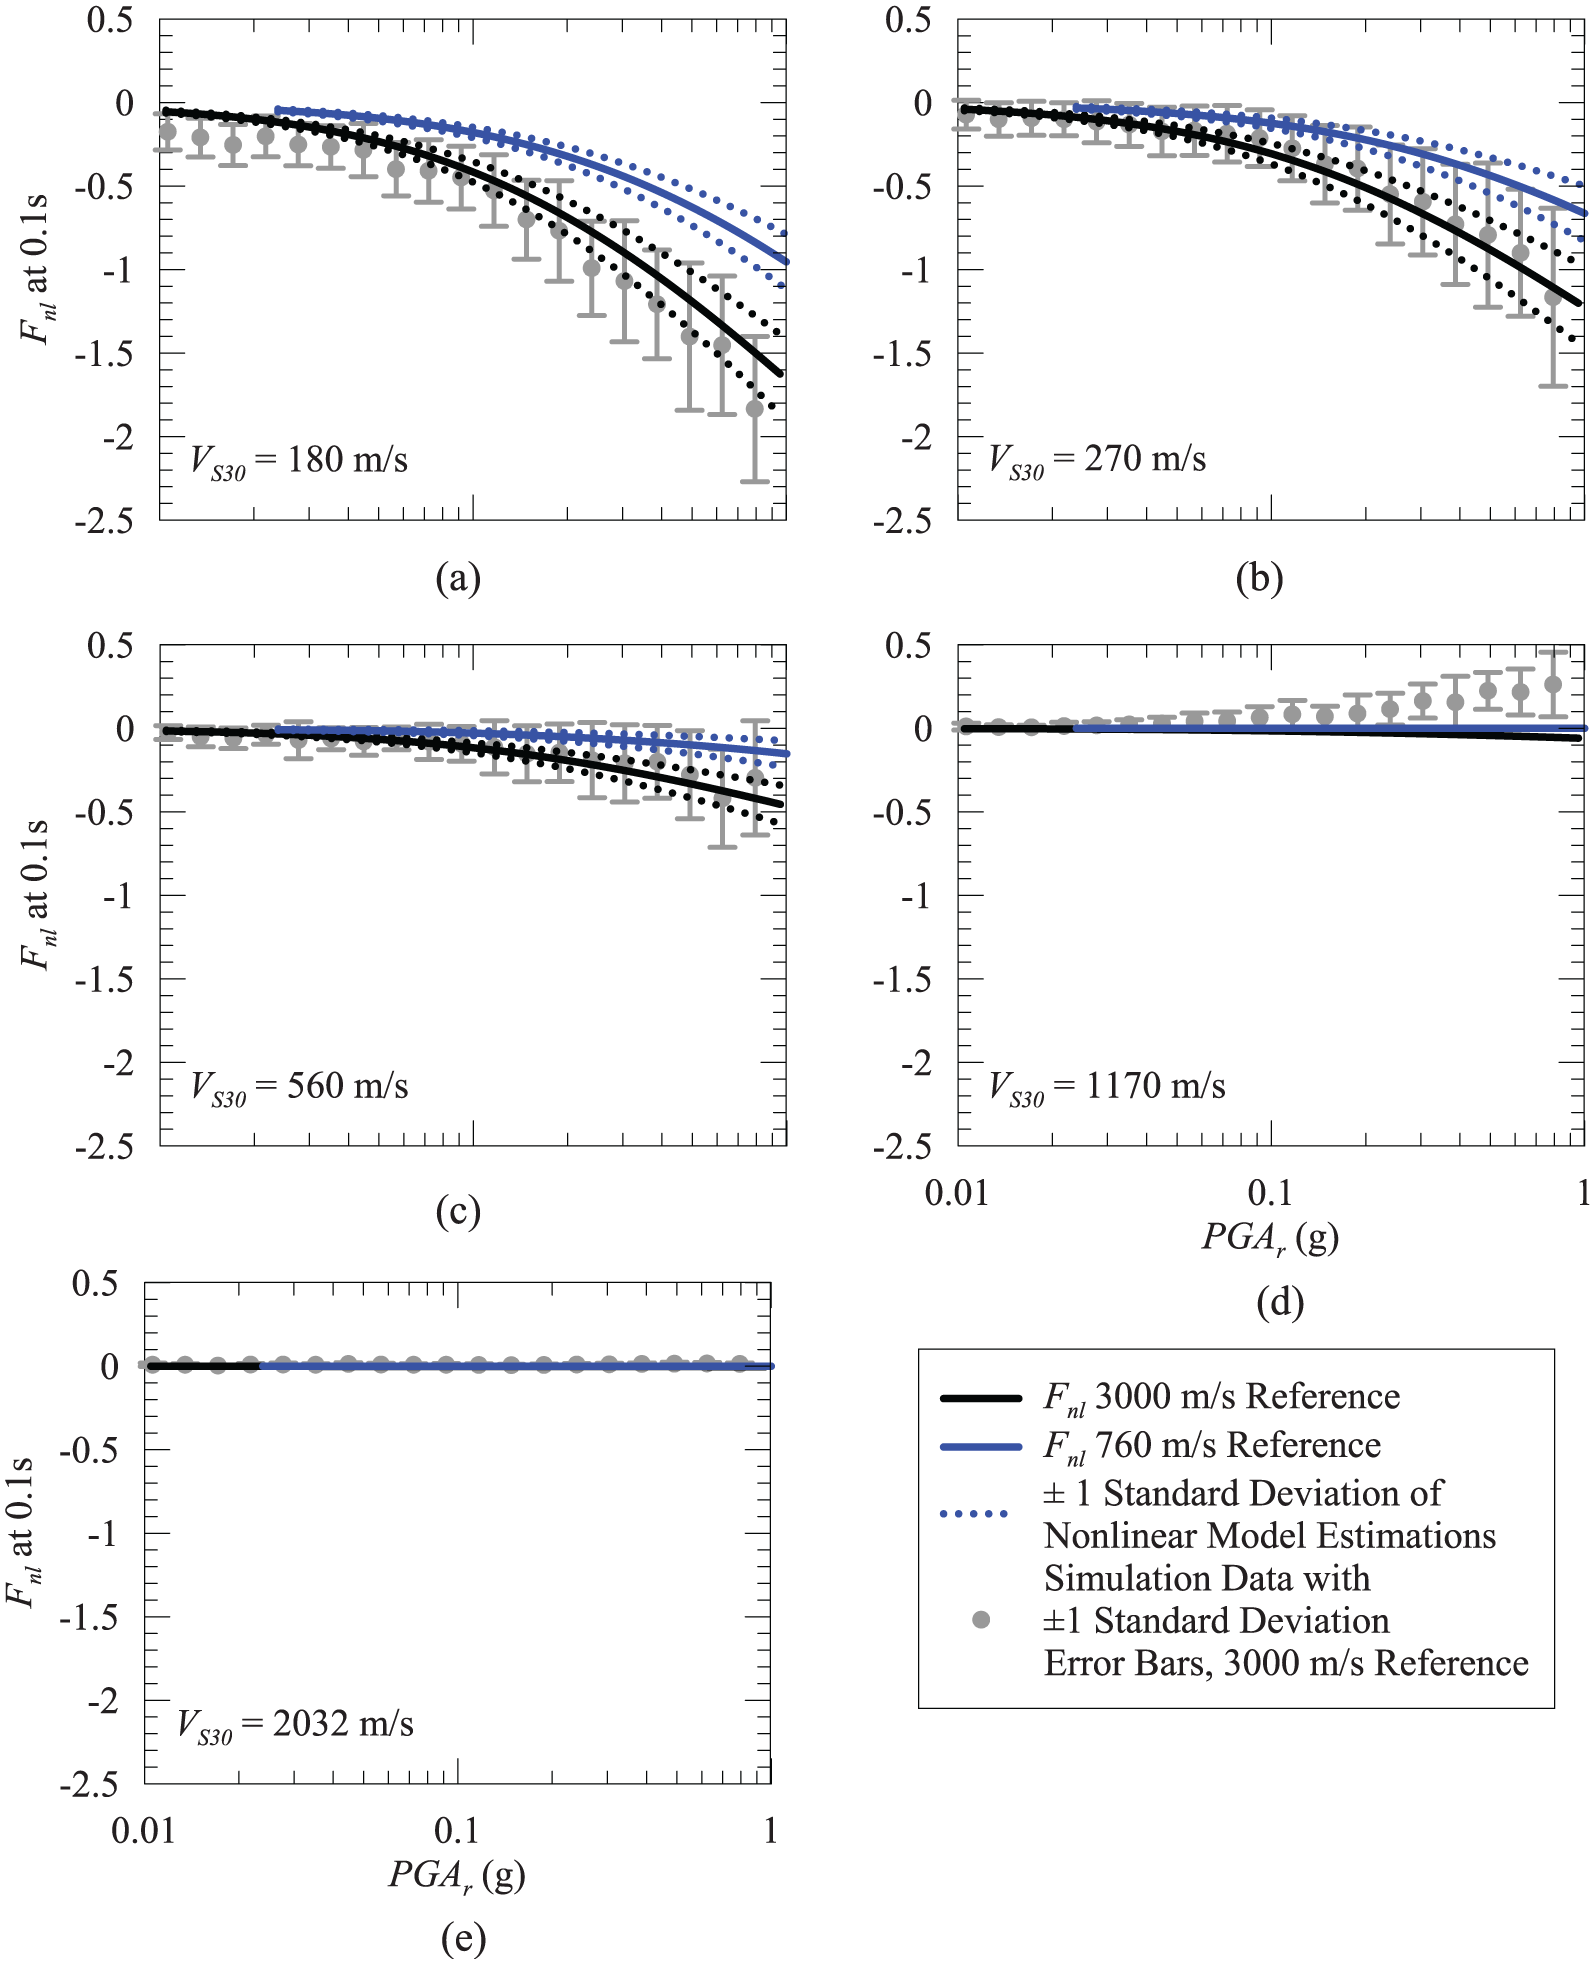
Two nonlinear amplification models relative to 3000 and 760 m/s reference conditions with ±1σ, and Harmon et al. (2019a) nonlinear amplification data binned as a function of VS30 and PGAr for (a) VS30 = 180, (b) VS30 = 270, (c) VS30 = 560, (d) VS30 = 1170, and (e) VS30 = 2032 m/s at an TOSC = 0.1 s.
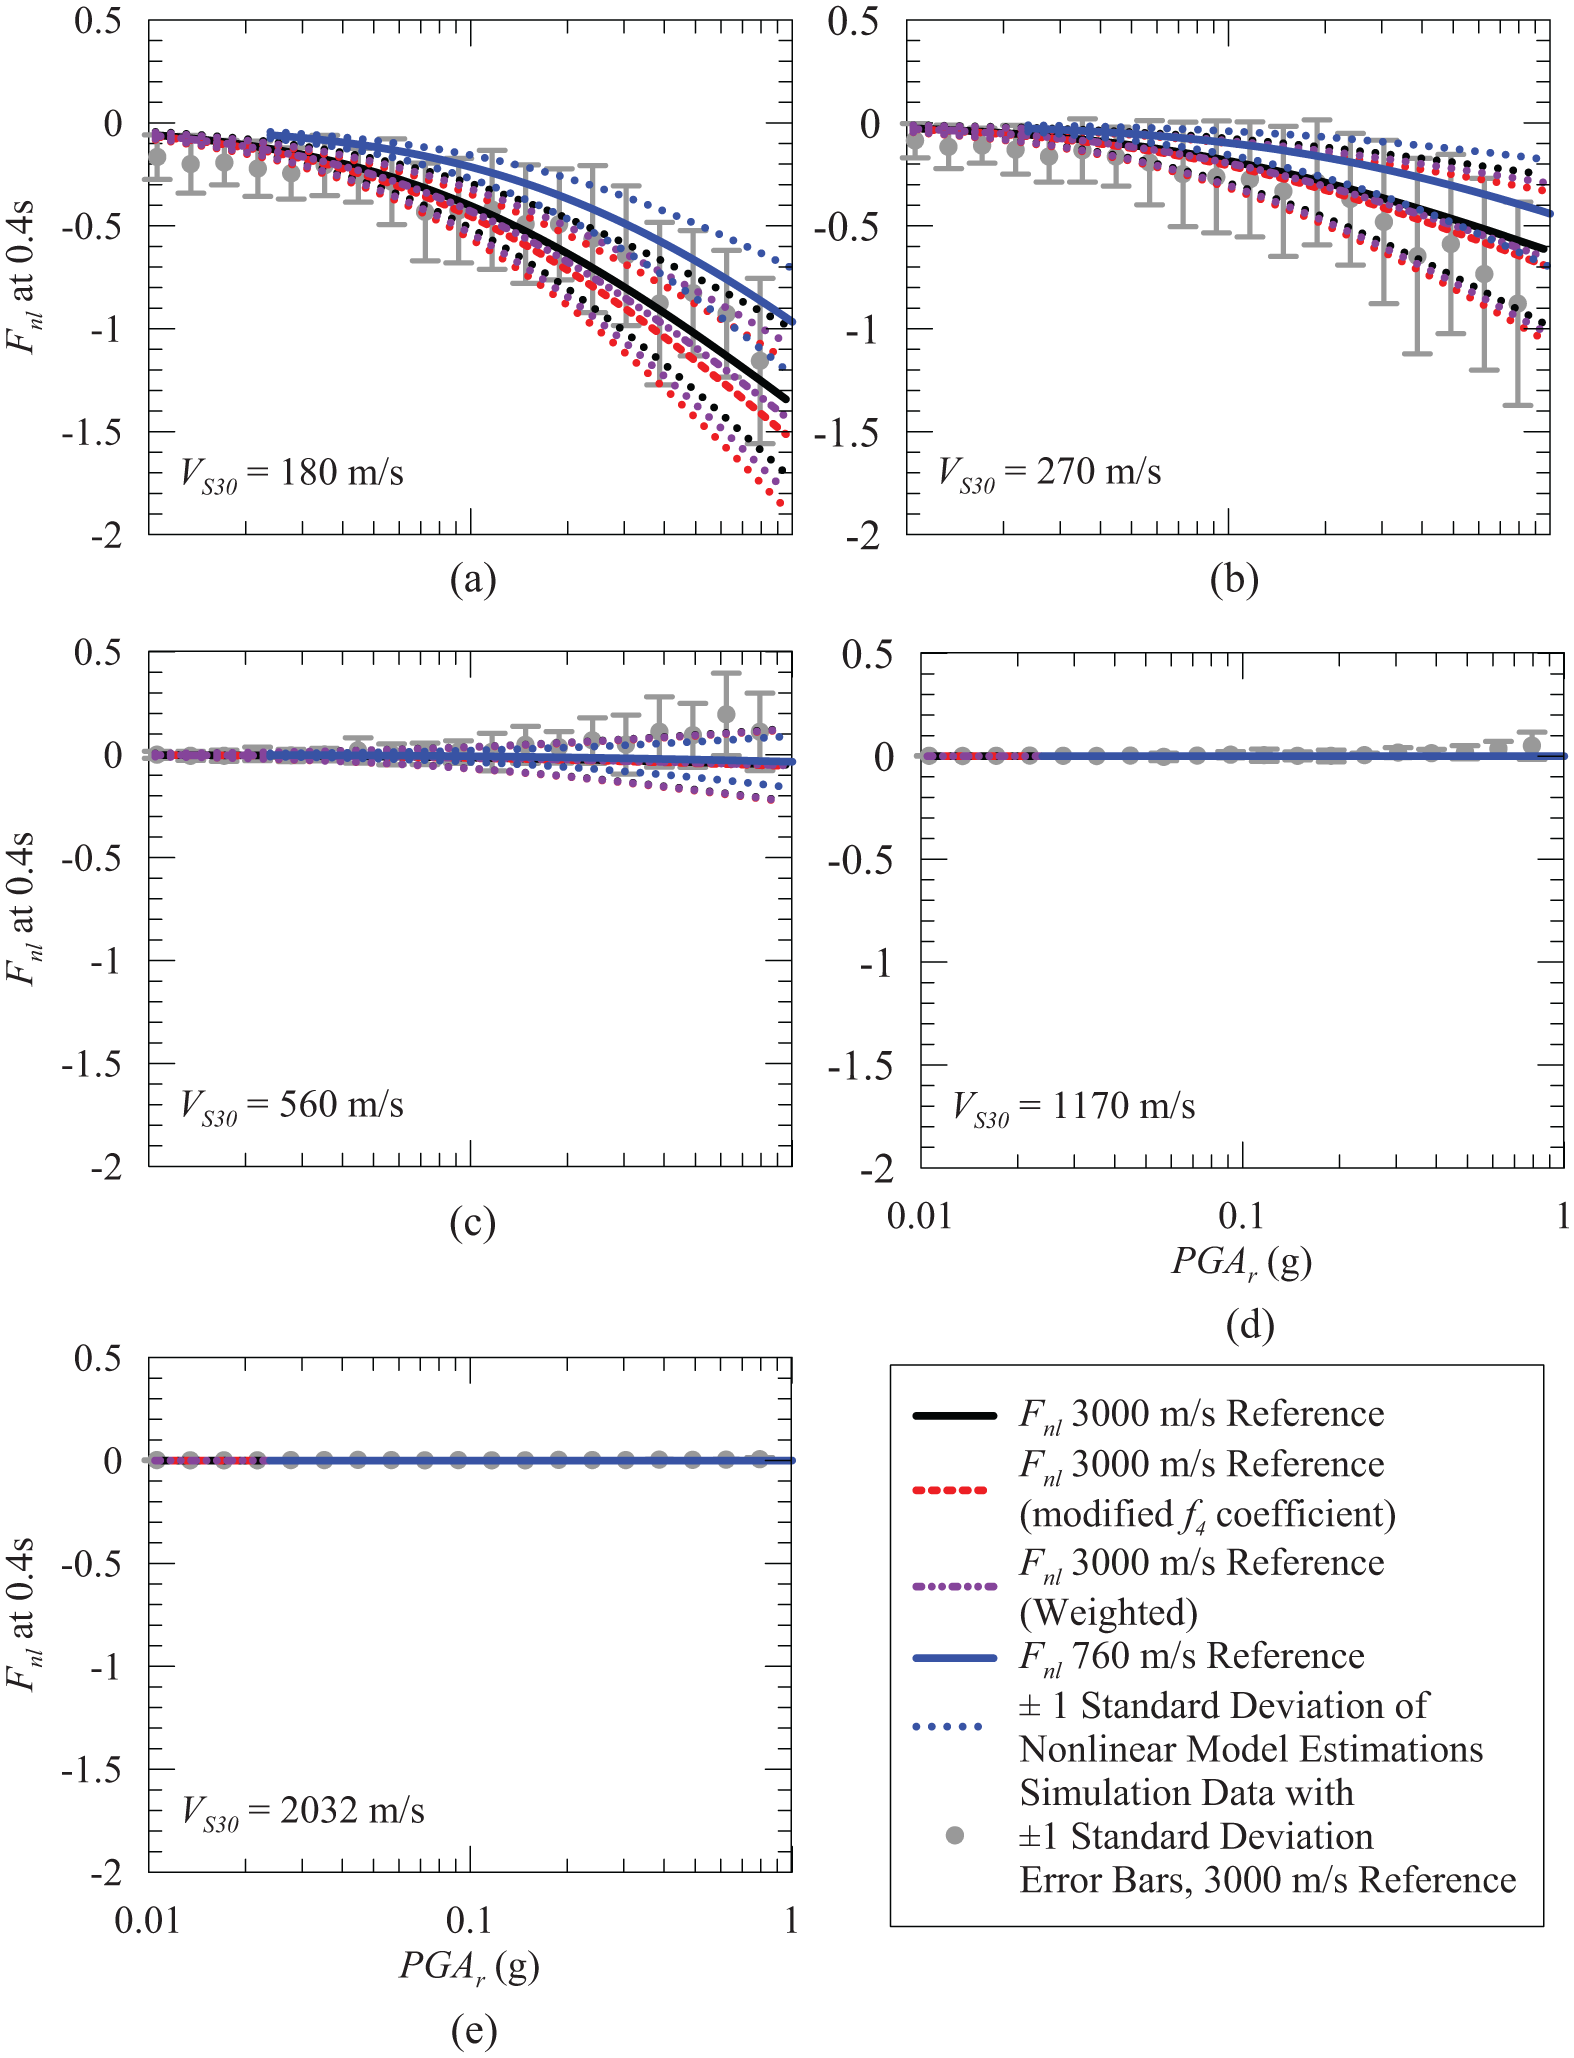
Two nonlinear amplification models relative to 3000 and 760 m/s reference conditions with original coefficient in Table 1, and a model relative to 3000 m/s with modified f4 coefficients in Table 2, and equally weighted nonlinear amplification model, respectively, with ±1σ, and Harmon et al. (2019a) nonlinear amplification data binned as a function of VS30 and PGAr for (a) VS30 = 180, (b) VS30 = 270, (c) VS30 = 560, (d) VS30 = 1170, and (e) VS30 = 2032 m/s at an TOSC = 0.4 s.
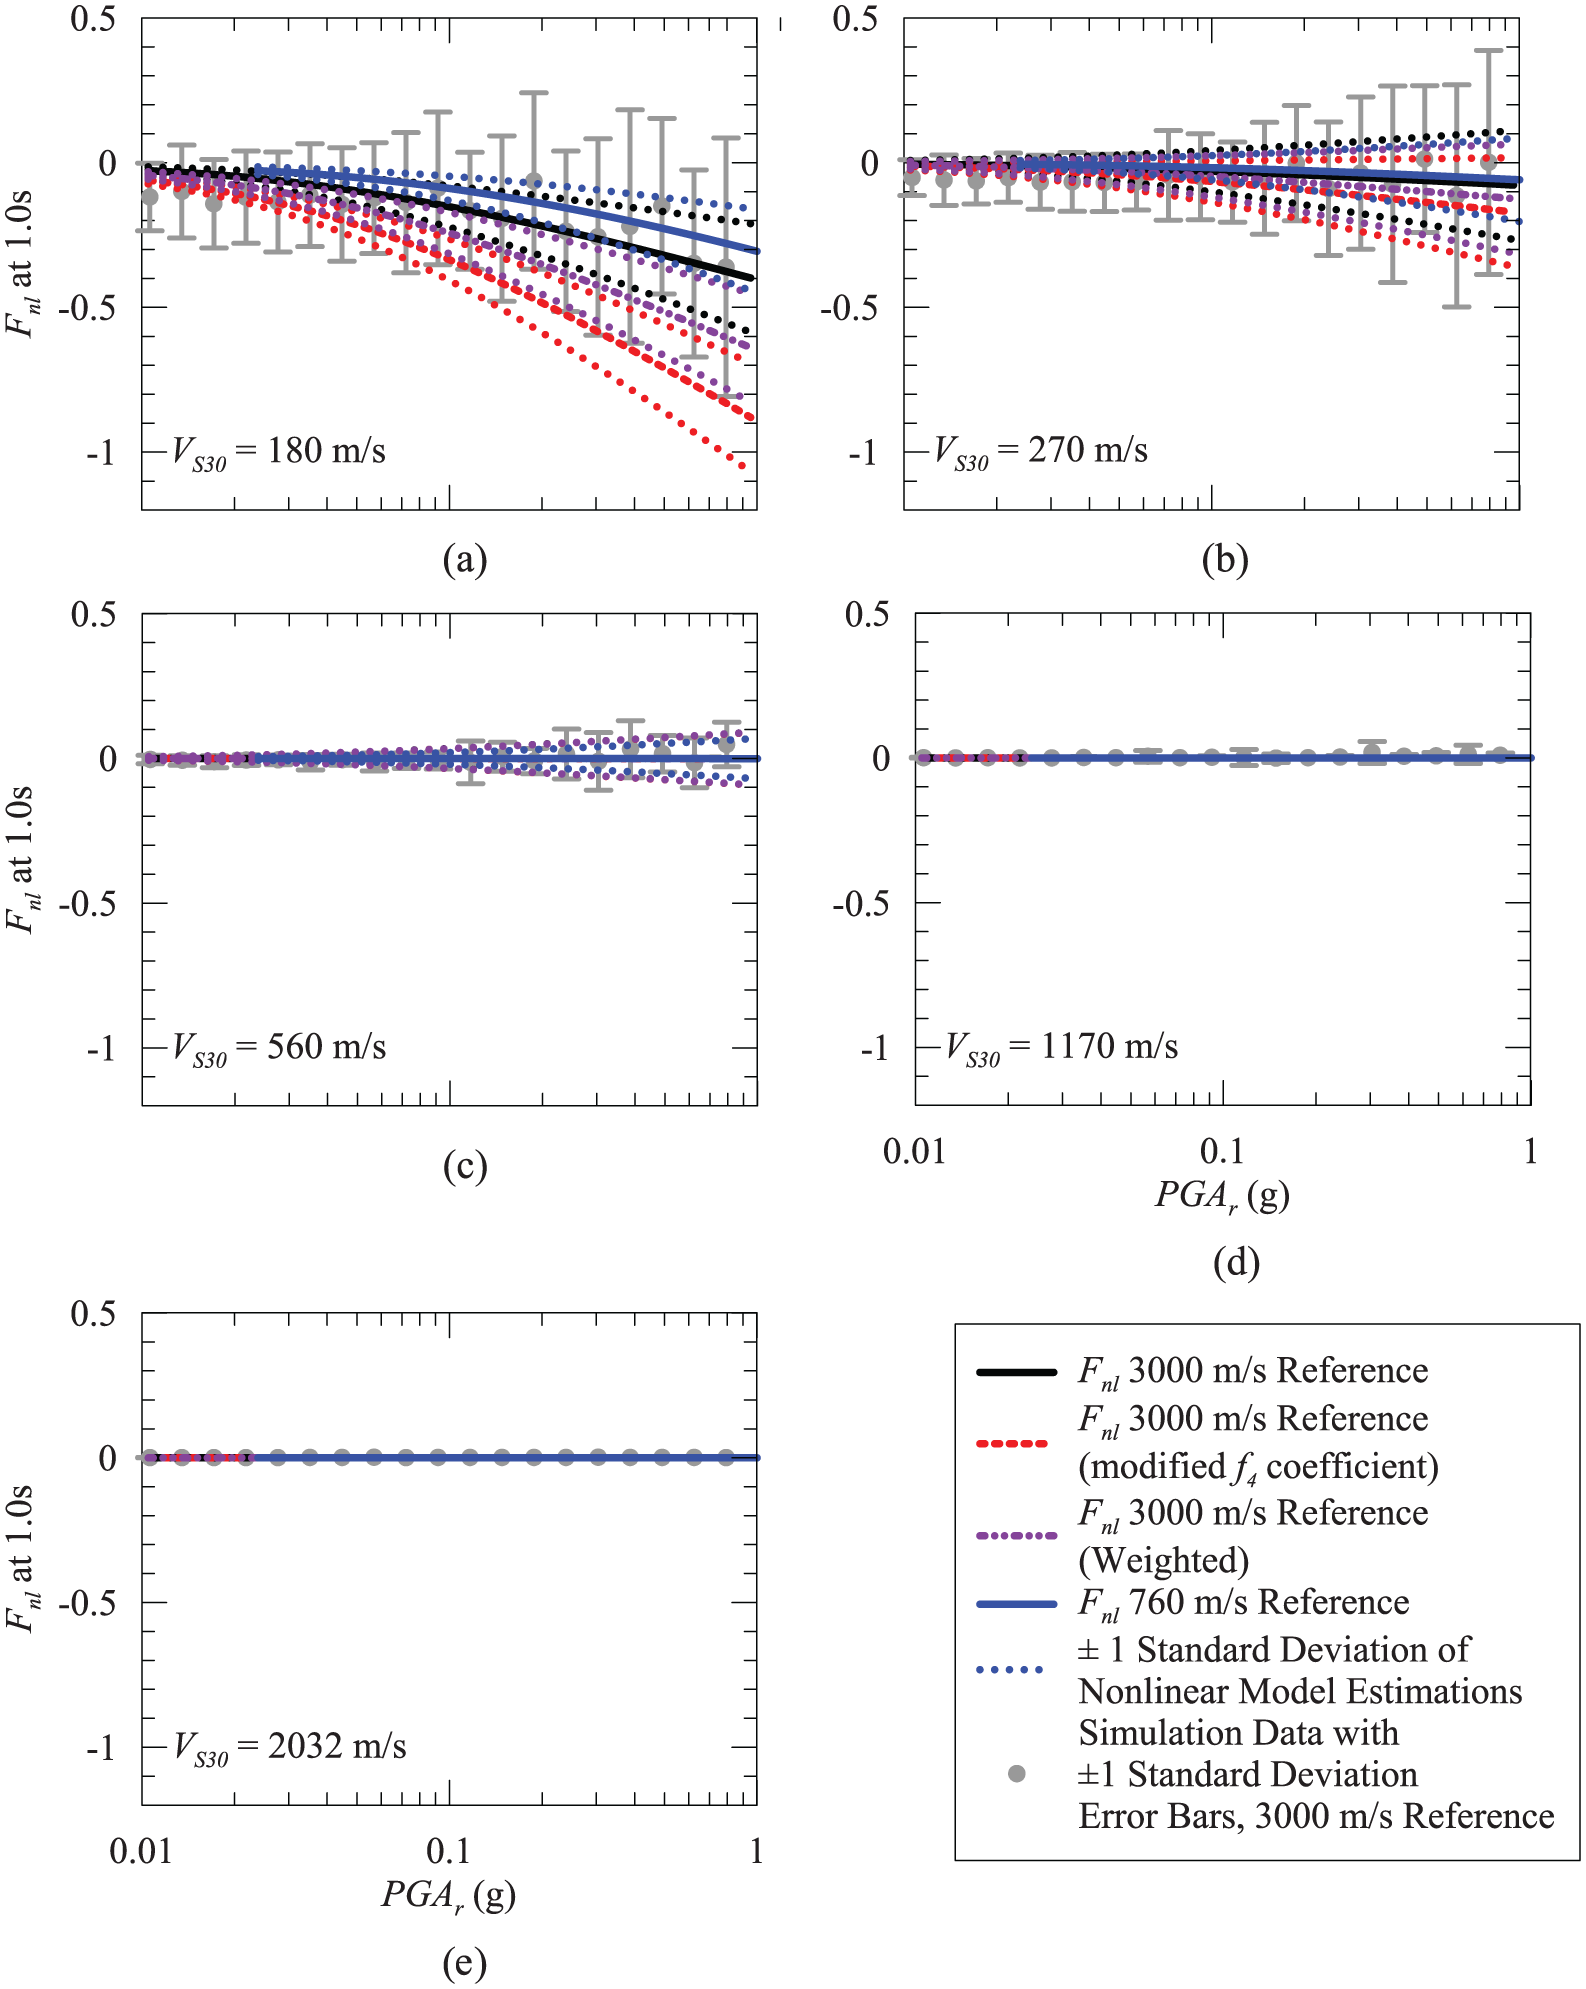
Two nonlinear amplification models relative to 3000 and 760 m/s reference conditions with original coefficients in Table 1, a model relative to 3000 m/s with modified f4 coefficients in Table 2, and equally weighted nonlinear amplification model, respectively, with ±1σ, and Harmon et al. (2019a) nonlinear amplification data binned as a function of VS30 and PGAr for (a) VS30 = 180, (b) VS30 = 270, (c) VS30 = 560, (d) VS30 = 1170, and (e) VS30 = 2032 m/s at an TOSC = 1.0 s.
The modification of original nonlinear model coefficients leads to significant deviation of model estimations from nonlinear amplification simulation data for sites of low VS30 values (<250 m/s) as illustrated in Figure 8 at long period periods (1.0 s). This difference between data and estimations results in the residual values of up to 0.50 calculated as the natural logarithm of ratio of nonlinear amplification simulation data and model estimations for VS30 ≈ 100 m/s, but reduces to ≈0.25 for sites of VS30 = 200 m/s, which is adopted as boundary for application of recommended nonlinear amplification models. For equally weighted nonlinear amplification model, the residuals stay between those of models with original and modified coefficients for very soft sites and reach almost those of model with original coefficient for sites of VS30 = 200 m/s.
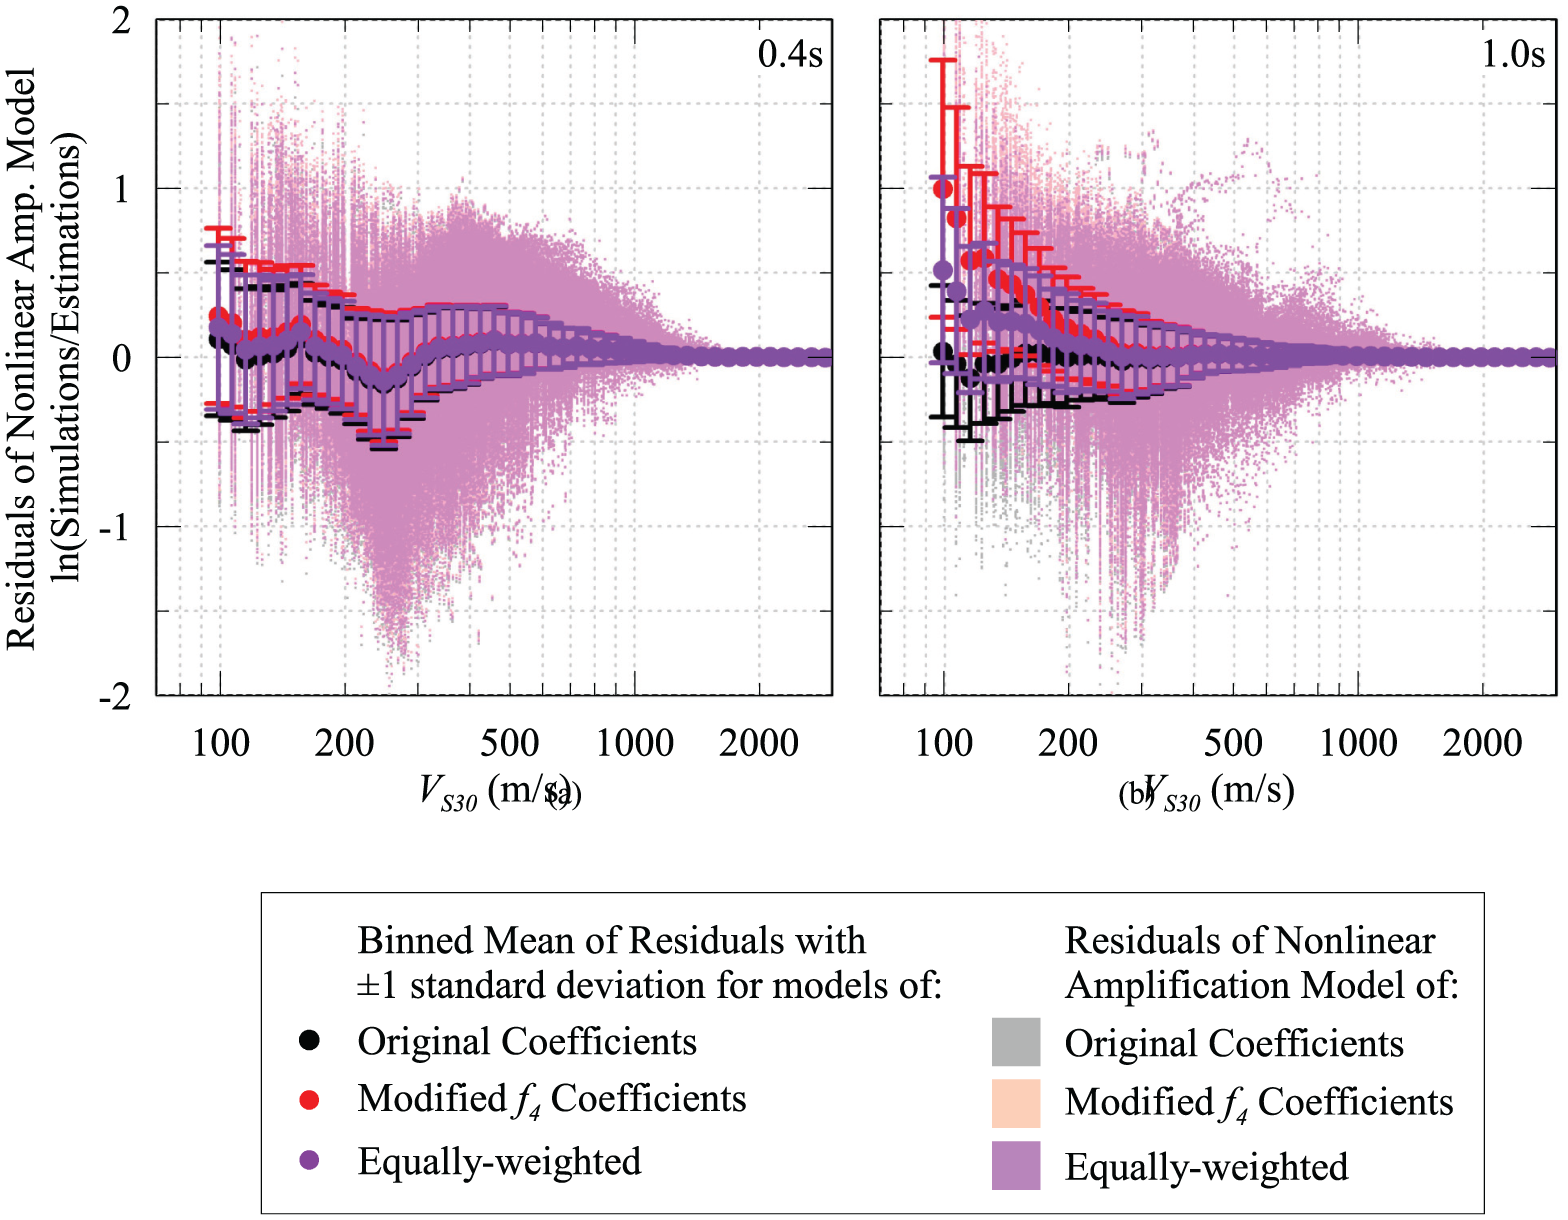
Residuals of nonlinear amplification models using original coefficients (Table 1), modified f4 coefficients (Table 2), and equally weighted model calculated as natural logarithm of the ratio of simulated nonlinear model amplification and nonlinear amplification model estimations along with the average and ±1 standard deviation of the residuals for 0.4 and 1.0 s.
Epistemic uncertainty on RS nonlinear amplification models
This study recommends the GWG-S models relative to 3000 and 760 m/s for median nonlinear site amplification. For these models, a judgment-based epistemic uncertainty model for the median nonlinear amplification is recommended by using an estimate of uncertainty in the f2 coefficient in Equation 3. The uncertainty on f2, denoted σf2, is estimated using visual inspection of nonlinear amplification to produce a reasonable variation of nonlinear amplification across the period and VS30 range of interest. As indicated by Hashash et al. (2017), the uncertainty model is recommended for both GWG-S models relative to 3000 and 760 m/s.
The uncertainty on f2, σf2, is designed as a piecewise functional form given in Equation 5, which has the following characteristics (Figure 9):
σf2 is assumed to be constant for VS30 < 300 m/s
σf2 decreases linearly in log-space for 300 m/s ≤ VS30 < 1000 m/s
σf2 is set to zero at VS30 > 1000 m/s
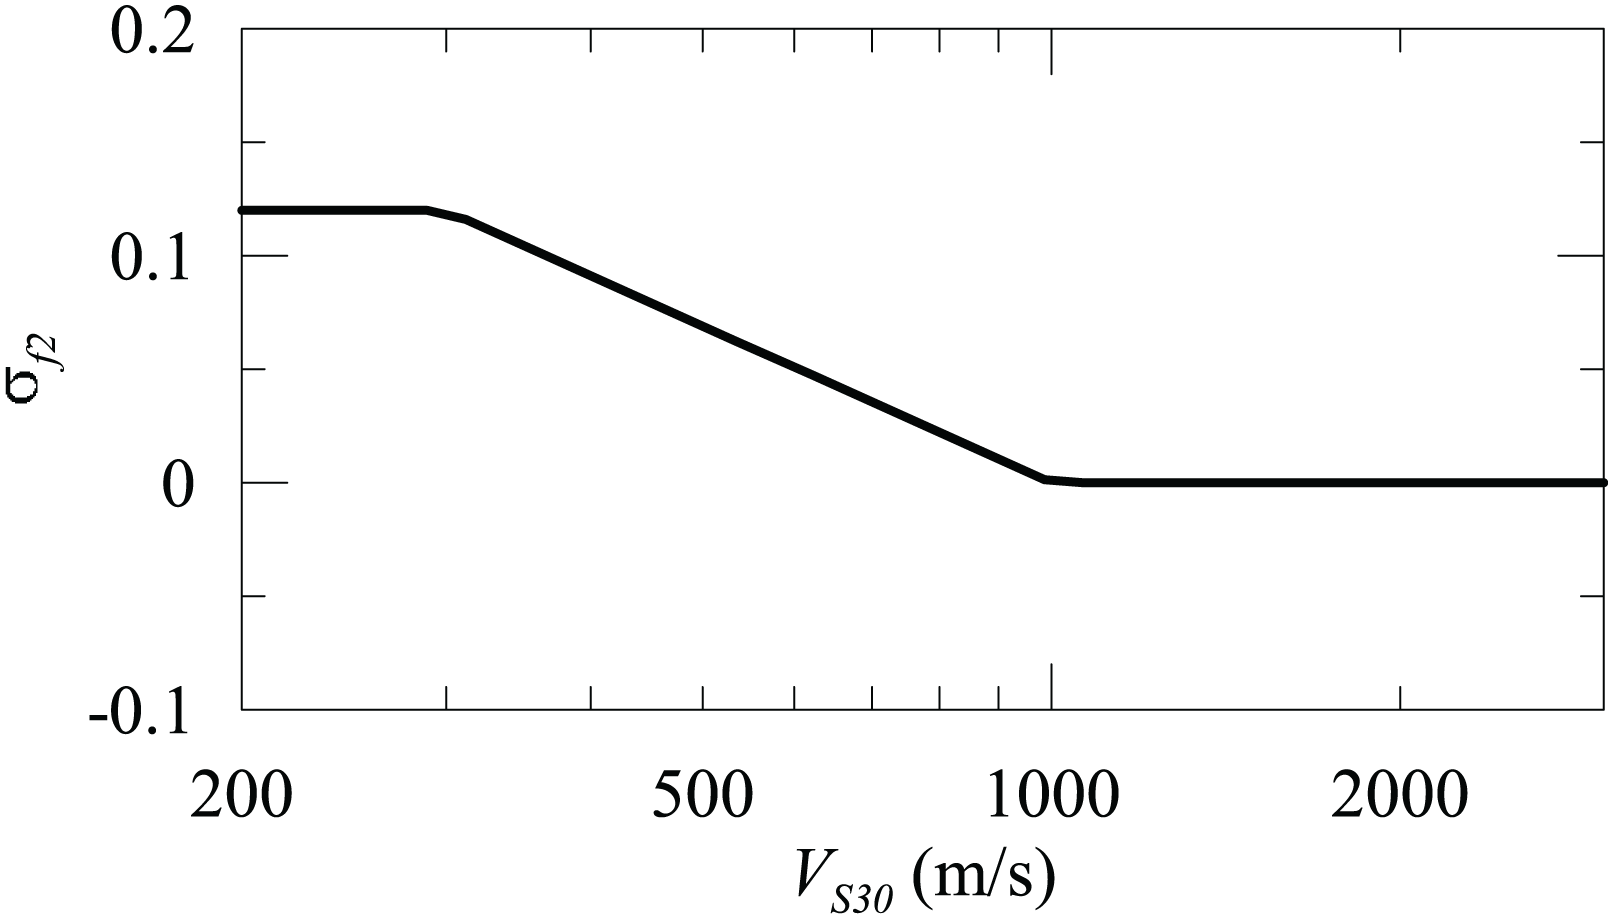
Epistemic uncertainty (σf2) on f2 coefficients with respect to VS30 at oscillator period value of 0.1 s.
The uncertainty model is described by a single parameter, which is called as σc and is given for 39 oscillator periods between 0.001 and 10.0 s along with PGV in Table 1. The σc parameter is interpolated inside the period range in Hashash et al. (2017) and extrapolated outside of that range.
Application of the epistemic uncertainty model to the recommended nonlinear amplification model is presented in Figures 5 to 7. As noted in Hashash et al. (2017), the uncertainty range from the epistemic uncertainty model typically lies within the range of the binned Harmon et al. (2019a) simulation data with ±1 standard deviation, suggesting that the range of model uncertainty is appropriate.
Summary of recommended nonlinear amplification models and limitations
Nonlinear site amplification models are presented for application in CENA. The model suggested here is a subset of the alternate nonlinear models provided in Harmon et al. (2019b) and has been updated in several respects relative to an earlier version given in Hashash et al. (2017). The main differences between the proposed model and the full models in Harmon et al. (2019b) are as follows:
A specific version of the Harmon et al. (2019b) models is selected as one alternative median model (model N2). This model results in a noticeable increase in computed surface response at intermediate periods that reflects site amplification. However, the model estimates have zero bias relative to simulation data and therefore considered most representative of the simulated site amplification data.
A modified version of the median model is provided not to allow a peak in the response spectra at about 1.0 s period for strong shaking conditions and soft soil sites. These model estimates have significant bias relative to simulated site amplification data.
A model that equally weighs these two models results in less bias relative to simulated data compared to the modified nonlinear model. This model results in less increase in the spectrum at intermediate periods while limiting the model errors.
All these models have been adapted to apply for additional periods beyond those considered in Harmon et al. (2019b).
Procedures are provided to adjust the nonlinear amplification models to a VS30 = 760 m/s reference condition by modifying PGAr (originally proposed in Hashash et al., 2017).
An epistemic uncertainty model is provided.
As two median models are provided, users can select one or elect to combine with some weighting. The choice of which model to use is left to the user.
Limitations of recommended median nonlinear amplification are associated with limitations of 1-D site response analyses, which include (1) the absence of multi-dimensional wave propagation effects that can be pronounced in sedimentary basins and (2) the inability to compute deep site response at longer periods, leading to bias in ground response estimations (e.g. Baturay and Stewart, 2003). There may be additional epistemic uncertainties when high shear strains occur within the soil profile during the analysis because of the approximate means by which shear strength was estimated for use in these simulations (Harmon et al., 2019a).
Further model limitations come from the applicable ranges of ground motion intensity (PGAr), VS30, and shear strain index Iy = PGVr/VS30 as given in Harmon et al. (2019b), where PGVr is peak ground velocity at rock outcrop. Recommended models are applicable for PGAr < 1.0 g, and sites with 200 ≤ VS30 ≤ 2000 m/s, where the limiting minimum VS30 is similar to the boundary of VS30 = 180 m/s between NEHRP (Building Seismic Safety Commission (BSSC), 2015) site classes D and E, and the maximum limiting VS30 is proposed for consistency with the recommended linear model in Stewart et al. (in press). The maximum applicable value of Iy is reported as 0.1% < Iy < 0.2% in Harmon et al. (2019b). A site-specific analysis is recommended for sites and ground motion conditions outside the ranges considered.
Footnotes
Declaration of conflicting interests
The author(s) declared no potential conflicts of interest with respect to the research, authorship, and/or publication of this article.
Funding
The author(s) received financial support for the research, authorship, and/ or publication of this article: This study was partially supported by PEER as part of NGA-East, a project funded by the U.S. Nuclear Regulatory Commission, the U.S. Department of Energy, and the Electric Power Research Institute with the participation of the USGS, and also supported by the USGS under Grant Numbers G14AP00102, G14AP00103, G14AP00104, G16AP00005, and Republic of Turkey Ministry of National Education.