
Abstract
We present a database documenting the seismic response of seven instrumented flood control levee segments in Japan. The database includes (1) maps and cross-sections showing levee geometry and instrument layouts; (2) ground motion time series, and (where available) piezometric recordings; (3) reported field performance from post-earthquake reconnaissance (i.e. permanent displacements, other evidence of ground failure); and (4) geotechnical data, including geologic cross-sections, stratigraphy, penetration resistance, and shear wave velocity (VS) profiles. The data are complete with respect to these attributes for three sites, with geotechnical data and field performance data missing for two and four sites, respectively. The database contains 150 recordings from 25 events and can be accessed through DOI: 10.21222/C2TC95. Ground motions were processed using standard procedures for Next Generation Attenuation projects. We present example data for a segment damaged by the
Introduction
Levees and other flood control systems are important infrastructure with a critical role in post-earthquake community resilience. As such, it is important to undertake research that promotes understanding of site response and ground failure within levee materials and their foundation soils, so as to improve the reliability of levee risk assessment methodologies. As with other types of infrastructure (buildings, bridges, dams, etc.), data from in situ field instrumentation can play a critical role in such research, especially when combined with observations from detailed post-earthquake reconnaissance. In this article, we describe the first such data set (to our knowledge) to have been compiled.
The Ministry of Land, Infrastructure, Transport and Tourism (MLIT) in Japan has administrated a national network of instrumented infrastructure, with the National Institute for Land and Infrastructure Management (NILIM) managing the seismic network. The network of instrumented levees consisted, as of 2013, of 56 sites at various locations in Japan (Figure 1). The levels of instrumentation at the sites vary, but the most heavily instrumented sites include triaxial accelerometers at the surface (crest and landside toe) and downhole as well as pore pressure transducers. When an earthquake is recorded at a levee site, the data are recovered by NILIM technicians in the field either shortly after the event or during routine monthly visits. For major earthquake events, some of the ground motion data are published on the NILIM website (http://www.nilim.go.jp/lab/rdg/index.htm), but much of these data have not been systematically compiled, processed, and disseminated. Prior to the work described herein, no inventory of seismic events recorded at the 56 sites in the network had been made publicly available. We analyze events recorded since 2004 by the MLIT levee arrays, process the subset of these data secured through a prioritization process, and compile an open-access database documenting instrumental data and accompanying field performance for seven high-priority levee arrays.
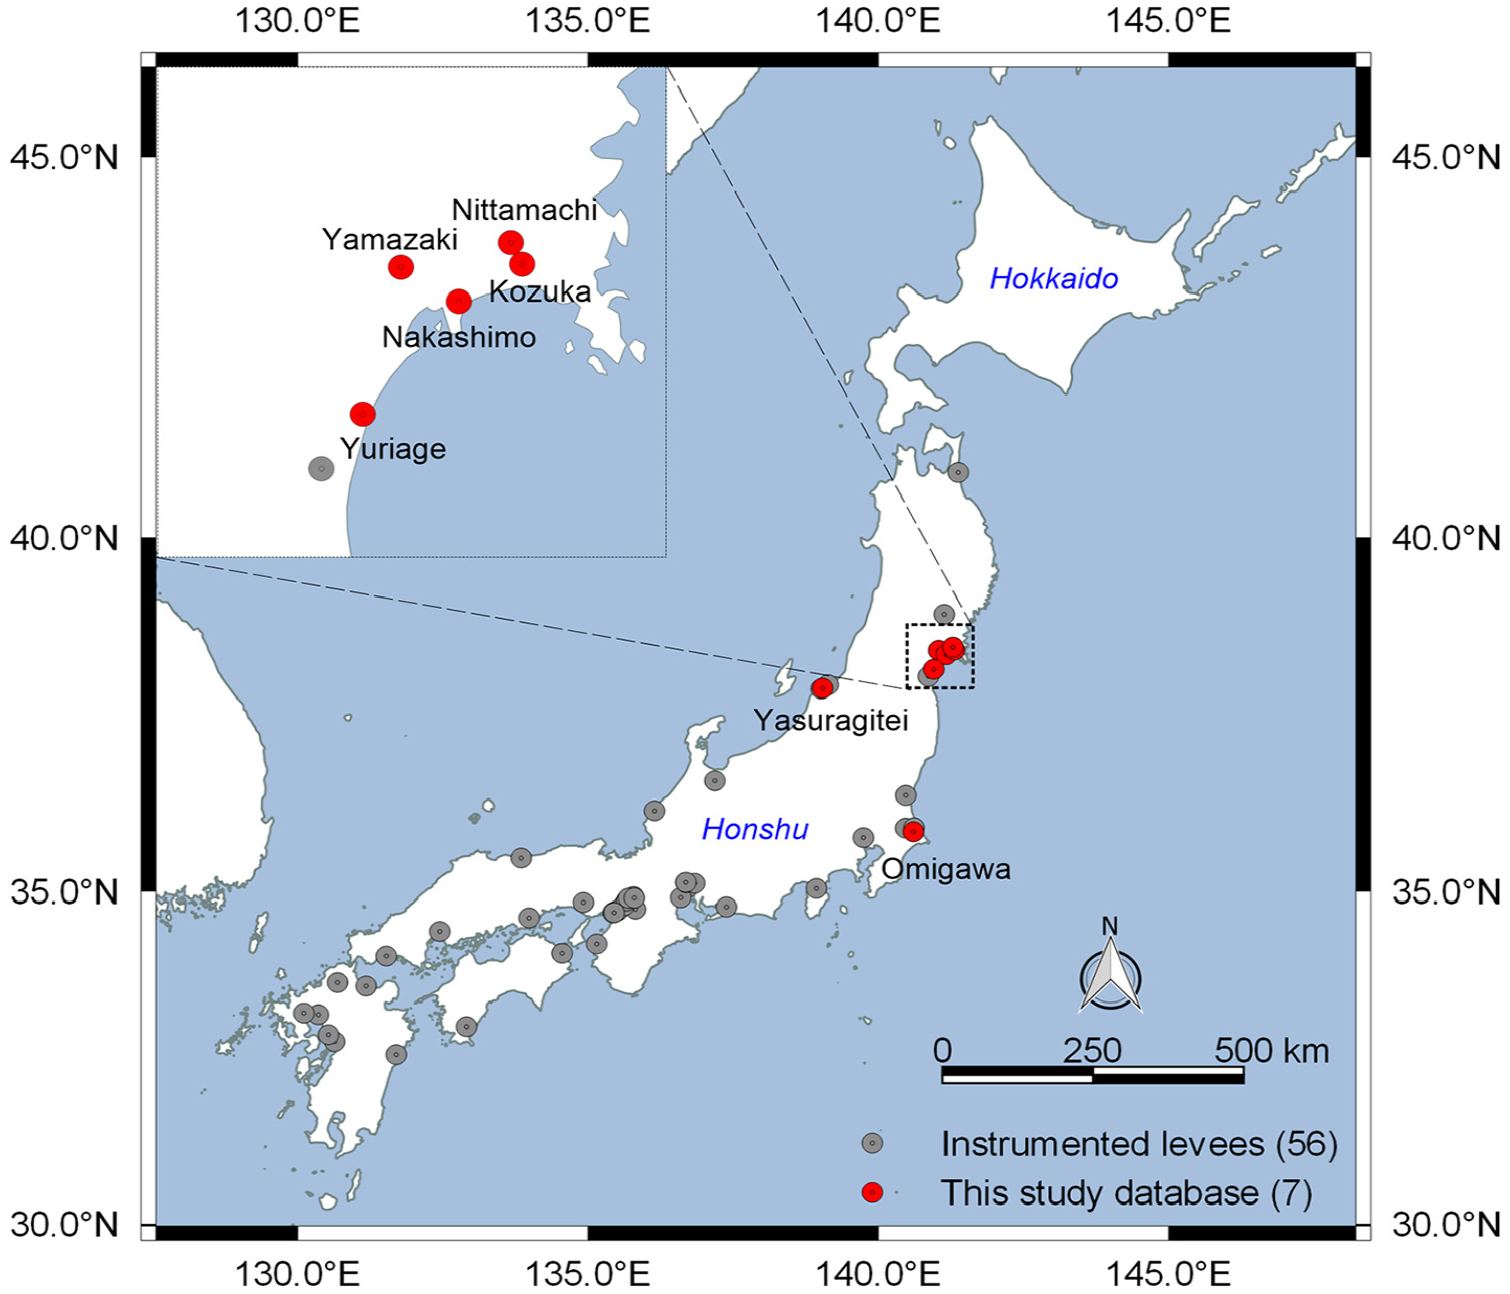
Map view of the network of instrumented levees in Japan (as of 2013).
Subsequent sections of this article describe the MLIT levee arrays and the procedures used to identify high-priority sites for data retrieval, typical instrumentation layouts, data organization, and plots of data for an example site. The database is archived at http://www.nilim.go.jp/lab/rdg/db/db01.htm (Kataoka et al., 2019). The data can be downloaded as one 119-MB zip file from that site.
MLIT levee arrays and site selection
As shown in Figure 1, the instrumented levee arrays administrated by MLIT in Japan are deployed throughout most of the country, with the exception of Hokkaido. Much of the data are locally stored in MLIT field offices on tapes and disks and have not been compiled. For this reason, complete documentation of all recorded data was not considered practical by the cognizant MLIT staff (including the seventh author). Accordingly, we prioritized sites and events of greatest engineering interest, based on the criteria that (1) the site was likely to have experienced at least one event with strong shaking and (2) the site also experienced events expected to produce relatively weak ground motions useful for analysis of essentially linear site response.
Our prioritization procedure used modified Mercalli intensity maps (ShakeMaps) produced by U.S. Geological Survey (USGS; http://earthquake.usgs.gov/earthquakes/map; Wald et al., 2005; Worden and Wald, 2016), which are based on instrumental ground motion recordings. As an example, Figure 2 shows the ShakeMap for the
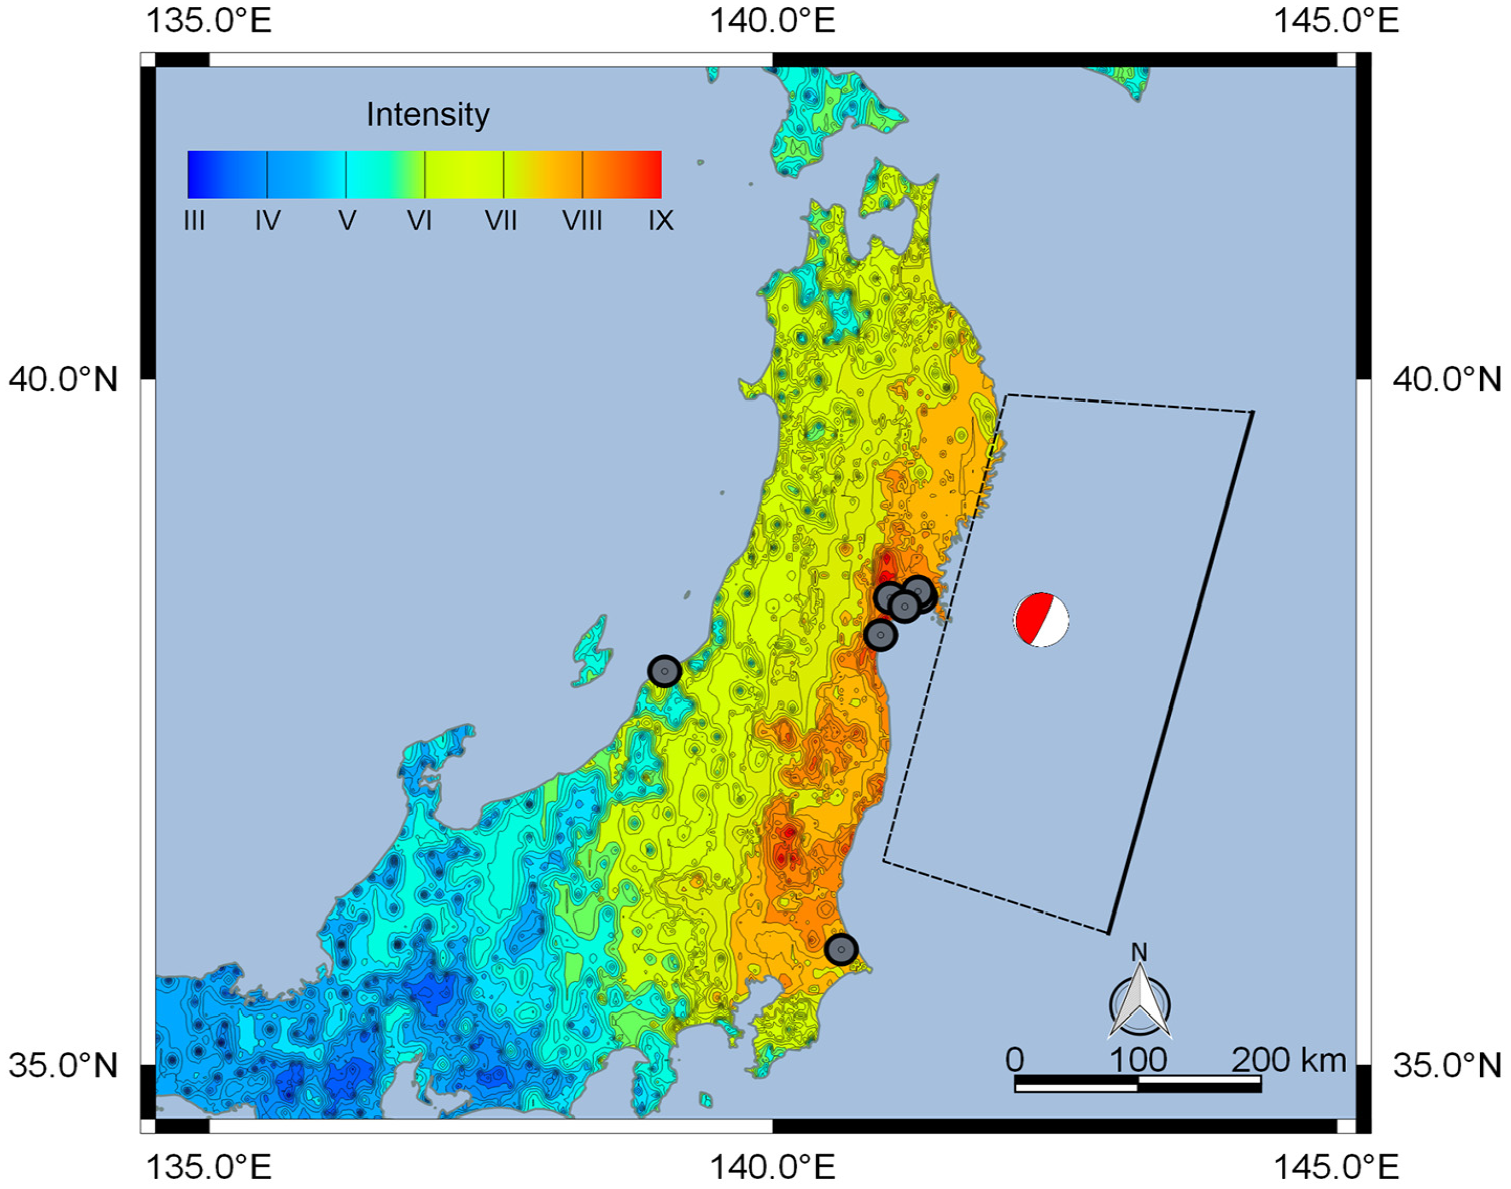
USGS ShakeMap for the
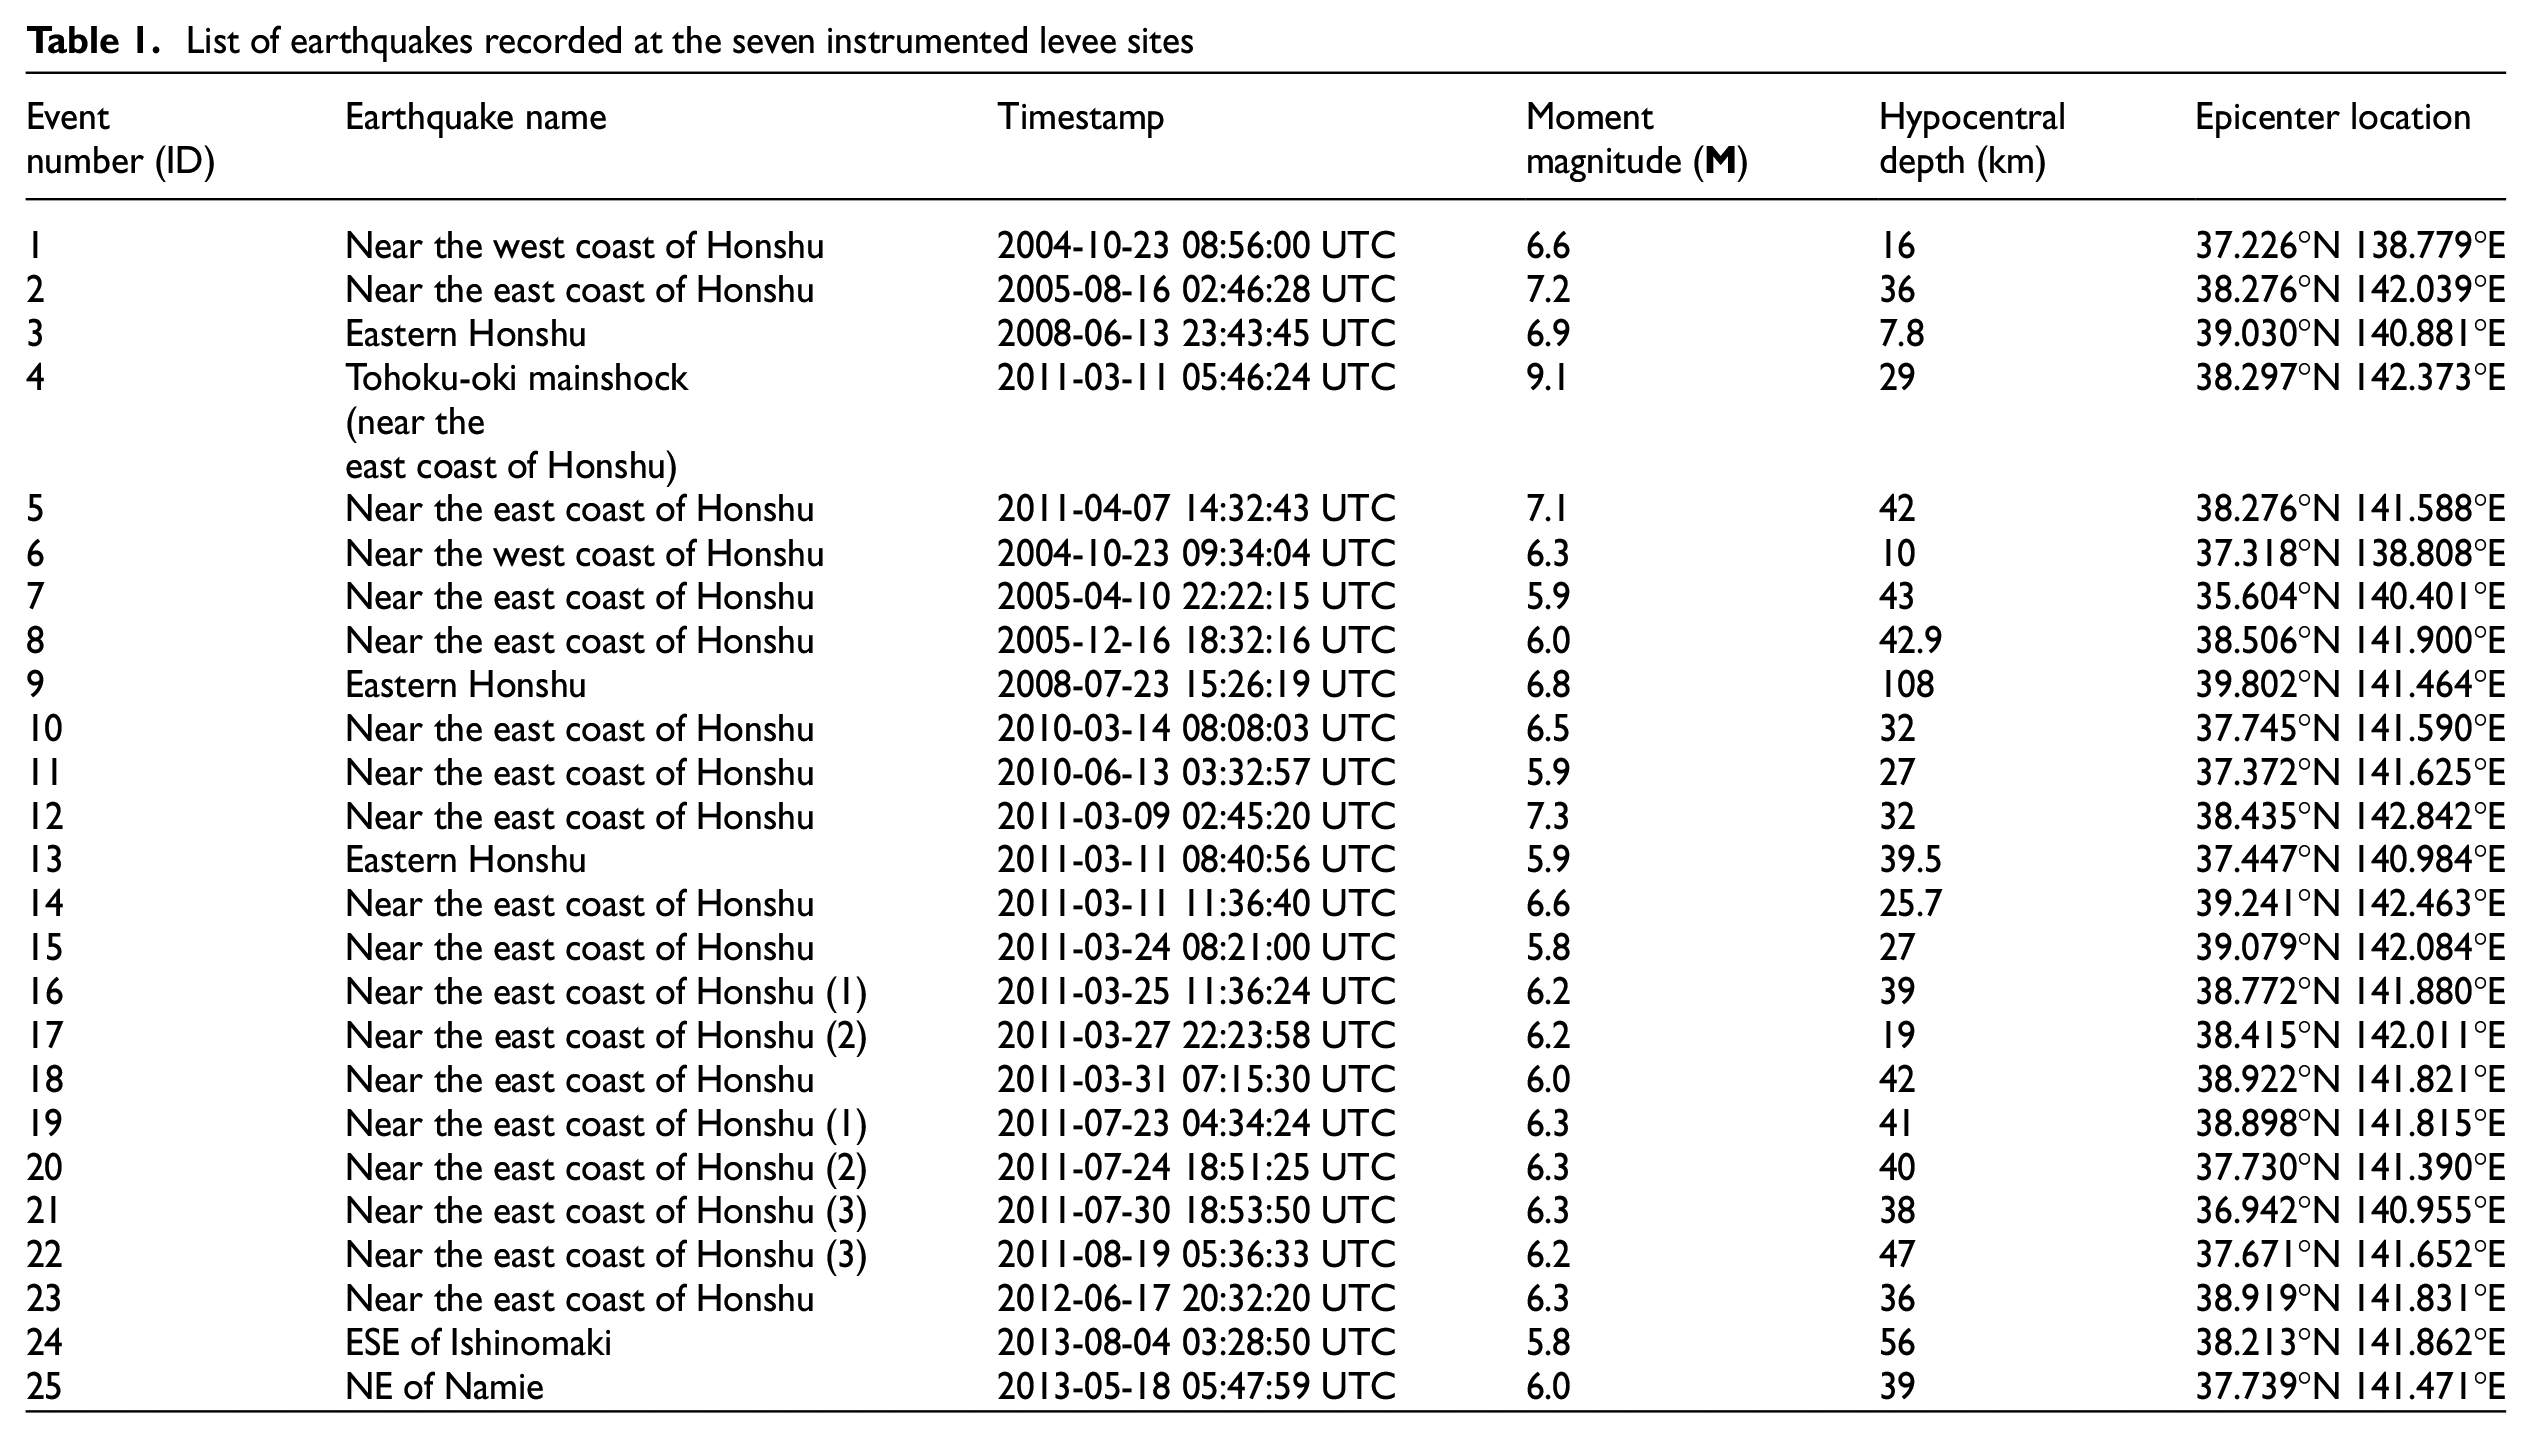
List of earthquakes recorded at the seven instrumented levee sites
List of the seven instrumented levee sites for which ground motion data are available
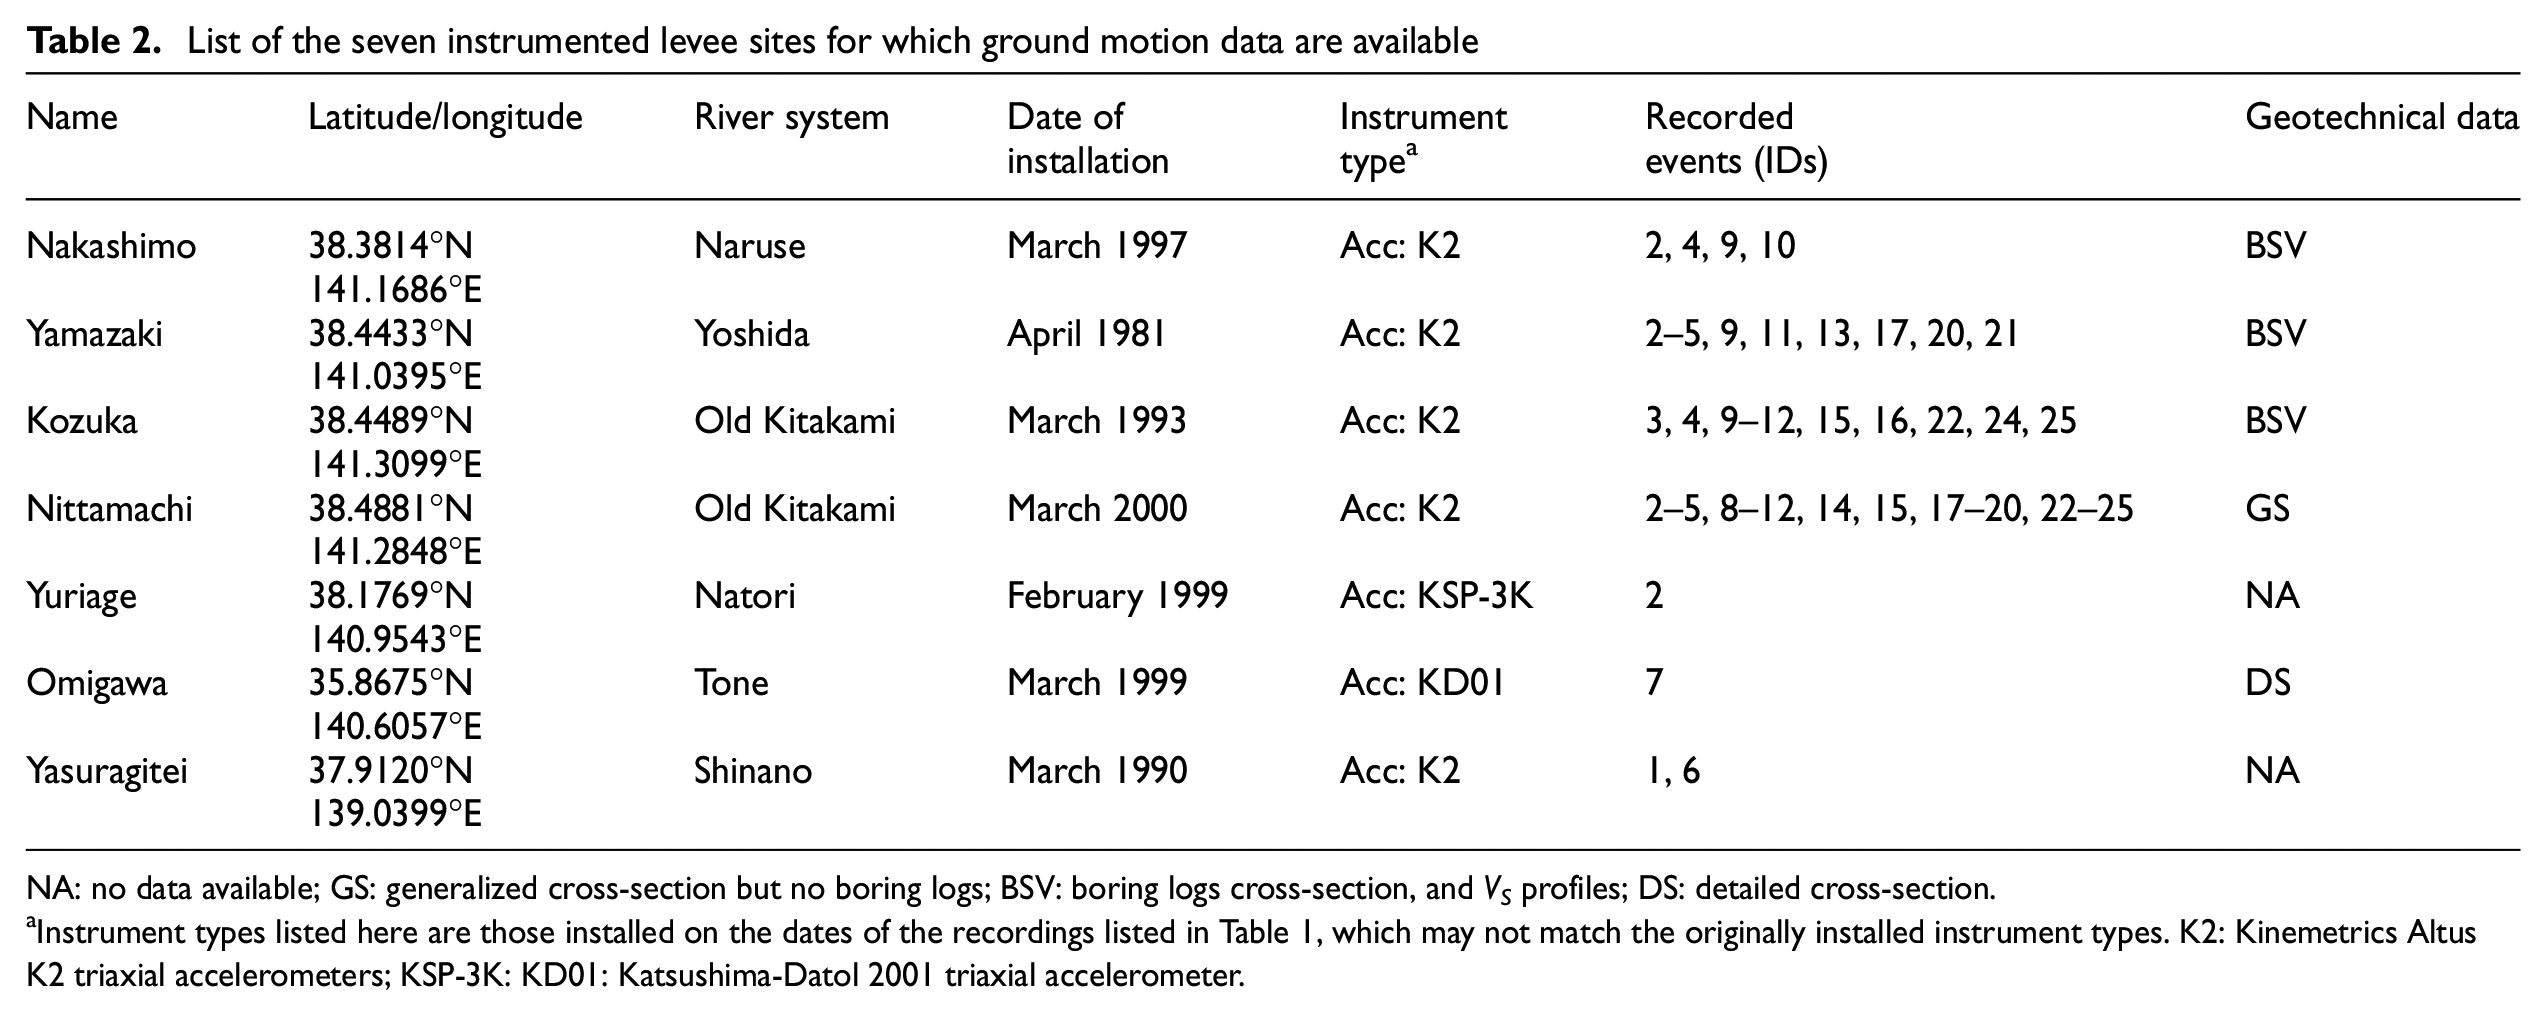
NA: no data available; GS: generalized cross-section but no boring logs; BSV: boring logs cross-section, and VS profiles; DS: detailed cross-section.
Instrument types listed here are those installed on the dates of the recordings listed in Table 1, which may not match the originally installed instrument types. K2: Kinemetrics Altus K2 triaxial accelerometers; KSP-3K: KD01: Katsushima-Datol 2001 triaxial accelerometer.
Instrumentation and site configurations
All seven levee sites in the database are instrumented with multiple accelerometers. The levee site Nakashimo is also instrumented with a pore pressure transducer. The database provides the position of accelerometers and pore water pressure sensors, and the orientations of acceleration recordings (vertical, and azimuths for horizontal). For three levee sites (Nakashimo, Kozuka, and Yamazaki), detailed cross-sections showing the position of all sensors are available in the database (in the Levee_Profiles_and_cross_sections directory). Table 2 lists sensor types for each site, while Table 3 lists sensor identification numbers, locations, and the number of recorded earthquake events.
Instrumentation configuration for each levee site
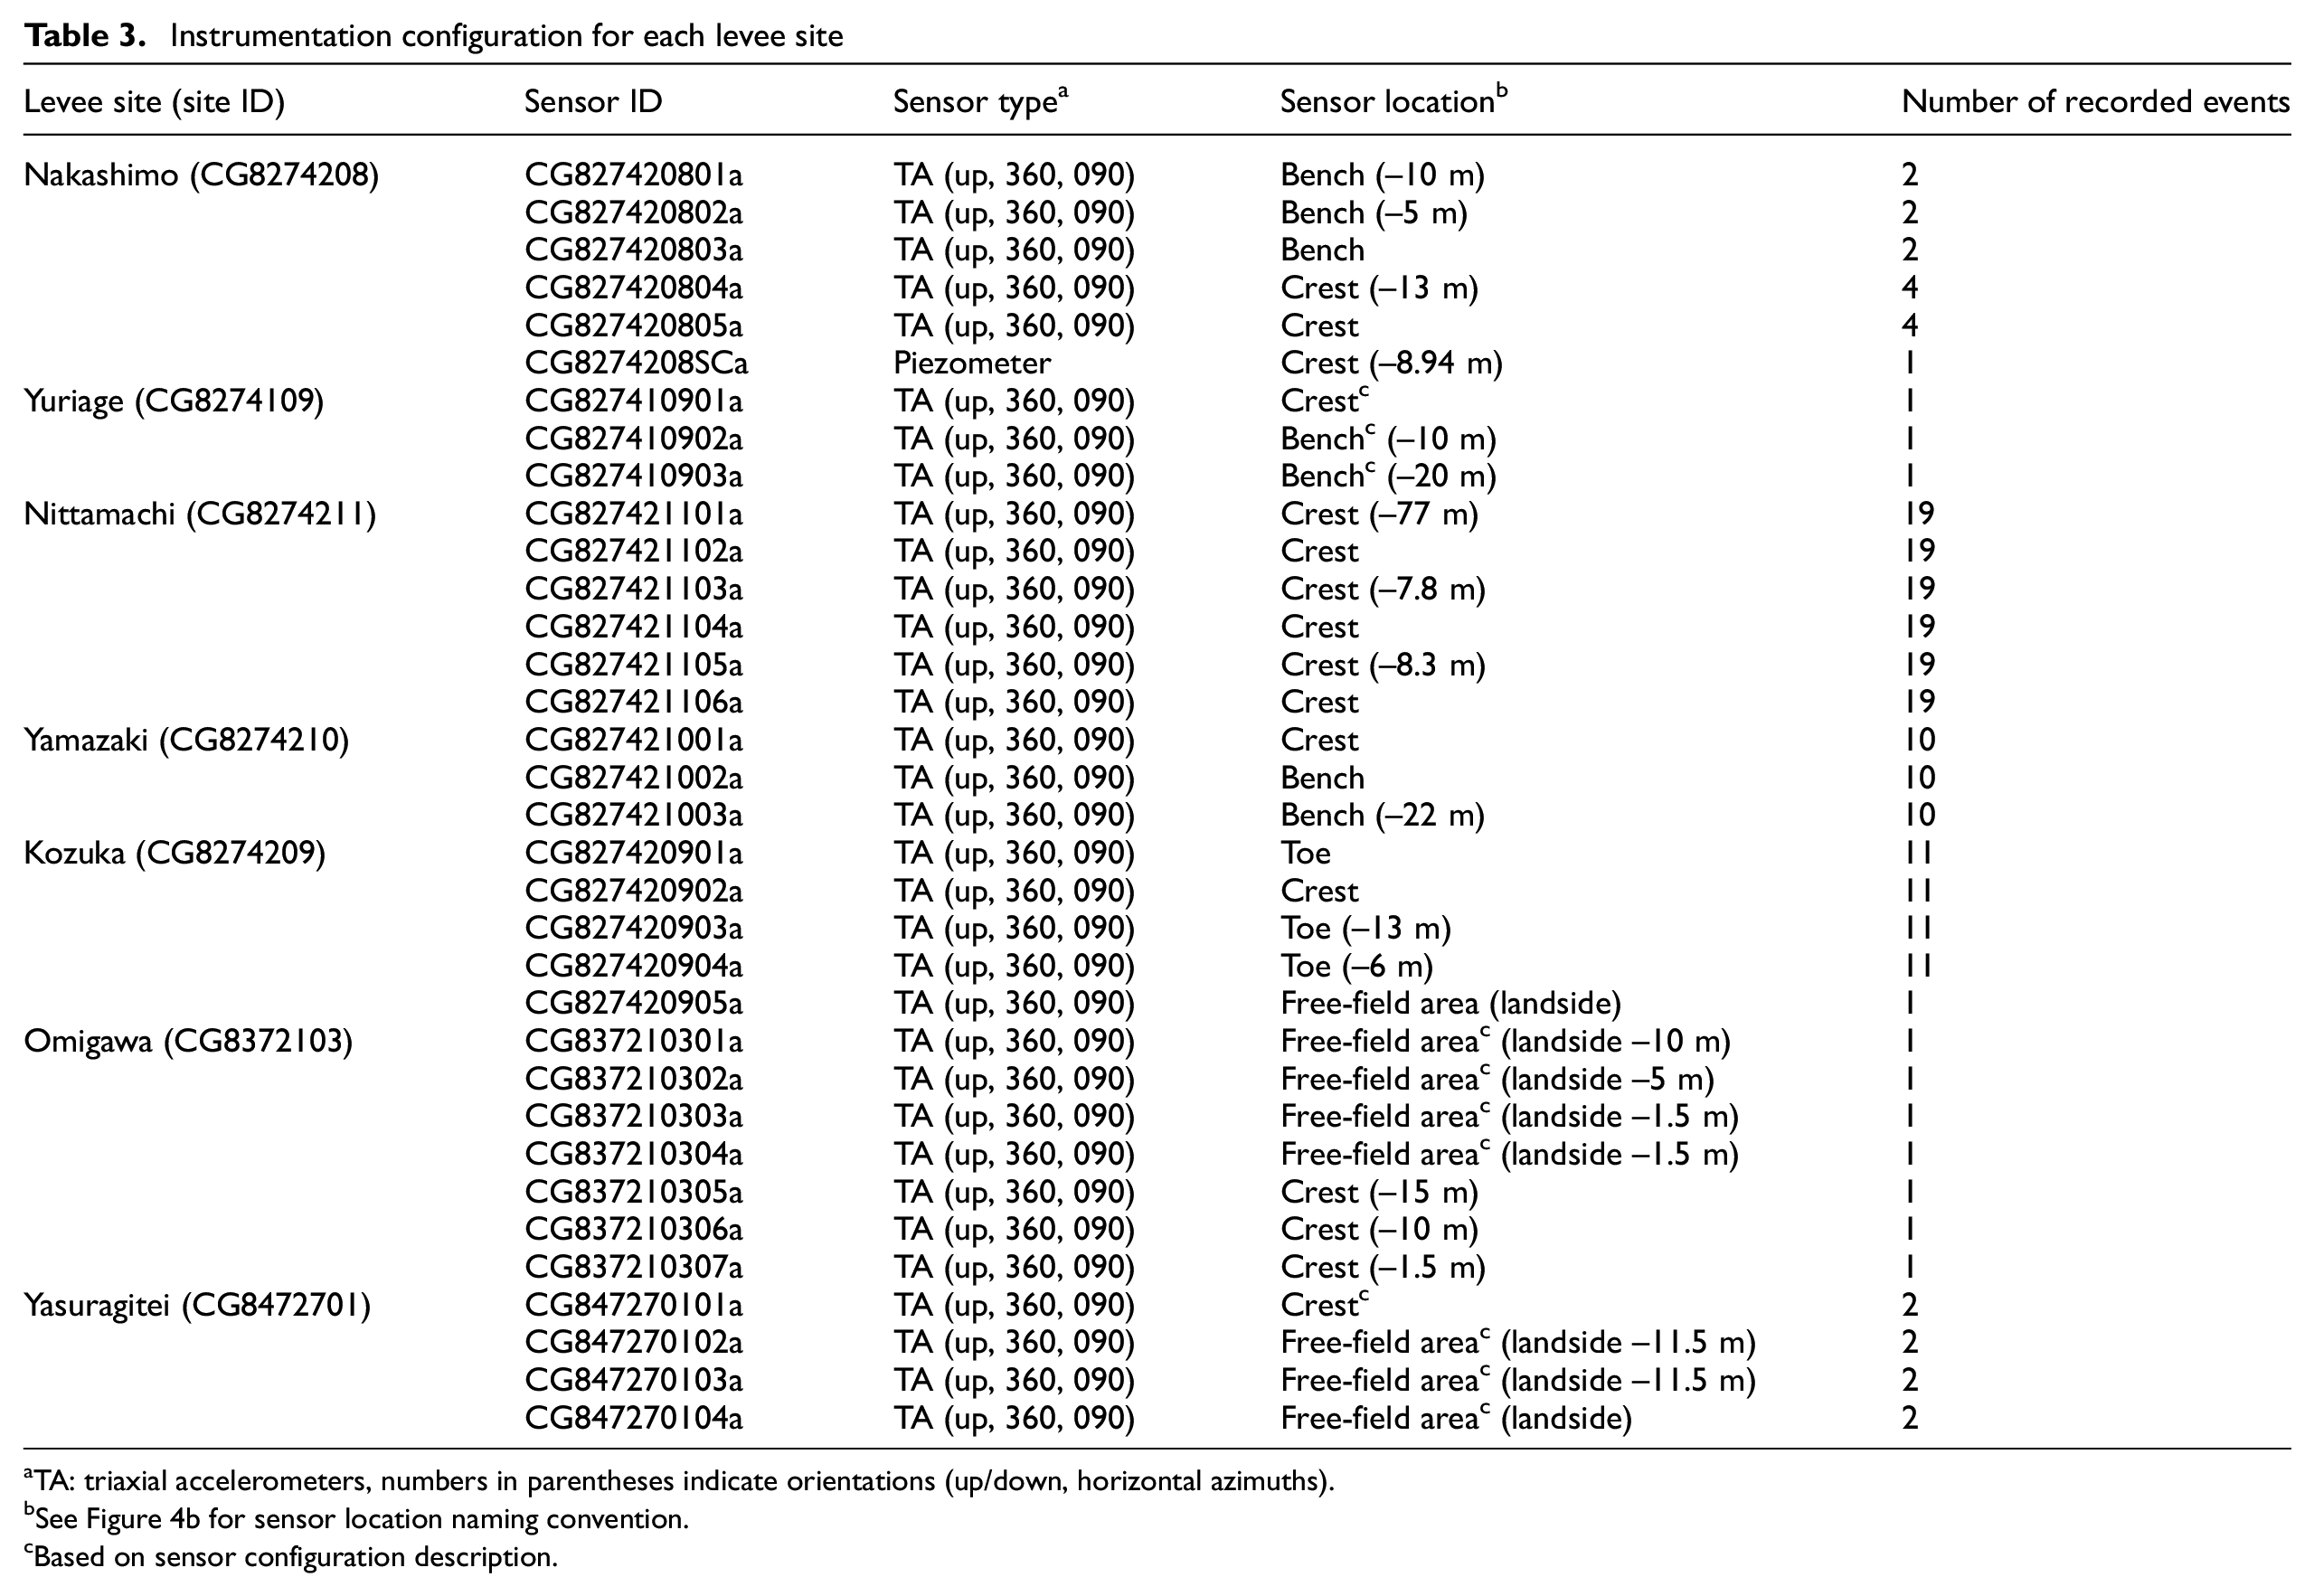
TA: triaxial accelerometers, numbers in parentheses indicate orientations (up/down, horizontal azimuths).
See Figure 4b for sensor location naming convention.
Based on sensor configuration description.
All of the instrumented levee sites have a triaxial accelerometer at the levee crest as well as a downhole triaxial accelerometer. In some cases, the downhole instrument is below the levee crest (Nakashimo, Omigawa, and Nittamachi); in the others, it is below the landside toe. Sites Kozuka, Omigawa, and Nittamachi have multiple downhole instruments. In addition, sites Yamazaki and Kozuka have surface instruments at the landside toe. The piezometer at the Nakashimo site is installed in a sandy layer at a depth of about 8.9 m below the levee crest. As shown in Table 3, the number of recordings at a particular site varies from event-to-event in some cases (e.g. Nakashimo).
Figure 3 shows relatively detailed cross-sections for the Yamazaki, Nakashimo, and Kozuka sites, including boring locations and depths. Figure 4 shows approximate cross-sections for the Omigawa and Nittamachi sites, which are based on limited geotechnical data. The Yasuragitei and Yuriage sites have only a general description of the instrumentation configuration and we do not presently have geotechnical data for these sites. These sites are included in the database to make their presence known; future work will be needed to provide the missing data. Boring log data are provided with the database files following data standards adopted by the Next Generation Liquefaction (NGL) project (Brandenberg et al., 2020). The database structure, along with information about all entries and a data dictionary, is provided in an interactive webpage: http://nextgenerationliquefaction.org/schema/index.html.
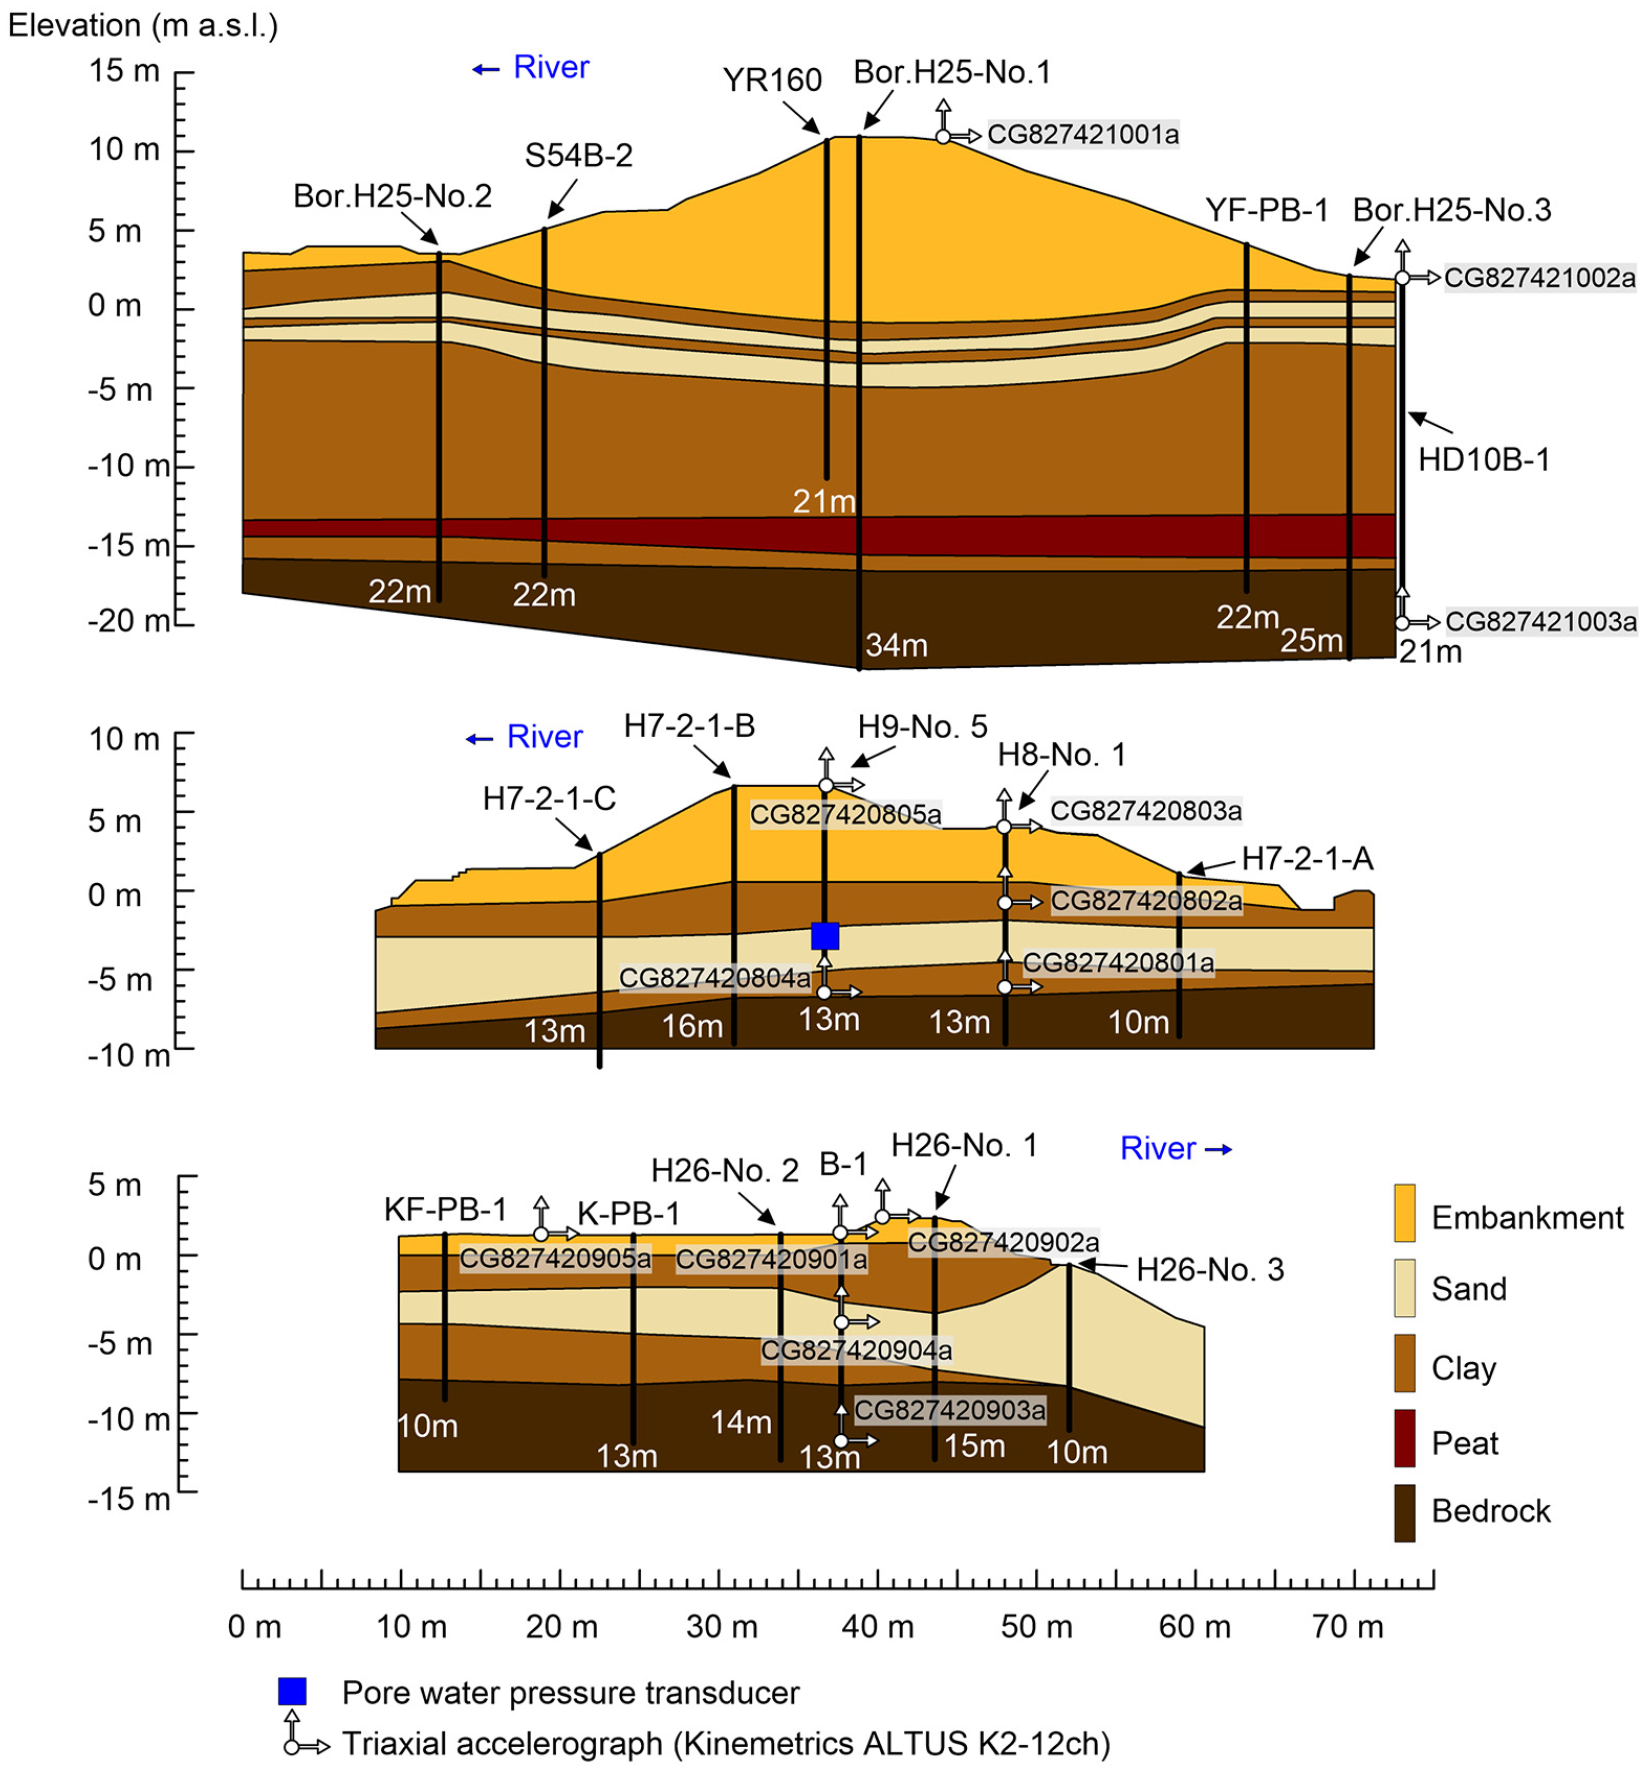
Cross-sections, boring log locations (black vertical lines), detailed layering of the strata under the levees, and position of the recording stations for three instrumented levee sites: (a) Yamazaki, (b) Nakashimo, and (c) Kozuka.
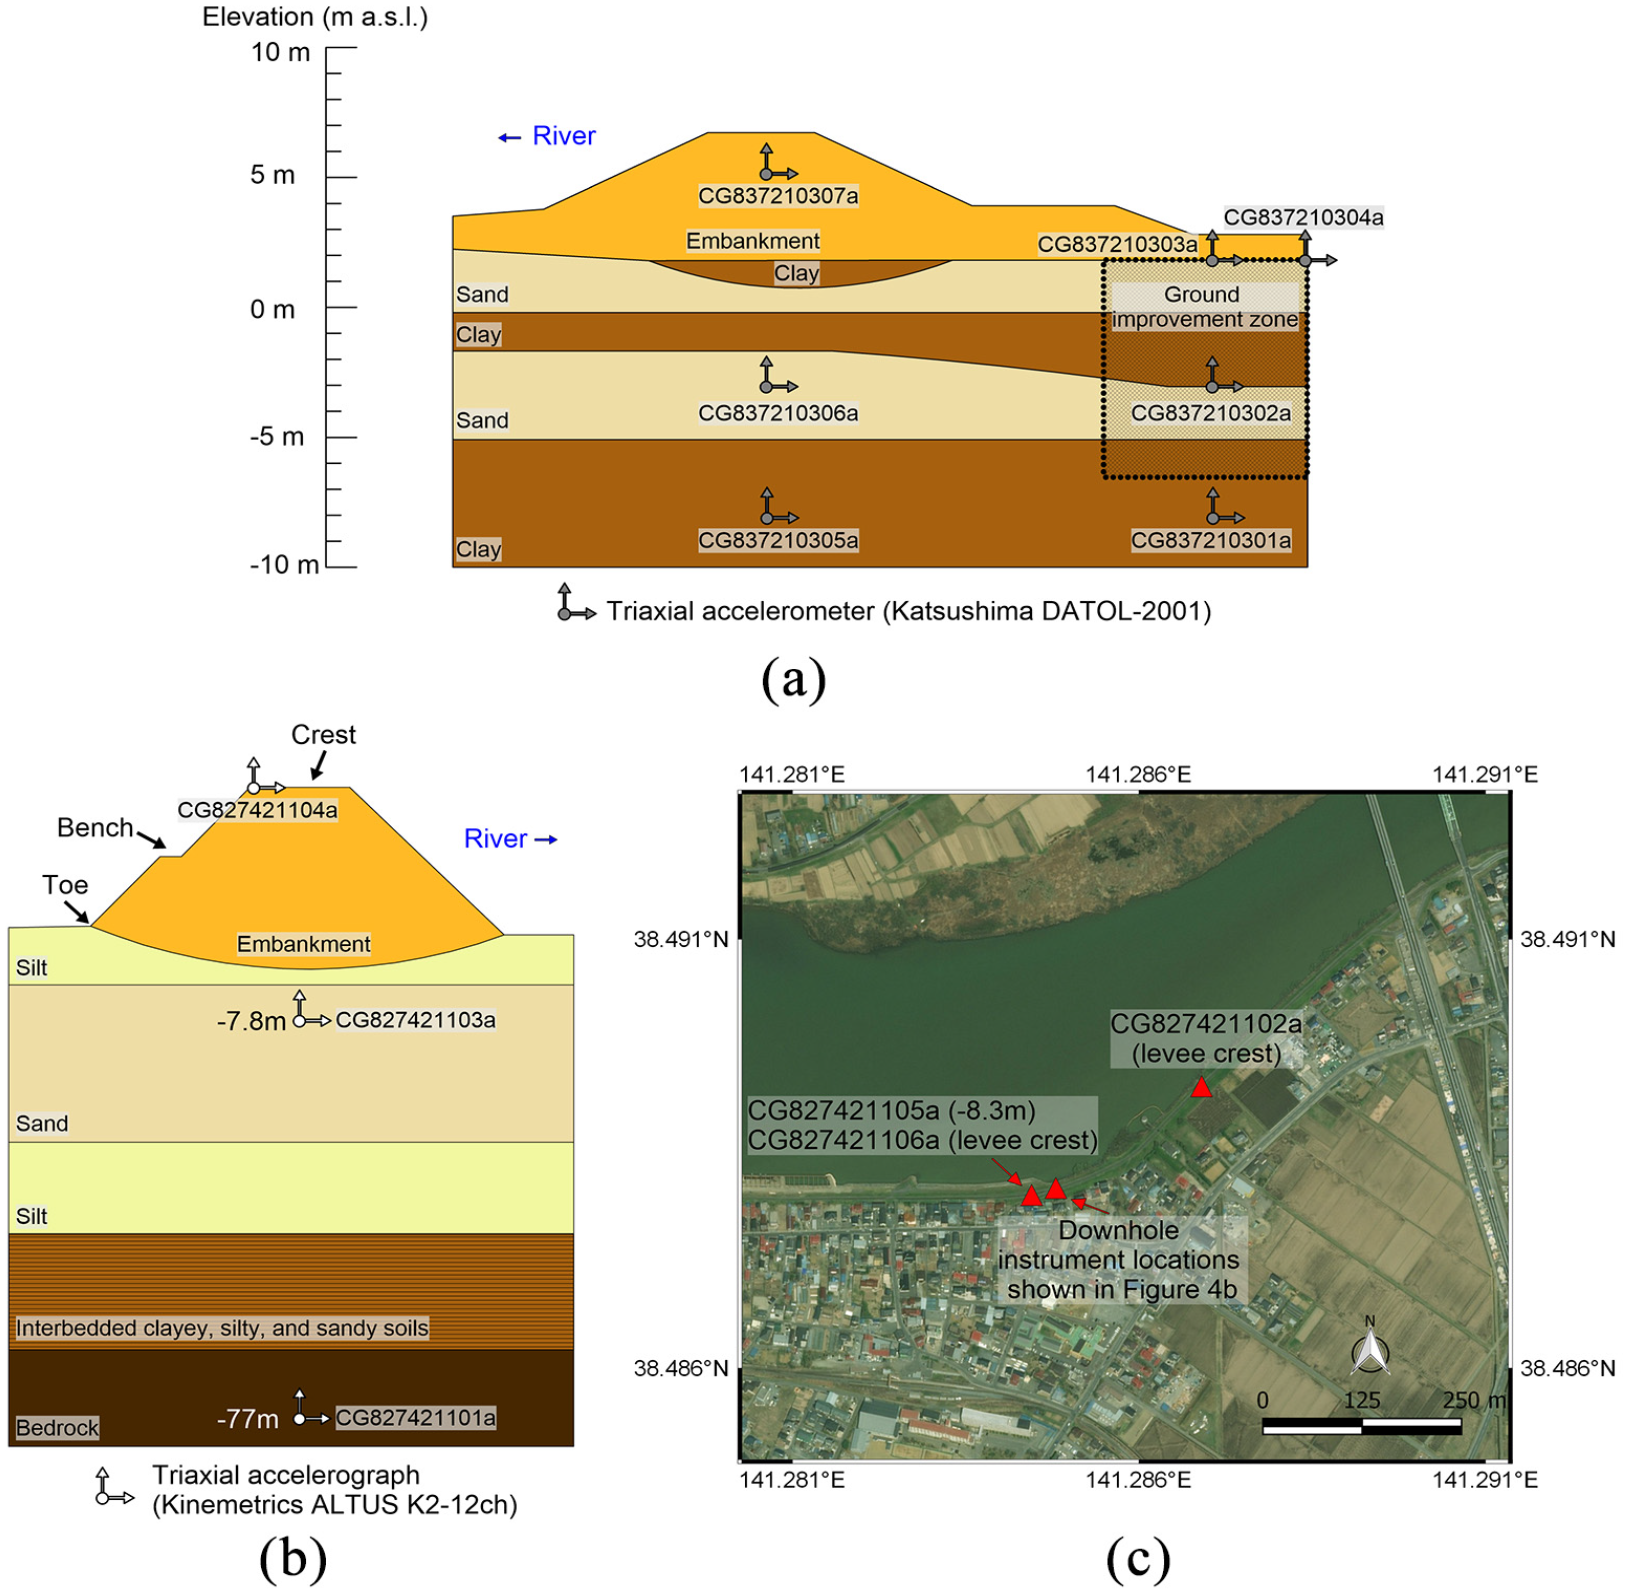
Approximate cross-sections, layering of the strata under the levees, and position of the recording stations for (a) Omigawa and (b) Nittamachi; (c) map showing the location of recording stations at the Nittamachi site. Cross-section geometry for Nittamachi is not to scale.
The Yamazaki site (Figure 3a) is located along the Yoshida river, on the south side of the river channel, 15.8 km upstream from the Naruse river mouth. The levee fill consists of sandy soils, which are founded on clayey and sandy layers. At the time of site exploration (April 2004), ground water was encountered approximately 2 m above the base of the levee fill, beneath the center of the levee crest. The shallow ground water level, along with the presence of sandy fill and foundation materials, causes the site to have a relatively high liquefaction potential. As shown in Figure 5a to c, liquefaction was observed during post-earthquake reconnaissance activities performed at the site by MLIT personnel following the strongest of the recorded earthquakes (
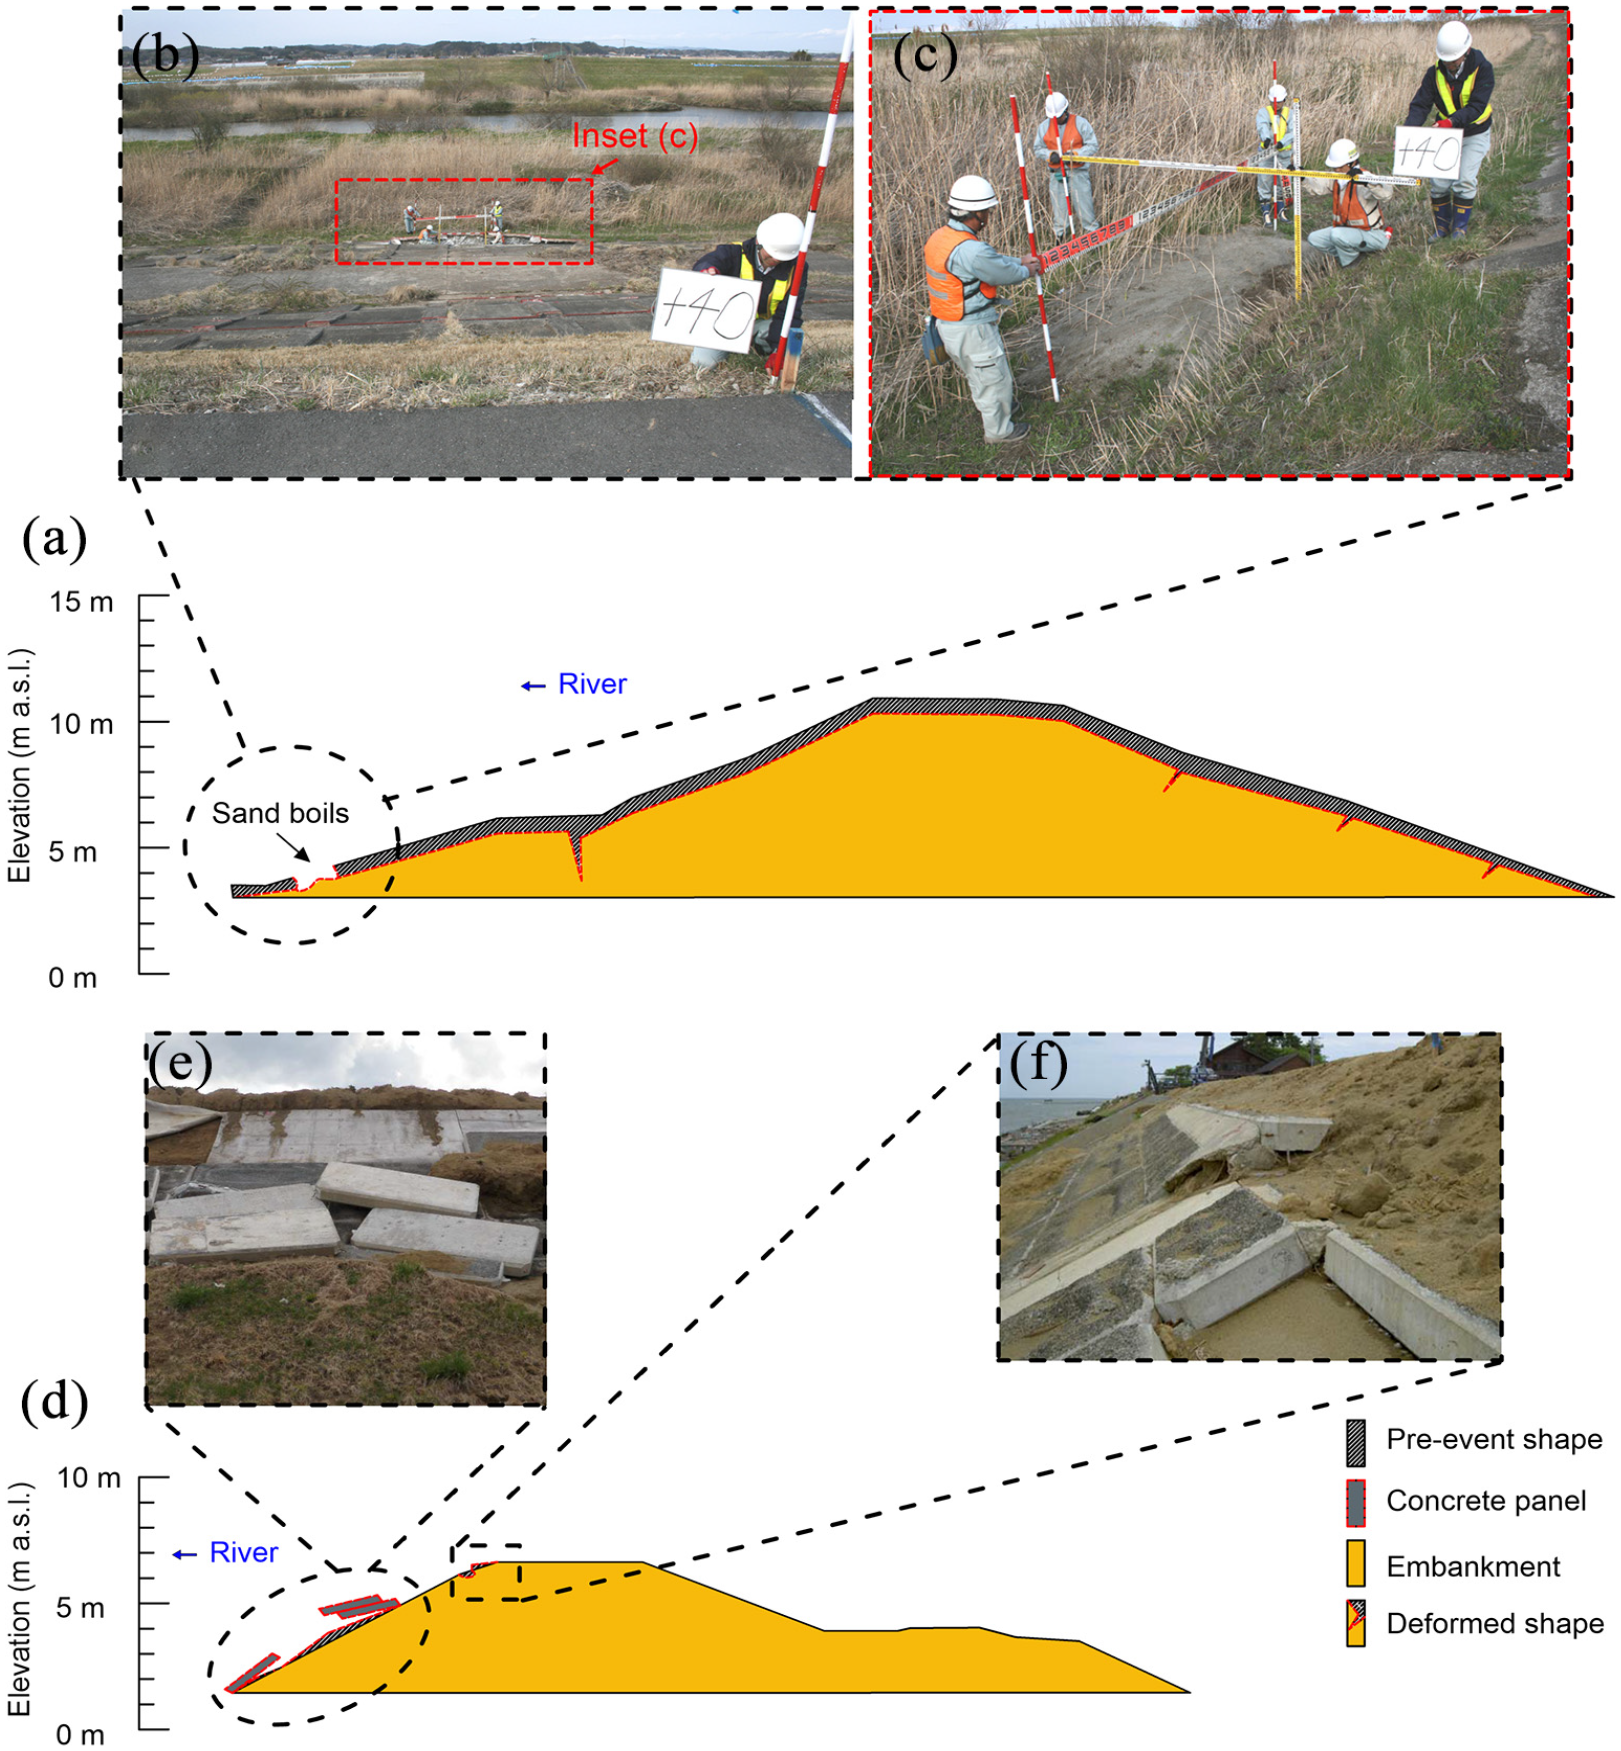
(a) Sketch of the deformed shape of Yamazaki array site following the 2011
The Nakashimo site (Figure 3b) is located 0.8 km upstream from the Naruse river mouth, on the west side of the river channel. The levee fill consists of sandy soils, which in turn are founded on a surficial clay layer approximately 2.5–3.0 m in thickness, which is underlain by a sand layer. At the time of site exploration, ground water was encountered approximately at the elevation of the base of levee fill. This site would also be expected to have liquefaction potential in the foundation sand layer, which is present 8.8–11.5 m below the levee crest (a piezometer is installed in this layer). As described further in the Sample Case History section, the Tohoku-oki event produced a pore pressure response in this layer, but no surficial evidence of liquefaction. This event, as shown in Figure 5d to f, partially damaged the concrete cover of the levee on the riverside for a length of about 70 m along the levee. In this area, some precast concrete panels experienced rotations and some of them detached from the concrete base. At the levee crest, vertical displacements up to 10 cm were observed.
The Kozuka (Figure 3c) and the Nittamachi (Figure 4b) sites are located 5 and 12.5 km upstream from the Old Kitakami river mouth, respectively. The former is on the north side and the latter is on the south side of the river channel. The levee fills for both instrumented sites consist of sandy and gravelly soils, which in turn are founded on successive layers of clays (approximately 3–3.5 m in thickness at Kozuka), sands (about 3 m at Nittamachi), and clays, overlying bedrock. At the time of site exploration, ground water was encountered approximately 2 m below the base of the levee fill at the Kozuka site; this information is not available for Nittamachi. The strongest ground motions at both sites are from the Tohoku-oki event. No surficial evidence of liquefaction was found.
The Omigawa site (Figure 4a) is located 26 km upstream from the Tone river mouth, on the north side of the river channel. The geotechnical data for this site are limited to a generalized cross-section and two boring logs. The sandy levee fill is reported to overly a combination of clays (directly beneath levee crest) and natural sands. This is the only site in the inventory known to have sands directly beneath the levee fill. Deeper layers consist of layered clays and sands. The strongest earthquake recorded at Omigawa was the Tohoku-oki event. No damage to the levee was reported.
The Yuriage and Yasuragitei sites are located 0.74 and 4.5 km upstream from the Natori and Shinano rivers, respectively. The Yuriage site is on the south side, while the Yasuragitei site is on the north side of the river channel. Neither detailed geotechnical information nor post-earthquake observations are available for these two instrumented levee sites. Information about the locations of the available accelerometers at these sites are reported in Table 3.
The available ground water elevation data for the Nakashimo, Yamazaki, and Kozuka sites correspond to the dates of site exploration. This elevation is likely to change over time as river water levels fluctuate and local land use patterns change, and as such may have been different from the measured levels on the dates of recorded earthquakes. Kwak et al. (2016) propose a method to use changes in river water level (measured daily), along with information on seasonal irrigation patterns (typically related to agricultural practices), to infer ground water elevations for dates of interest. This procedure can be used to estimate ground water elevation on the date of an earthquake, which is needed for liquefaction analysis.
Database description
The database presented in this article comprises more than 150 three-component acceleration time series from 25 events recorded at seven instrumented levee sites in Japan. The database is accessible at http://www.nilim.go.jp/lab/rdg/db/db01.htm. The database has a permanent digital object identifier (Kataoka et al., 2019) and contains 2084 files organized into site sub-folders that can be downloaded from the above site as a 119 MB zip file.
In the database, both raw unprocessed and processed accelerograms are available. We processed the data using procedures applied in the Next Generation Attenuation (NGA) projects (e.g. Ancheta et al., 2014). The NGA processing consists of low- and high-pass acausal Butterworth filters applied in the frequency domain for each component of ground motion. Corner frequencies are selected through visual inspection of the Fourier amplitude spectra and displacement time series obtained with alternative filter corners. Baseline correction is also used, in combination with the filter, when filtering alone does not remove non-physical trends in the displacement time series. Figure 6 shows acceleration time series and Fourier amplitude spectra for the two horizontal components recorded at the levee crest of the Yamazaki site during the Tohoku-oki event. The Fourier amplitude spectra show the effect of the low-cut filtering applied during data processing.
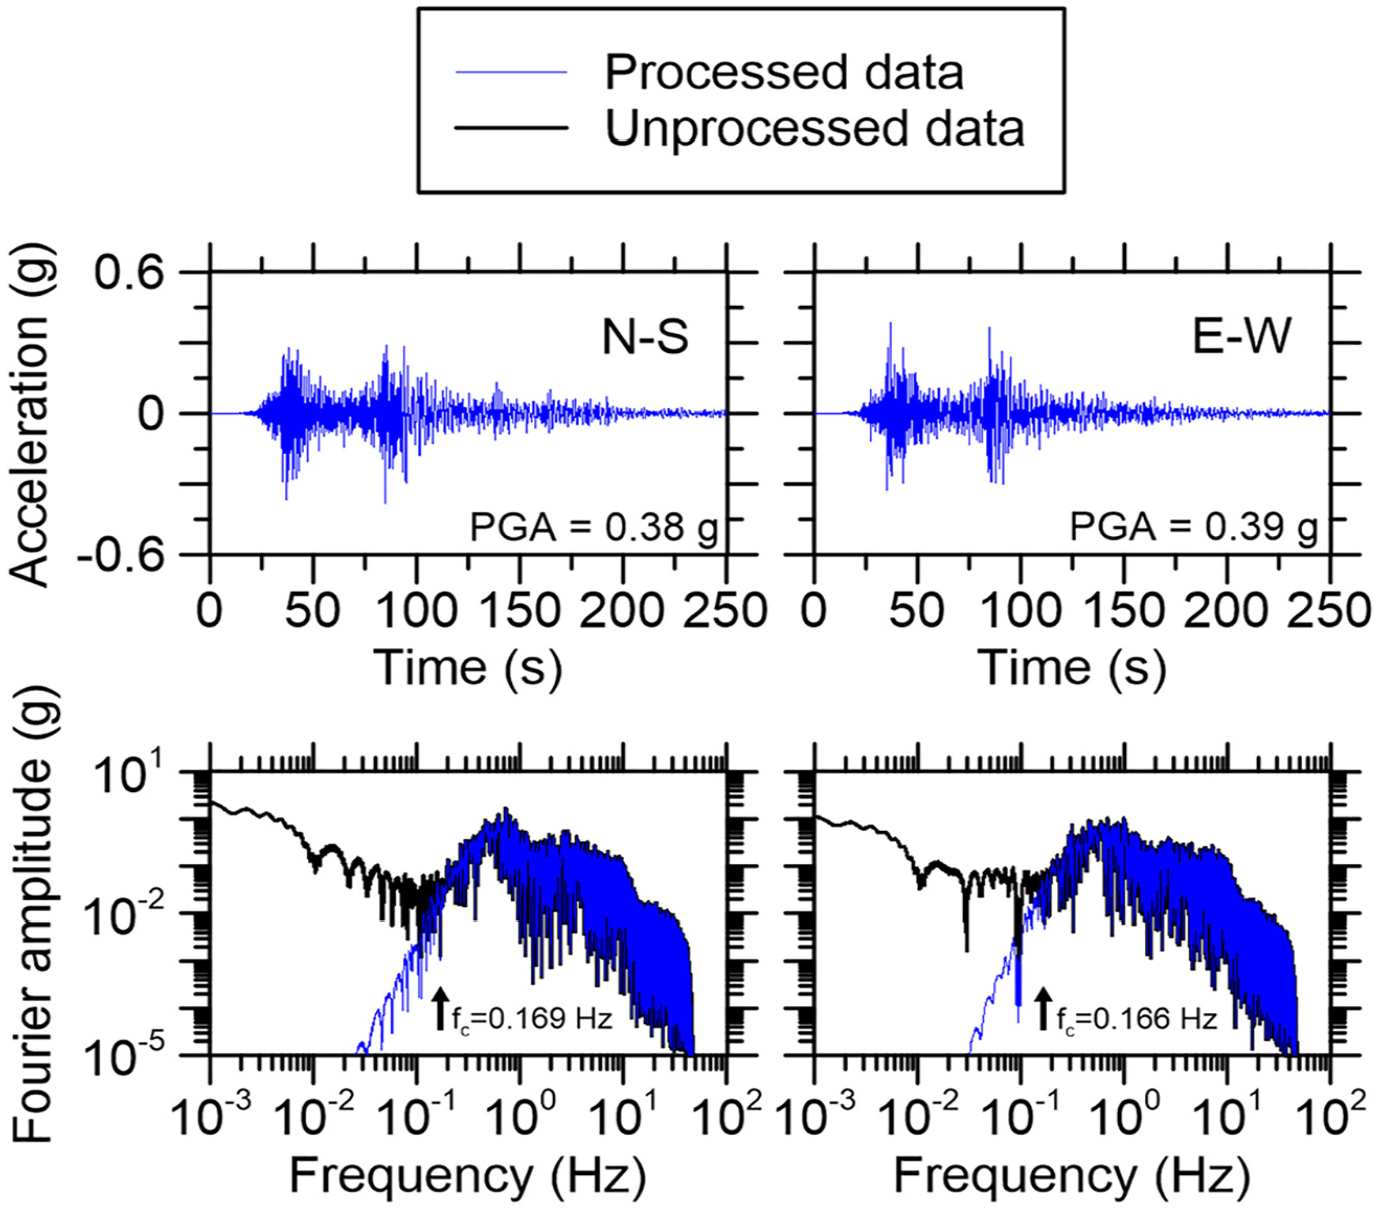
Processed time series and pre- and post-processed Fourier amplitude spectra for crest horizontal-component recordings for Yamazaki site during 2011 Tohoku-oki event.
The database structure used to organize the data matches that for the NGL project. For each site, the data are organized into three major groups:
Site: boring logs, laboratory, and shear wave velocity data. Cross-sections. Plan views.
Event: locations of earthquake events that produced recordings and field observations.
Field performance: surface observations of ground failure or lack thereof. Ground motion and piezometric data for each event.
Sample case history
In this section, we present example data for the Nakashimo site, which was damaged by the
The Nakashimo levee site is located in the Tohoku region (Miyagi prefecture, Figure 1). As shown in Table 3, the Nakashimo levee site is equipped with seven sensors (six triaxial accelerometers and one pore pressure transducer). The
Figure 7 shows processed acceleration time series along with the pore water pressure time series recorded at the site during the
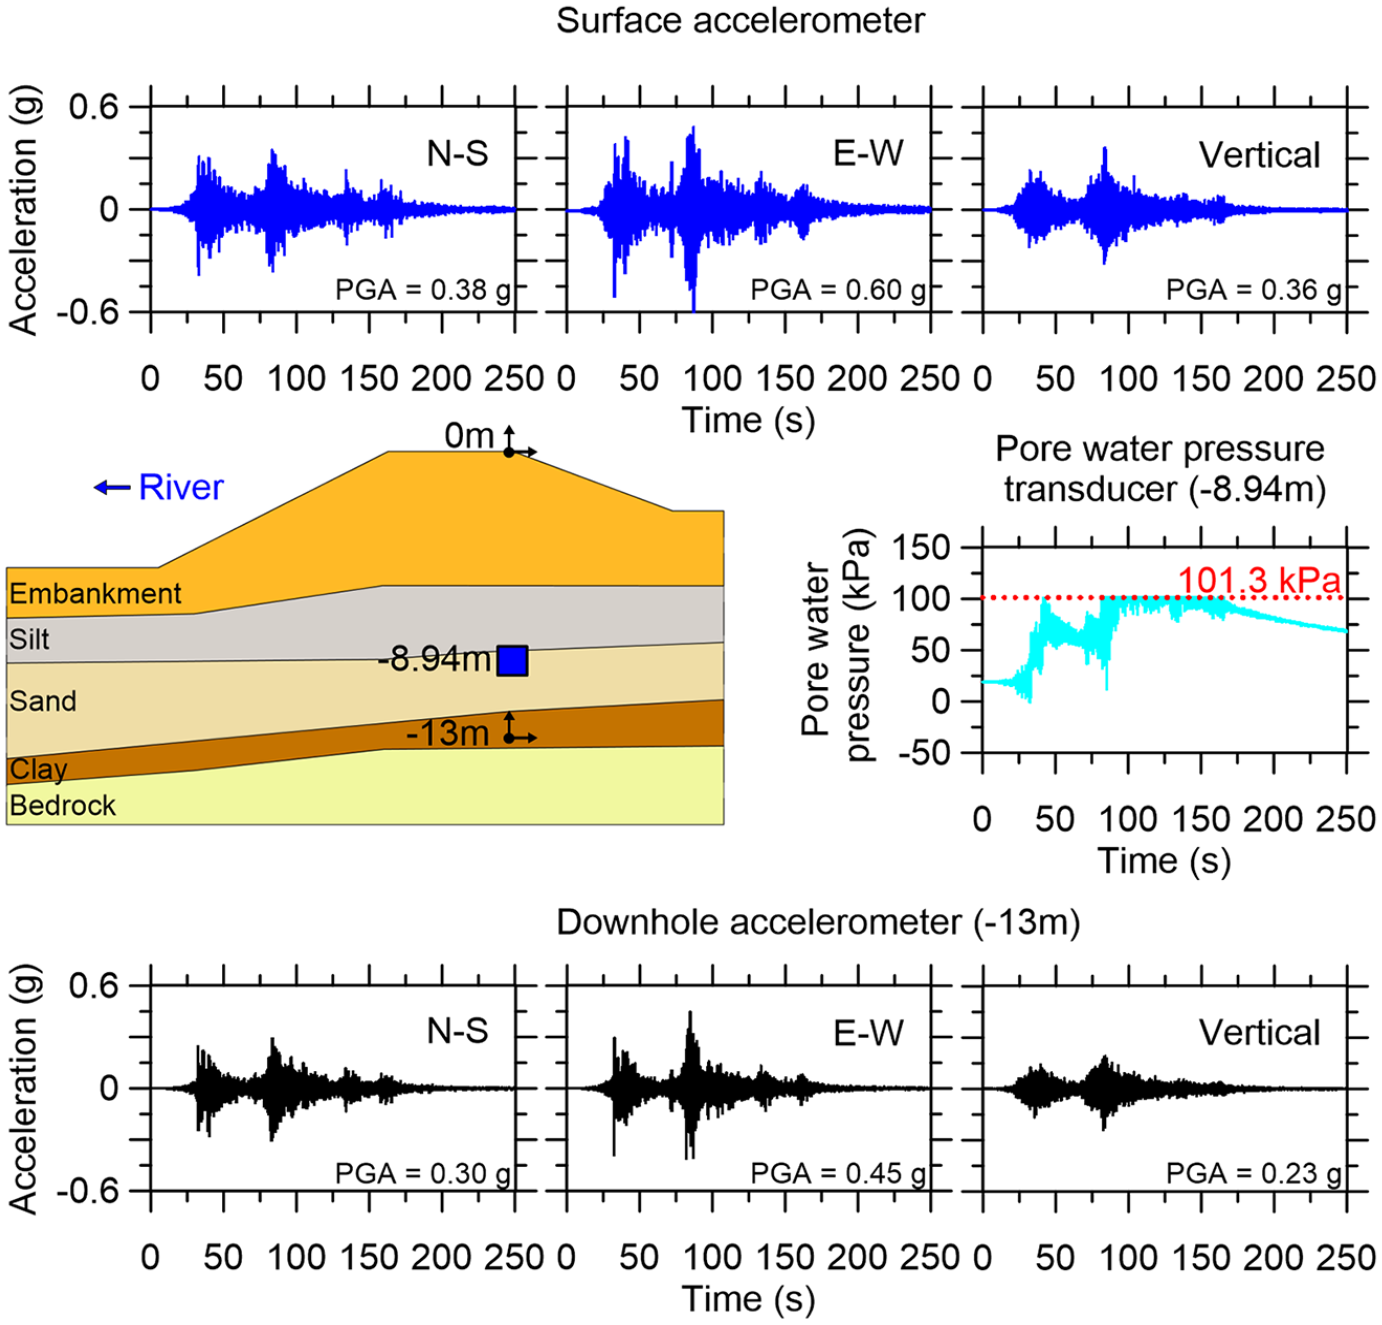
Acceleration and pore pressure time series recorded at the Nakashimo station during the 2011
Data of the sort presented here are useful for validation of numerical modeling routines, and more simplified methods, that are commonly used to predict the performance of critical earth structures. The ability of such tools to reproduce the site response through the levee, the pore pressure response, and the ground deformation are important topics for future investigation.
Summary
In this article, we present an open-source database of earthquake recordings and associated metadata for seven instrumented levee arrays in Japan. The database is hosted at http://www.nilim.go.jp/lab/rdg/db/db01.htm (Kataoka et al., 2019). The compiled data represent a small fraction of the recorded data from a much larger series of arrays and were selected based on having the greatest likelihood of nonlinear soil responses. Data for other arrays have not been released at this time by officials in Japan responsible for managing the data.
The quality of geotechnical data is widely variable across the seven sites, with four having very little information. This relative lack of information is typical of additional arrays within the network but not included in the present compilation. The three sites with good geotechnical data are located in the Tohoku region (Miyagi prefecture) and recorded the 2011
The database presented here, which will likely be expanded in future work, comprises the only known resource for in situ levee response to strong ground motion. We anticipate future research utilizing the database to validate simplified and more advanced numerical analysis routines used to predict pore pressure generation and the onset of liquefaction (e.g., Idriss and Boulanger, 2008), as well as earthquake-induced levee deformations (or the lack thereof) (e.g., Zimmaro et al. 2017). Such methods are often used now without validation and support critical decision making regarding levee seismic risk. Accordingly, the data compiled here have the potential to play an important role in validating these tools.
Footnotes
Acknowledgements
The authors acknowledge data providers, that is, Ministry of Land, Infrastructure, Transportation and Tourism (MLIT), and the National Institute for Land and Infrastructure Management (NILIM).
Declaration of conflicting interests
The author(s) declared no potential conflicts of interest with respect to the research, authorship, and/or publication of this article.
Funding
The author(s) disclosed receipt of the following financial support for the research, authorship, and/or publication of this article: This work was supported by the California Department of Water and Resource (CA-DWR) under contract number 4600008849. This funding source is gratefully acknowledged. The sixth author was supported in part by the River Fund in charge of the Foundation of River and Watershed Environment Management, Japan. These funding sources are gratefully acknowledged. Any opinions, findings, and conclusions or recommendations expressed in this material are those of the authors and do not necessarily reflect those of the CDWR and the Foundation of River and Watershed Environment Management.