
Abstract
Many physical model tests have examined the performance of rocking foundations during cyclic and seismic loading. These tests varied in model size, testing equipment, superstructure properties, footing shape, supporting soil environment, and loading protocol. “FoRCy, Foundation Rocking database of Cyclic and Monotonic Loading” is a new database (published at https://datacenterhub.org/), summarizing the results of monotonic and slow-cyclic loading tests of rocking foundations. The database consists of columns identifying testing equipment and facility, soil, superstructure, and system properties, as well as loading protocol and results. The database contains 456 records (rows), each one being unique in either model configuration or loading amplitude. To illustrate its value, this article shows correlations between (1) settlement, rotation, and factor of safety with respect to bearing capacity and (2) moment and cumulative rotation for shallow footings. Data indicate that the rotation required to mobilize the moment capacity is surprisingly constant (about 0.01 radians) for a wide range of experiments.
Keywords
Introduction to new foundation rocking databases
In an attempt to compile the key experimental data and results of recent rocking foundation test series (centrifuge and shake table testing), two databases have recently been published. One database (FoRDy) summarizes selected data from dynamic experiments on rocking shallow foundations (Gavras et al., 2019); the other (FoRCy) compiles selected data of rocking foundation performance in monotonic and slow-cyclic loading experiments (Hakhamaneshi et al., 2019). This data paper focuses on the FoRCy database. Gavras et al. (in press) present examples from and describe data from FoRDy. These databases allow public access to the experimental data, and hopefully they will provide a body of data with which future similar experiments may be compared, and numerical simulations may be validated. FoRCy and FoRDy aim to share curated “information” as opposed to “raw data.” For example, moment—rotation curves are presented in addition to sensor time series data. Using the same definitions for input data and response results allows data from different researchers in different laboratories to be seamlessly cross-compared.
Background on rocking foundations
Soil–structure interaction (SSI) is known to elongate the natural period of a system, which leads to potentially larger energy dissipation (Veletsos and Meek, 1974). Increased system energy dissipation can significantly reduce the seismic load demand that would otherwise be transmitted to the superstructure. Foundation rocking is an example of an inelastic SSI system with self-centering and energy dissipating capability. Several researchers (Allmond et al., 2015; Anastasopoulos et al., 2010; Antonellis et al., 2015; Bartlett, 1976; Deng et al., 2012; Drosos et al., 2012; Figini et al., 2012; Gajan and Kutter, 2008; Hakhamaneshi et al., 2012, 2016; Hakhamaneshi and Kutter, 2016; Kutter et al., 2016; Liu et al., 2013; Loli et al., 2014; Pecker et al., 2014; Shirato et al., 2008; Tsatsis and Anastasopoulos, 2015; Wiessing, 1979) have investigated the performance of rocking foundation systems. These studies have demonstrated that rocking foundations have beneficial re-centering and energy dissipation characteristics and that foundation rocking can act as an inelastic isolation mechanism that may be designed to enhance the seismic performance of a soil-foundation-structure system.
Figure 1a shows a schematic of a footing supporting a shear wall–type structure. The footing is of length (L) in the plane of rocking and of width (B) perpendicular to the plane of rocking. A total axial load (Pst) and a total lateral (shear) load of (V) are applied to at a height (h) above the base of the footing. Due to the applied loads, the center of the footing (point O in Figure 1c) can rotate (θ), slide horizontally (u) and settle (s). A resultant force is consequently exerted to the footing from the soil, consisting of a sliding resistance force (F), and a normal force (R). For reference, if a shallow footing was supported on a rigid base, two conditions must be satisfied to cause sliding. First, the applied shear force needs to be equal to the frictional resistance of the soil–footing interface, and second, the applied moment about the base of the footing (M = Vh) needs to be smaller than the resisting moment (Pst.L/2); at large rotation demands, the P − Δ moment is also applied at the soil–footing interface. However, for a rigid base, if the horizontal load is applied at a height greater than L/(2 μ) (where μ is the coefficient of friction), the footing will tip about its corner, and it will bear on a sharp corner of the footing. For a non-rigid base, as the footing rocks, a minimum contact area (Ac in Figure 1b) will be required to support the axial loads. The ultimate bearing capacity of the soil is fully mobilized (qult) when the contact area is equal to Ac. The critical (minimum) contact length (Lc) is equal to Ac/B for rectangular footings loaded along the length of the footing. The term “critical contact area ratio” is defined by
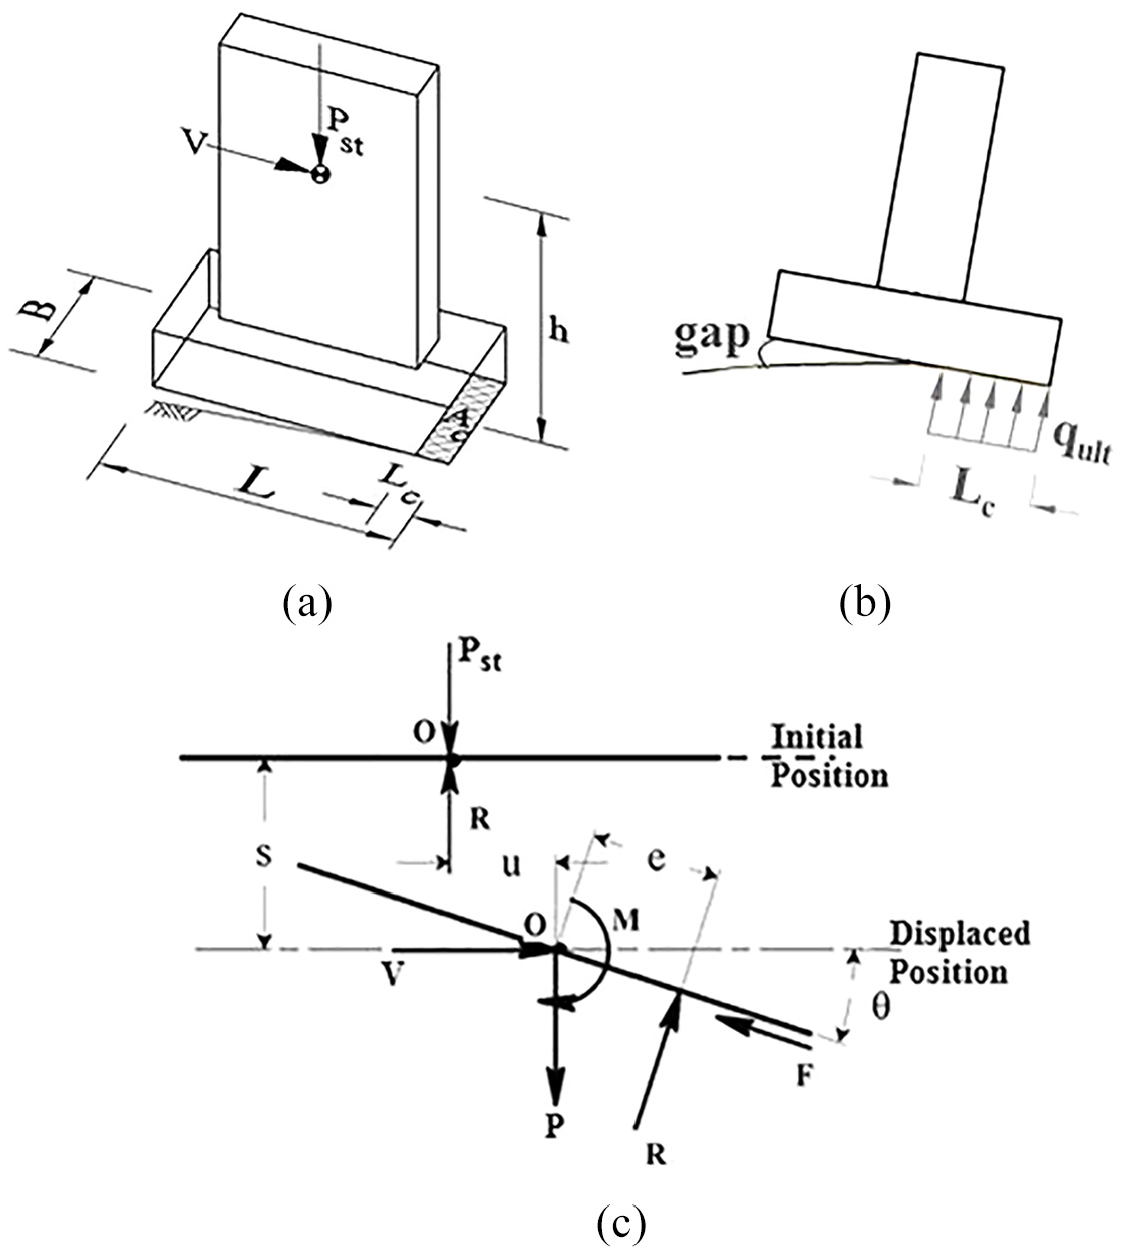
(a) Rocking shallow foundation under vertical load (Pst), lateral load (V) with definition of critical contact area (Ac) and critical contact length (Lc = Ac/B), (b) mobilization of ultimate bearing capacity at the critical contact area, and (c) forces and deformations due to the applied axial and lateral loads (Hakhamaneshi and Kutter, 2016).
The moment capacity of a rocking foundation (Mfc) can be defined as the moment about the base of the footing due to application of the shear force (V) at a height (h). For a rectangular footing, Deng et al. (2014) proposed an estimation of the rocking moment capacity (Mfc) from Equation 1a.


Other researchers (e.g. Meyerhof (1963) and Allotey and El Naggar (2008)), derived Equation 1b for the rocking moment capacity, which is approximately equal to Equation 1a; FS in Equation 1b is the static factor of safety of the footing with respect to the vertical loading. However, Gavras et al. (in press) and Hakhamaneshi and Kutter (2016) explained that Equation 1a is preferred because it can account for the effect of the shape and size of the contact area on the bearing capacity of the loaded edge of a rocking footing.
Key database columns and test series
Database columns
The database contains 120 columns of information for every event; detailed definitions for each column are provided in the front page of the database. One group of the columns includes data to describe the researchers, sponsor, test facility, loading protocol (displacement based or force based actuator), and model container information. Another group of columns details scaling laws that were used for each test, if the results are presented in prototype scale; scaling factors for length, acceleration and time are reported. Soil layer properties, such as soil type, thickness, water content, relative density (Dr) for sand, and undrained shear strength (Su) for clay constitute another category; the FoRCy database allows information to be entered for up to three distinct soil layers; where the information is available, the uncertainty in these parameters is also indicated. The next group of columns summarizes footing properties: footing shape, dimensions, material, and embedment. Superstructure properties including the height to the center of mass (hcm), the total mass of the superstructure, and the total static weight are described in the next group. Bearing area properties are the next group of columns: initial bearing pressure, bearing capacity with respect to vertical concentric loading (qult) and bearing capacity of the contact area. The next category includes parameters related to system properties such as analytical static factor of safety (FSv_a), ratio of the height to the loading point divided by the length of the footing, critical contact area ratio, and moment capacity. The next group of columns defines the loading protocol: period, amplitude, and number of cycles of the input displacement/force are summarized. The input loading protocol time history is also shared under this category. The foundation response time history data group includes ASCII text files listing moment, shear, rotation, sliding, and settlements measured at the mid-base of the footing as a function of time; plots of key results are also provided. Performance measures are summarized in the next group: several different measures of cumulative and incremental footing rotation, sliding, settlement, and moment capacity.
Test series, participating facilities, and scaling
The FoRCy database contains experimental data from seven series of centrifuge model tests and three series of 1g tests. The centrifuge tests were all performed at the Center for Geotechnical Modeling (CGM) at the University of California, Davis; some on the 9-m-radius centrifuge and others on the 1-m-radius centrifuge, both of which were used to perform lateral slow-cyclic loading of rocking foundations at different centrifugal accelerations. Researchers were allowed to enter their data in model or prototype conditions. Appropriate scaling laws (Garnier et al., 2007) can be used to convert from model to prototype scale. The results and experimental data are however normalized (refer to Key Test Parameters section) to ease the direct comparison without need for scaling. The various 1g test series were performed in Greece, Japan, and Italy. The three contributing institutions are the National Technical University of Athens (NTUA) in Greece, the Public Works Research Institute (PWRI) in Japan, and the European Laboratory for Structural Assessment (ELSA) in Italy.
1g footing tests are characterized as being either large scale or small scale if their length is greater or less than 0.5 m. Because some researchers have used different philosophies for scaling 1g models to prototype scale, ambiguity about scaling was avoided by reporting 1g model test results at model scale. However, centrifuge data are reported in both model and prototype scales, since the scaling laws for centrifuge testing (Garnier et al., 2007) are unambiguous. Table 1 summarizes the individual test programs included in the FoRCy database, research facility, testing equipment, and corresponding key scaling factors. A separate table with row summary for each test series will be presented in the following sections.
FoRCy: research facility, test series, testing equipment, and scaling factors
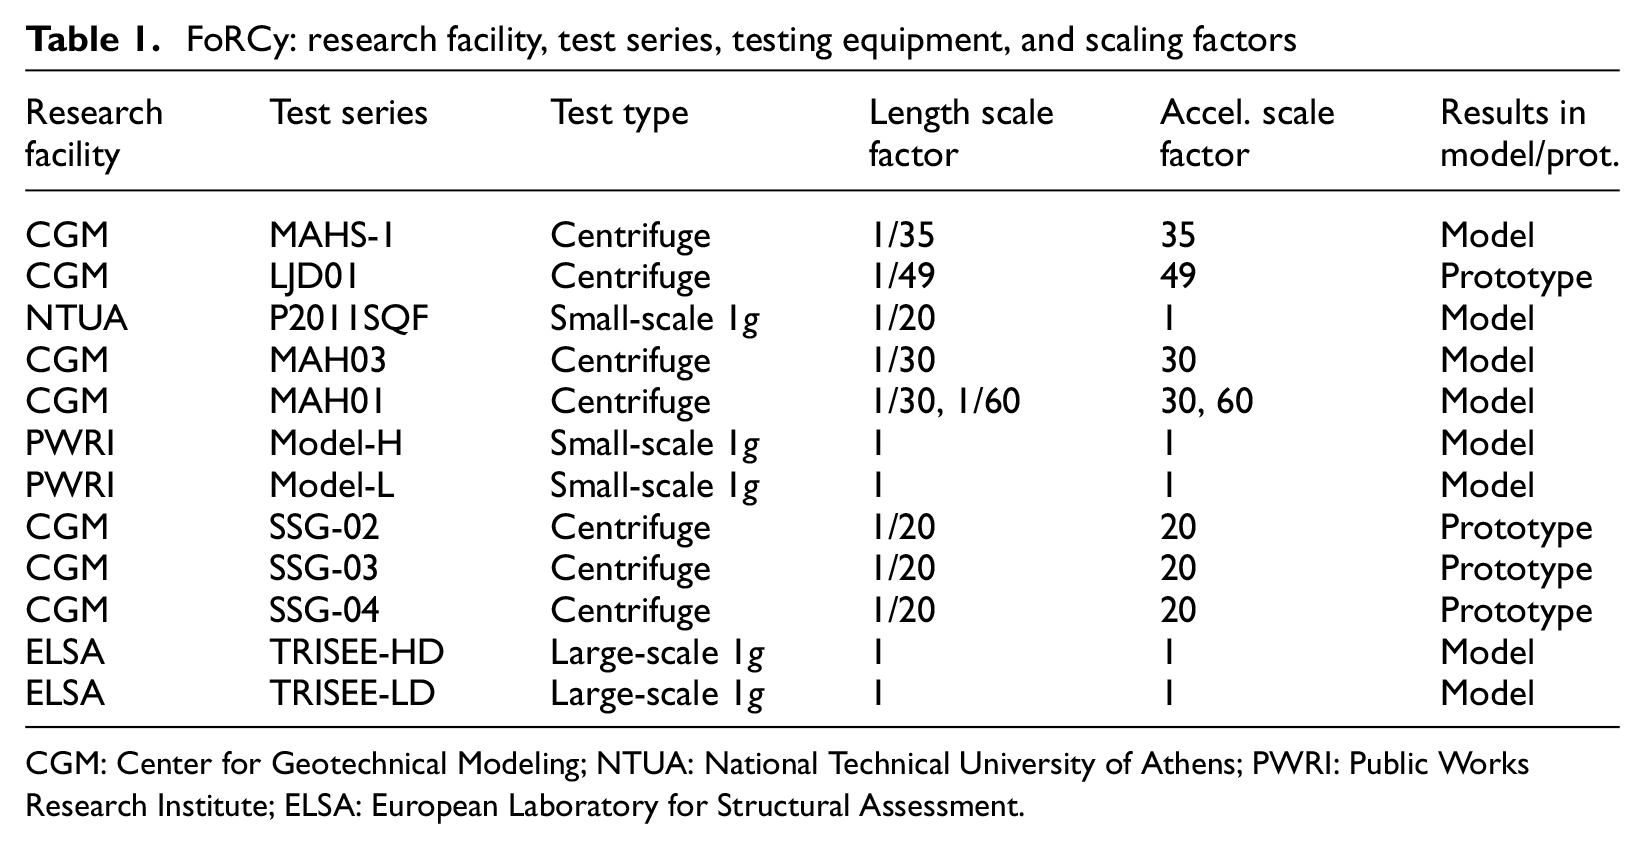
CGM: Center for Geotechnical Modeling; NTUA: National Technical University of Athens; PWRI: Public Works Research Institute; ELSA: European Laboratory for Structural Assessment.
Footing shape properties
The database includes a detailed list of parameters to describe the shape of the footings. Non-rectangular and non-circular footing shapes and skew of their primary axes are accounted for as shown in Figure 2. A rectangular footing is described by its length (L) and width (B) that are the footing side dimensions parallel to the x-axis and y-axis, respectively. The Skew Angle (Figure 2) is defined as the angle between principal axes of the footing and the x-axis, where lateral loading is applied in the x-direction. Hakhamaneshi and Kutter (2016) summarized results of rocking foundation tests on H-shaped footings and introduced the parameter missing area ratio (MAR) for non-rectangular or non-circular footing (MAR = Amissing/Arect). In addition to MAR, tw and tfl are used for H-shaped or C-shaped footings to describe the thickness of the footing flange and web, respectively, whereas Bmin is used for trapezoidal footings as the minimum footing width value (Hakhamaneshi et al., 2016).
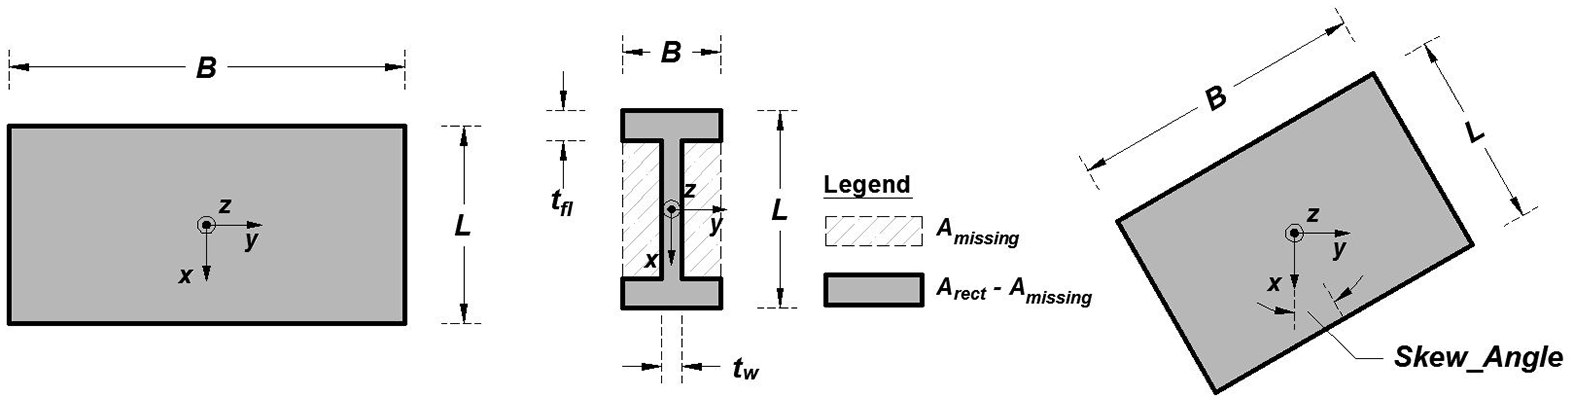
Footing shape properties for rectangular footings of different orientation (length, width, and skew angle) and H-shaped footings (flange, web, and missing area).
FoRCy: test objectives, key parameters, and loading protocol
FoRCy: test series objectives
The current FoRCy database contains data from ten distinct test series listed in Table 1. Figure 3 shows a general schematic of the test series performed at each different facility (CGM, PWRI, NTUA, and ELSA). In general, for lateral slow-cyclic tests, an actuator (displacement based or forced based) is connected in series with a load-cell (measuring the shear force) to the structure through a unique connection. Except the TRISEE tests performed at ELSA, all tests used a displacement controlled actuator to input a displacement time history into the system; the TRISEE tests used a force-controlled actuator for some of the loading packets. The connection between the actuator and the structure varies between the test series; one common connection mechanism was a link supported by a pin on one side and a slider on the other side to prevent vertical load and moment transfer from the actuator to the structure; other researchers used a pinned–pinned rigid link in the connection. The details of the actuator type and connections are included in the database.
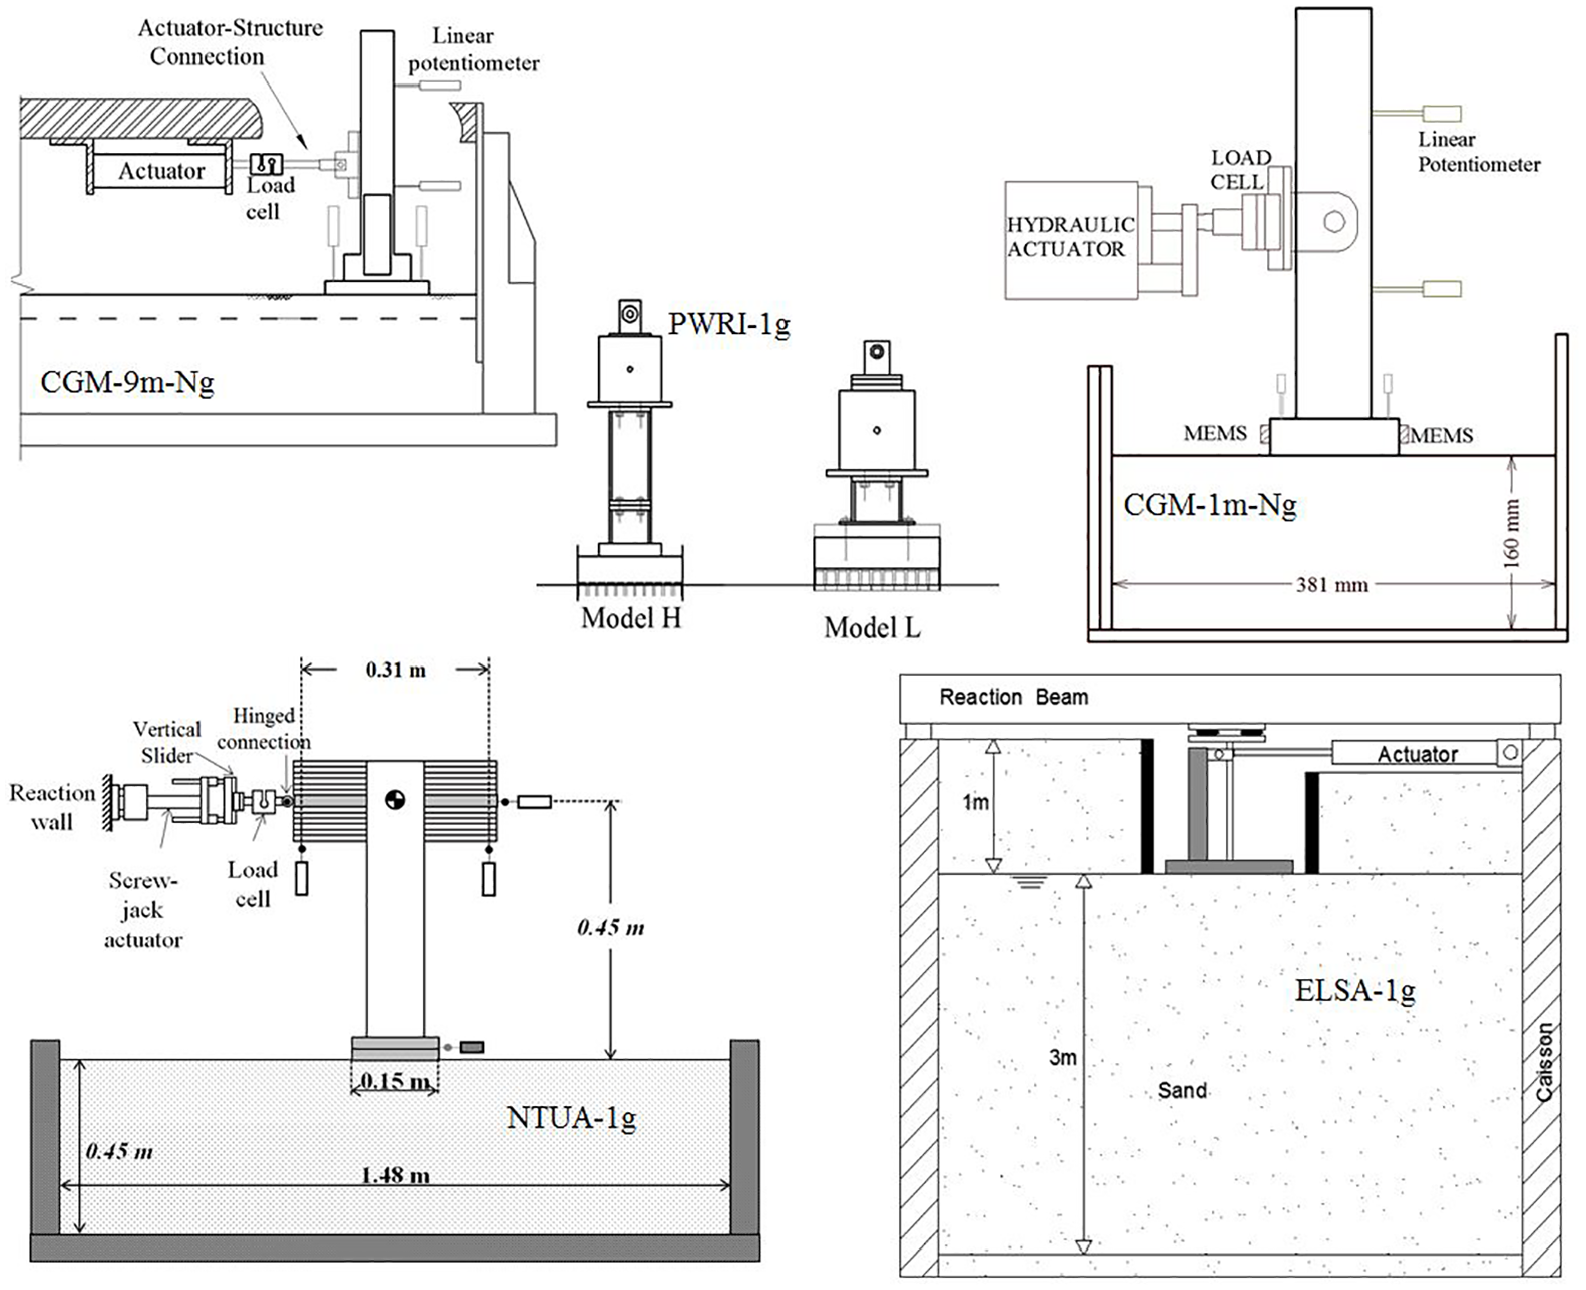
Schematic of the container, soil, and structure of rocking foundation test series included in the FoRCy database (not to scale). CGM: Center for Geotechnical Modeling; PWRI: Public Work Research Institute; NTUA: National Technical University of Athens; ELSA: European Laboratory for Structural Assessment.
As shown in Figure 1, during rocking, a gap opens up under the footing. If embedded, some of the surrounding soil, especially if it consists of sand, may fall into this gap. For embedded footings with large A/Ac ratios, larger gaps form, and hence, a larger amount of cyclic uplift is possible. The TRISEE tests performed at the ELSA laboratory are a special case since side-walls (Figure 3, ELSA Tests) that prevented sand from falling into the gap and hence this uplift mechanism was not allowed.
The MAHS-1 test series was performed on the 1-m centrifuge facility at CGM at 35g. The objective of this test series was to study the effect of footing shape and initial embedment on the deformation of rocking shallow foundations (rectangular footings of different L/B and H-shaped footings of different flange and web thickness). Medium-dense dry Nevada sand was pluviated, and a stiff shear wall structure was tested under slow-cyclic displacement controlled loading for each different shape footing. Hakhamaneshi and Kutter (2016) further explain the test configuration and elaborate on the effect of footing shape and embedment on the performance of rocking shallow foundations.
The LJD01 test series (Deng et al., 2012) was performed on the 9-m centrifuge facility at CGM (at 49g); they tested foundations that would be typical for highway bridges. Cyclic loading was performed to characterize the load-deformation behavior of footings of different sizes and founded on dry sand of different density (loose and medium dense).
The P2011SQF test series was conducted at 1g at the Laboratory of Soil Mechanics of NTUA using a rigid soil container. Although the gravitational acceleration scale factor is 1, the researchers designed the experiment to be 1/20 of prototype scale. The objective of this study was to characterize the cyclic load-deformation response of a single degree-of-freedom (SDOF) system of surface square footing under lateral loading. The design initial static vertical factor of safety (FSv) and soil density were systematically varied, and the systems were loaded well into their nonlinear region. Different loading protocols were used to investigate the effect of amplitude and number of cycles on the deformation response of the rocking shallow foundations. A total of 9 lateral monotonic push-over and 19 lateral slow-cyclic tests were performed as part of this test series. Anastasopoulos et al. (2011) explain the details of the test configuration, soil and structural properties, and key results.
The MAH03 test series (Liu et al., 2013) was conducted using the 9-m centrifuge facility at CGM at 30g; it included seismic and lateral slow-cyclic testing of low-rise frame-wall-foundation systems. As part of the test series, two tests were conducted on stiff shear wall structures founded on rectangular footings on the surface of a dense dry sand. The MAH01 test series Hakhamaneshi et al. (2011) is the only series in FoRCy with footings on clay.
Two relatively large 1g models were tested at the PWRI (Model-H & Model-L), as discussed by Shirato et al. (2008). One of these experiments was loaded laterally at relatively low height (h = 0.9 L), resulting in significant sliding in combination with rocking. One test series used loose and the other used medium-dense sand. The objective of their testing program was to develop a rationale for predicting cumulative displacements of rocking shallow foundations during an earthquake.
Three series of tests namely SSG02, SSG03, and SSG04 were performed on the 9-m centrifuge facility at UC Davis at 20g (Gajan and Kutter, 2009). Single walls and footings (rectangular shape) were founded (surface and embedded) on a dense dry Nevada sand. The axial load and lateral push heights were systematically varied between tests to cover a wide range of FSv, A/Ac, and M/VL (normalized moment to shear ratio).
A series of large-scale 1g tests of two distinct models (TRISEE-HD and TRISEE-LD) were tested at the ELSA laboratory (Negro et al., 2000). Testing was performed in four distinct phases. In Phase 0, the design-level vertical load was transmitted by an air cushion (Figure 3) to keep the vertical force constant throughout the testing. In Phase 1, single cycles of small amplitudes were applied via a force-controlled actuator to identify the onset of nonlinear behavior in the soil. In Phase 2, an earthquake-like time history was applied through a force-controlled actuator. In Phase 3, a displacement-controlled actuator was used to apply sine-shaped displacement cycles of increasing amplitude to the system and up to the ultimate capacity of the soil-foundation system (Negro et al., 2000). Square embedded footings were founded on loose and medium-dense saturated sand, while the height of loading was kept constant at 0.9 L. The objective of these tests was to assess the permanent deformations caused by foundation nonlinearity during uplift and to provide validation data for the calibration of constitutive soil models.
The database includes links to data reports and other literature that provide all the details of the above experiments.
Key test parameters
Table 2 summarizes key information about footing, superstructure, and system properties relevant to each test series. Footing shape reflects the geometry of the footing (e.g. rectangular, square, or H-shaped). H-shaped footings were only tested in the MAHS-1 test series. The L/B ratio reflects the length-to-width ratio of the rocking footing (ratio of in-plane length to the length perpendicular to the plane of rocking). Hakhamaneshi and Kutter (2016) discussed the significance of shape on the settlement/uplift of footings. Footings with width larger than length (L/B < 1) were tested in the MAHS-1 test series. The embedment of the footing (D) is normalized by the length of the footing; the TRISEE tests had the largest embedment.
FoRCy: Summary of footing/structure/system properties
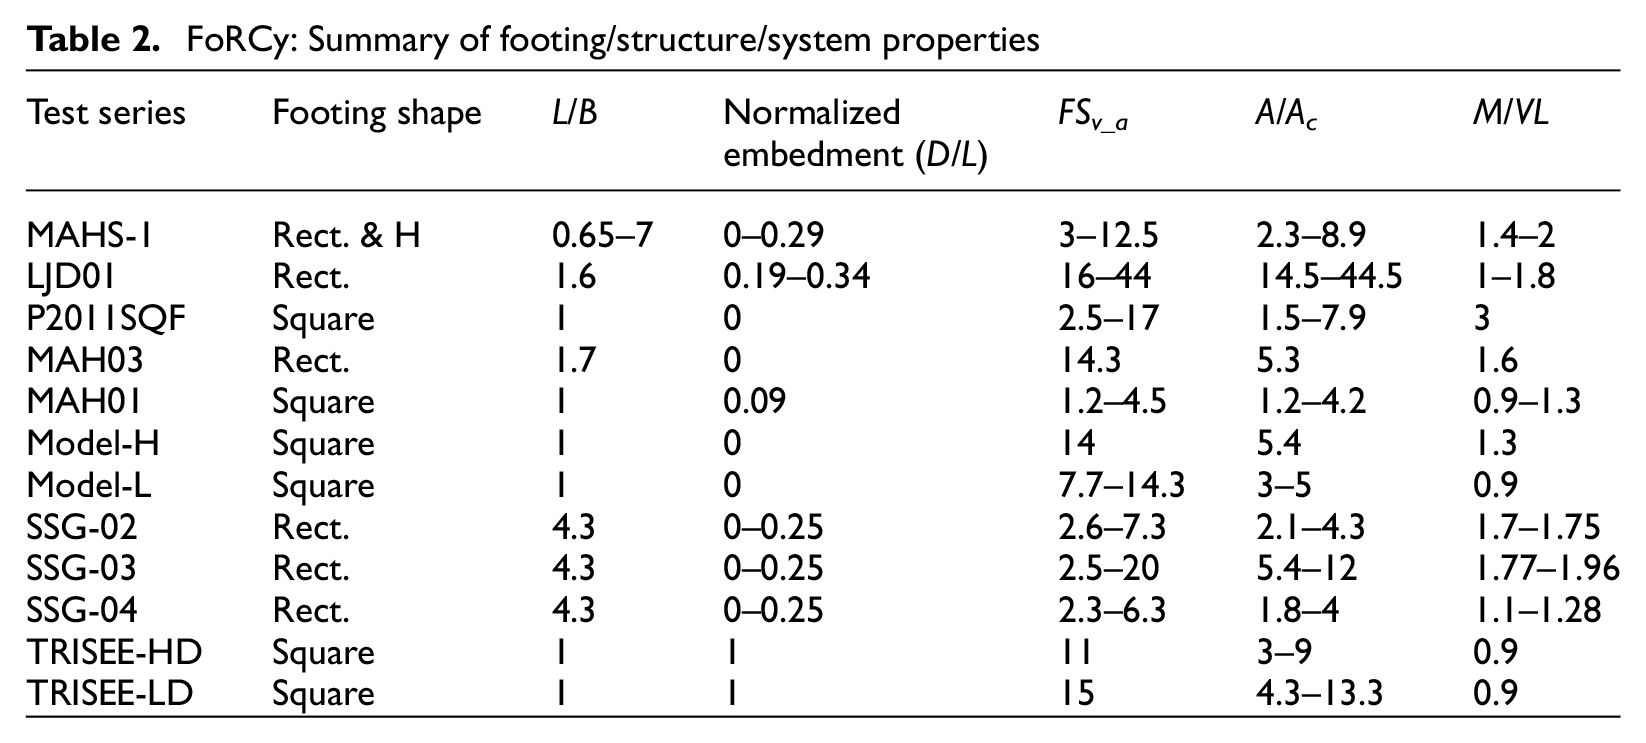
The static factor of safety, FSv_a, reported in Table 2 is the ratio of ultimate bearing capacity (qult) by the static bearing pressure under the footing (q) for vertical concentric loading. The “–a” in the subscript indicates that the FSv_a was determined analytically; if the factor of safety is determined experimentally, the factor of safety is indicated by FSv_e. The inverse of the critical contact area ratio (1/ρac = A/Ac) is also summarized in this table. The difference between FSv and A/Ac was explained following Equation 1. Table 2 also lists the Normalized Moment-to-Shear Ratio (M/VL = h/L), where h is the height to the point of loading (which may differ from the height of the center of mass, hcm). Gajan and Kutter (2009) showed that if this ratio is greater than 1, rocking deformations will typically be dominant. Sliding deformations typically become more important for M/VL < 1. The amount of footing embedment is also summarized in Table 2; Hakhamaneshi and Kutter (2016) have discussed the dependency of footing settlement on embedment.
Figure 4 provides an overview of the range of parameters for the experiments described in the FoRCy database. Different symbols are used for 1g testing, centrifuge tests on sand, and on clay. Due to the unique side-wall setup of the TRISEE tests, they are plotted with a distinct symbol (similar shape to 1g tests but with lighter color). Figure 4a (top left) shows the moment to shear ratio, h/L, plotted against L/B. In most cases, the L/B ratio ranged between 1 and 5, and almost all of the tests involved h/L ratio between 1 and 2. Figure 4b plots the h/L against the A/Ac ratio. Most footings had an A/Ac ratio between 2 and 14; only for two tests did A/Ac exceed 15. Figure 4c shows the bearing pressure (q) plotted against the normalized embedment (D/L). The bearing pressures in 1g tests are typically smaller than the pressures in the centrifuge tests, except for the TRISEE tests that were embedded. One of the advantages of centrifuge testing is the capability of simulating realistic bearing pressures without the need of large embedment; for most centrifuge tests, the bearing pressure varied between 80 and 220 kPa, while the majority of bearing pressures for 1g tests were less than 50 kPa. Figure 4 shows that the range of parameters includes a good range of data relevant to prototype problems, although it also shows some gaps in the database.

FoRCy: summary of key parameters of tests in this database (a) h/L vs L/B, (b) h/L vs A/Ac, (c) bearing pressure vs normalized embedment, (d) normalized embedment vs A/Ac, (e) factor of safety with respect to bearing capacity vs A/Ac, and (f) bearing pressure vs A/Ac.
Figure 4d shows the variation of normalized embedment versus A/Ac. This plot shows that the database provides good coverage of a wide range of A/Ac and D/L ratios; however, there is little data for surface footings (D/L = 0) with A/Ac > 8. Figure 4e shows that the force-based FSv is similar but somewhat greater than the geometry-based A/Ac. Gavras et al. (in press) elaborate on factors determining the difference between A/Ac and FSv. Finally, Figure 4f plots the bearing pressure (q) with respect to the corresponding A/Ac. The majority of tests had an A/Ac value of less than 10. Figure 5 compares the size and shape of the footings used in the FoRCy database. The centrifuge foundations are shown in prototype scale according to the length scale indicated at the bottom of the diagram. The 1g tests are shown to a magnified scale, also indicated at the bottom of the figure. The database uses a common right-hand coordinate system for sign-dependent quantities; the x-axis is oriented parallel to the loading direction and z-axis is positive vertically upward.
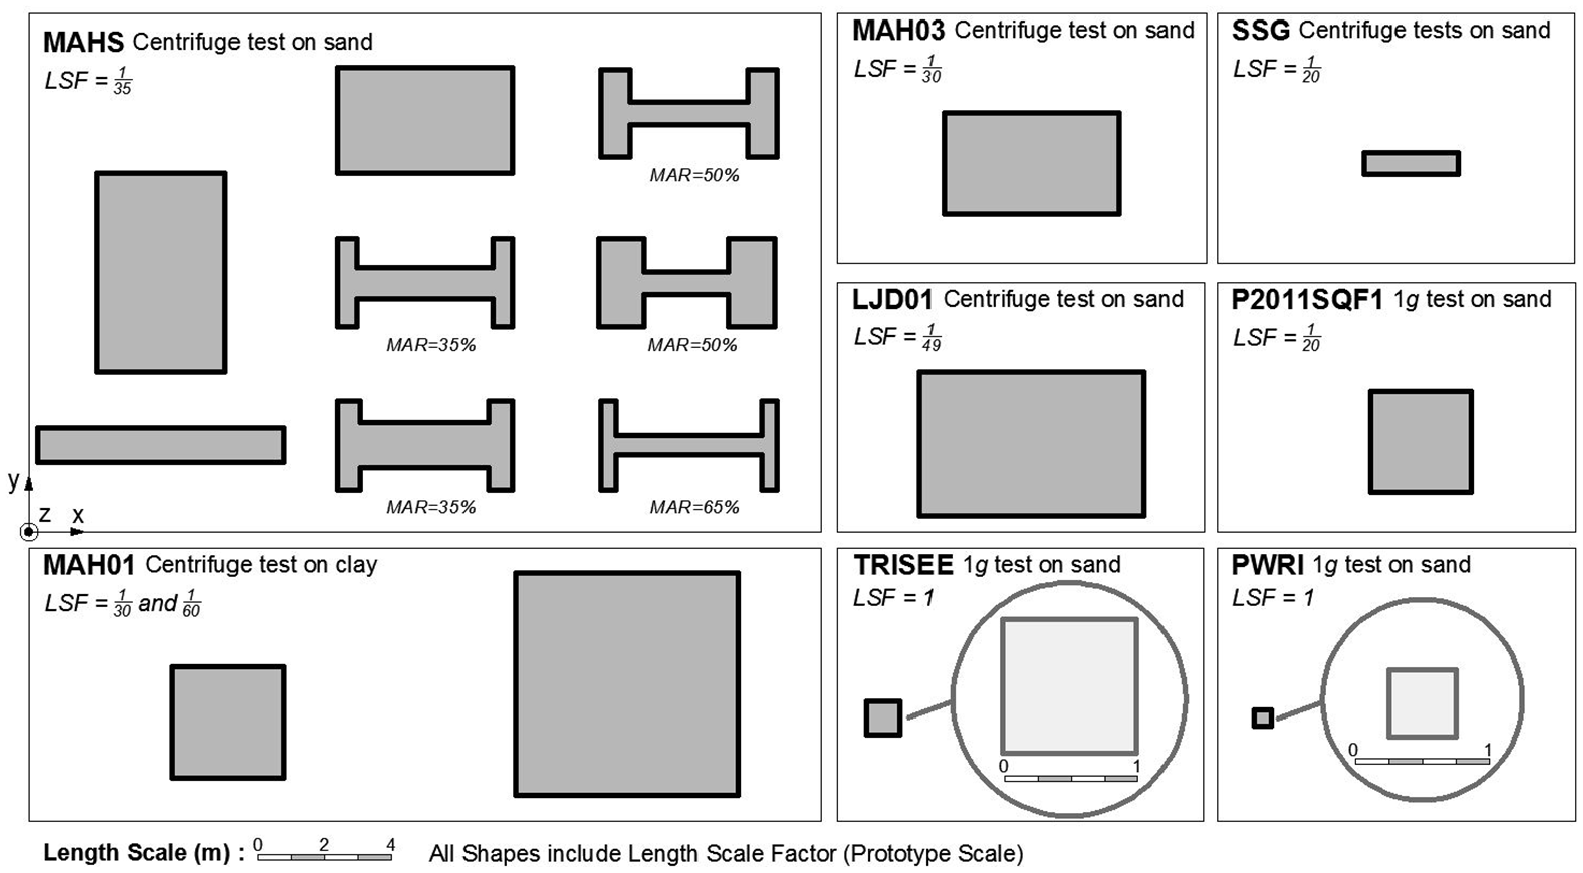
FoRCy: prototype geometry and size of the footings in the database. A zoomed-in geometry of TRISEE and PWRI tests (both 1g) along with a secondary larger scale is also provided.
The MAHS test series involved testing of rectangular footings of prototype lengths between 3.8 and 7.4 m. MAH01 and LJD01 included the longest footings in prototype scale. The 1g tests (P2011SQF1, PWRI, and TRISEE) tested square footings with model lengths of 0.15, 0.5, and 1.0 m, respectively.
Table 3 summarizes the soil properties for each test series in the FoRCy database. Prototype soil thicknesses vary between 2 and 9 m. Corresponding length-scale factors were used for 1g and Ng tests (Table 1).
FoRCy: Summary of soil properties
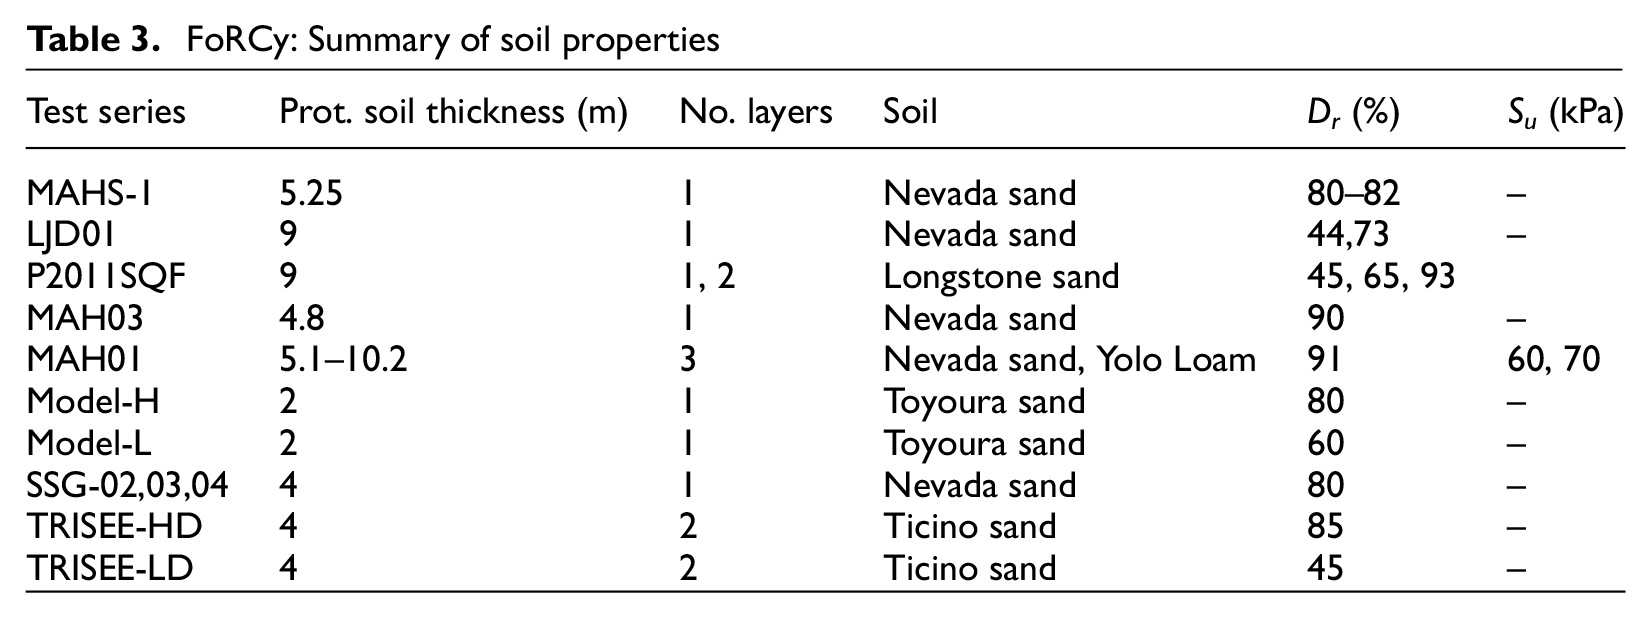
Table 3 indicates that uniform soil conditions were used in most experiments. A few tests included two or three soil layers. Most experiments used dry sand; a saturated silty-clay (Yolo Loam) was used in the MAH01 series. The relative density of sand was varied from 40% to 95%. The undrained shear strength of the clay used in the MAH01 experiment ranged between 60 and 70 kPa.
Figure 6 summarizes the types of loading protocols for FoRCy tests. To allow the data from different protocols to be compared, considerable effort was directed to break the loading cycles into “Packets” of cycles with nearly constant amplitude. Performance data from each packet of each test is separately documented in the database. To explain how packets were defined, consider the CGM loading protocol; it had six packets, each with three loading cycles. The first few cyclic displacements were designed to produce a rotation less than or equal to 0.2%; for each successive packet, the amplitude of the cycles was approximately doubled.
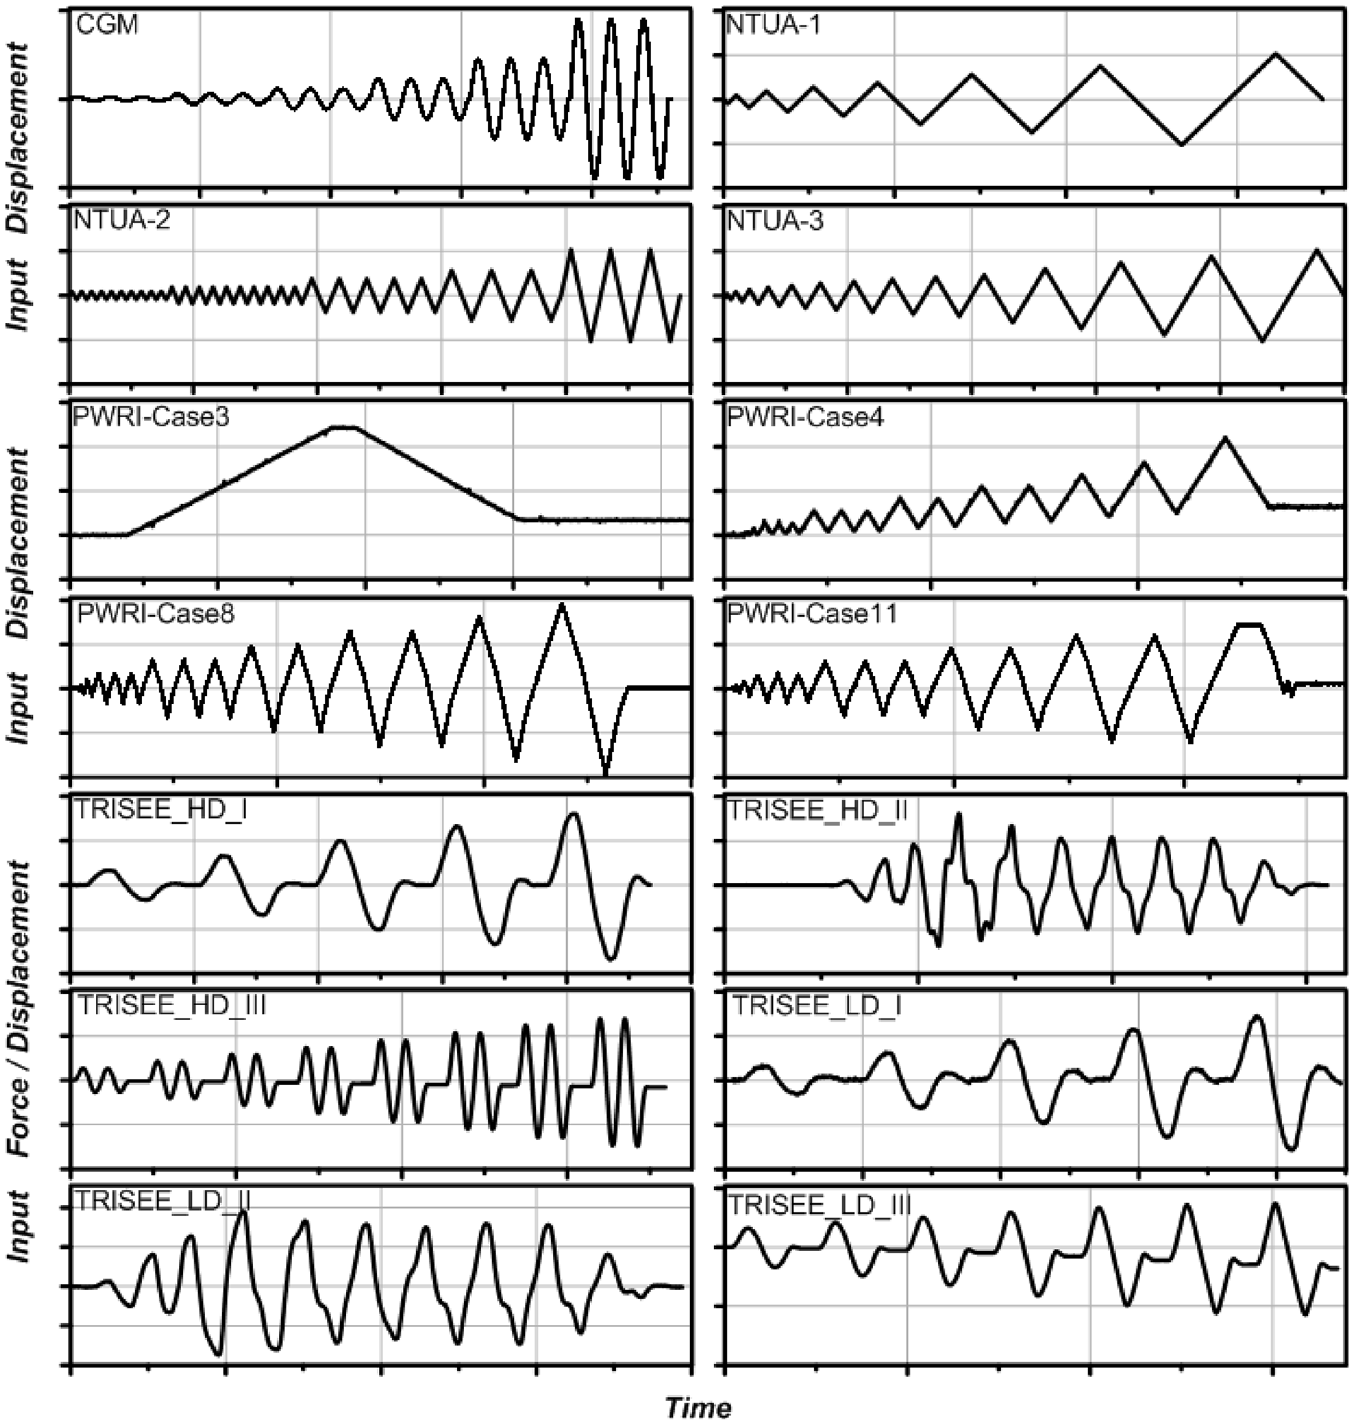
FoRCy: example loading protocols.
NTUA, PWRI, and TRISEE used a variety of loading protocols. NTUA-2 consists of 31 cycles, divided into 5 packets, and each packet contains a different number of cycles; similarly, PWRI-Case8 had two packets of three cycles followed by three packets of two cycles. For cases such as NTUA-3 and TRISEE_LD_I, each cycle has a different amplitude, so each cycle is documented in its own packet. Most of the loadings were more or less symmetrical, except PWRI-Case3 and PWRI-Case4 that did not have complete load reversal.
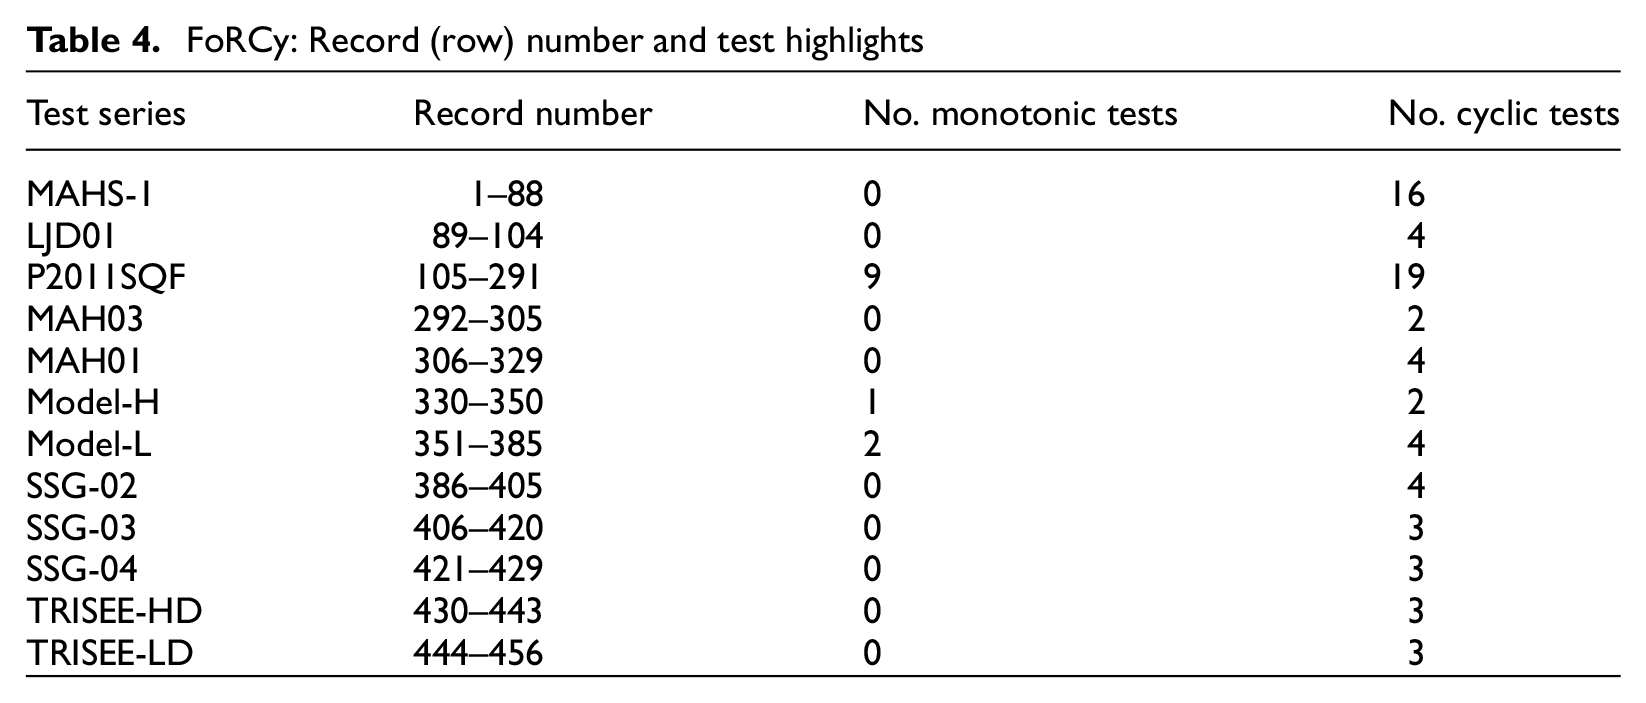
For the majority of experiments in the database, the lateral load was applied using a displacement-controlled actuator. For Phases I and II load packets performed at TRISEE (total of three load packets per HD and LD structures as shown in Table 4); however, a force-controlled actuator was used. All of the above information is documented in the database.
FoRCy: Record (row) number and test highlights
Database for cyclic rocking foundation performance
Database organization
The database was originally published through the NEES (Network for Earthquake Engineering Simulation) NEEShub website but was transferred to DataCenterHub (Hakhamaneshi et al., 2019, https://datacenterhub.org/resources/forcy). At the time of submission of this paper, the database is accessible to the collaborators on the project. After publication, the database will also be made public. There are 456 records (rows) of information in the FoRCy database. Each record represents one event; an event is meant to contain data from a single packet of cycles; however, some tests are not broken down into packets, and one event may contain many packets of cycles. As an example, if a test series contains three slow-cyclic tests and each test contains five packets of different amplitudes, then the test series should fill 15 records (rows of data) in the database. Each monotonic test occupies a single record. The database event breakdown is summarized in Table 4, which indicates the location/order of each test within the database; the table also highlights the number of cyclic and monotonic tests used within each test series.
Time history and deformation plots
One of the key goals of the FoRCy database is to share time history data using normalized parameters to facilitate comparisons across data sets. There are two columns in the database dedicated to time history files. Loading Protocol files include time and input displacement/force amplitude. Foundation Response Time History files include time, normalized shear force (V/Pst), normalized moment (2M/PstL), normalized footing settlement (s/L), normalized sliding (u/L), and footing rotation (θ) reported in radians (refer to Figure 7).
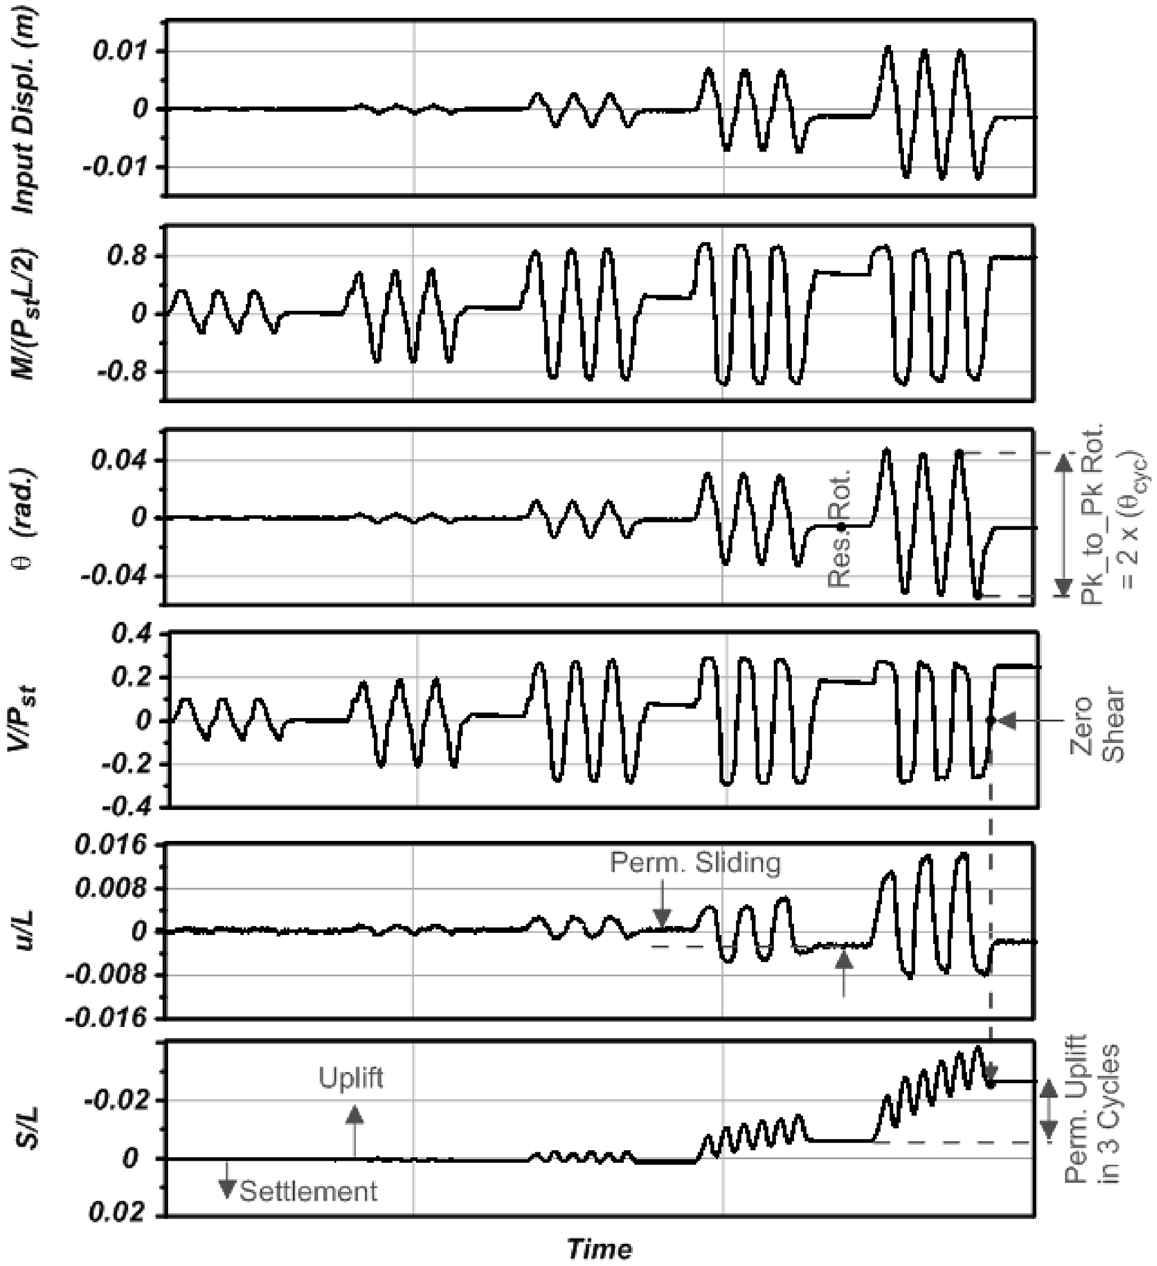
Example FoRCy input and response time history including definition of response parameters.
It should be noted that downward movement of the footing is reported as positive settlement and the axial load is defined positive in compression, even though the coordinate system defines z in the upward direction. Figure 7 shows an example time history plot for five packets of one experiment (MAHS Test Series, L/B = 7, A/Ac = 8.2, FSv_a = 8.1, M/VL = 1.57). The corresponding time history data are archived in ASCII files for every record in the database. The maximum footing moment, permanent settlement per packet, permanent sliding, peak-to-peak rotation, and residual rotation (defined in Figure 7) are documented in the database for each loading packet.
Footing shear normalized by axial load (V/Pst) also shows an accumulation of large shear in the larger packets (peak-to-peak rotation of greater than 6% radians), almost identical in shape to the normalized moment time history. The large accumulation of moment in the system (up to 0.8 PstL/2) is therefore largely controlled by the large accumulation of shear forces because the M = Vh + PstΔ, and PstΔ is small compared to Vh. Due to the buildup of residual shear and moment in the footing despite the fact that each packet ends with near zero total displacement (see Figure 7a), significant residual sliding in one direction may be offset by a residual rotation in the opposite direction. Hence, the residual moments and shears tend to be most obvious in displacement-controlled experiments where sliding accumulates.
The footing settlement time history shows accumulation of footing uplift (upward footing movement) in Figure 7. The specific time history presented in Figure 7 was for an initially embedded very long footing (L/B = 7, A/Ac = 8.2) with a large initial A/Ac. These combined effects lead to a large gap under the uplifting footing and a large perimeter for sand to fall into the gap; hence, residual uplift is substantial (about 3% of footing length). The plot denotes the residual uplift attained in the last packet of cycles. Although different methods can be used to determine the residual settlement/uplift of a footing (at point of zero shear, zero moment, or local minima), for consistency purposes, this database uses the point of zero shear (see to Figure 7) to determine residual deformations for each packet.
Processed plots of moment-rotation, shear-sliding, settlement-sliding, and settlement-rotation, similar to the example shown in Figure 8 are archived for every record in the database. Figure 8 was obtained from the same data that are shown in Figure 7. For small rotations, the moment-rotation behavior (Figure 8a) shows a stiff response and as the cumulative rotation increases, this relationship becomes nonlinear, the rotational stiffness degrades. The nonlinearity is affected by the rounding of the soil beneath the rocking footing and the local bearing failure along the moving contact interface. The moment capacity (Mfc) undergoes very small degradation at very large rotation amplitudes (larger than 4%). The area enclosed in the M–θ hysteretic loops indicates the amount of energy dissipation through rocking at the soil-footing interface. The shear force-sliding response (Figure 8b) is nearly rigid-plastic, with negligible degradation in horizontal load capacity and stiffness. The area enclosed within the shear force-sliding hysteresis loops represents the energy dissipated through the sliding mode. Figure 8c shows permanent uplift (negative settlement) of the foundation in three cycles of similar rotation amplitude (with respect to point of zero shear). The cyclic permanent settlement was calculated by dividing the total permanent settlement by three. The amount of permanent settlement at the point of zero shear is denoted in Figure 8b to d. The zero-shear point is identified in the force-sliding plot (Figure 8b) and then superimposed into the settlement-sliding plot (Figure 8d).
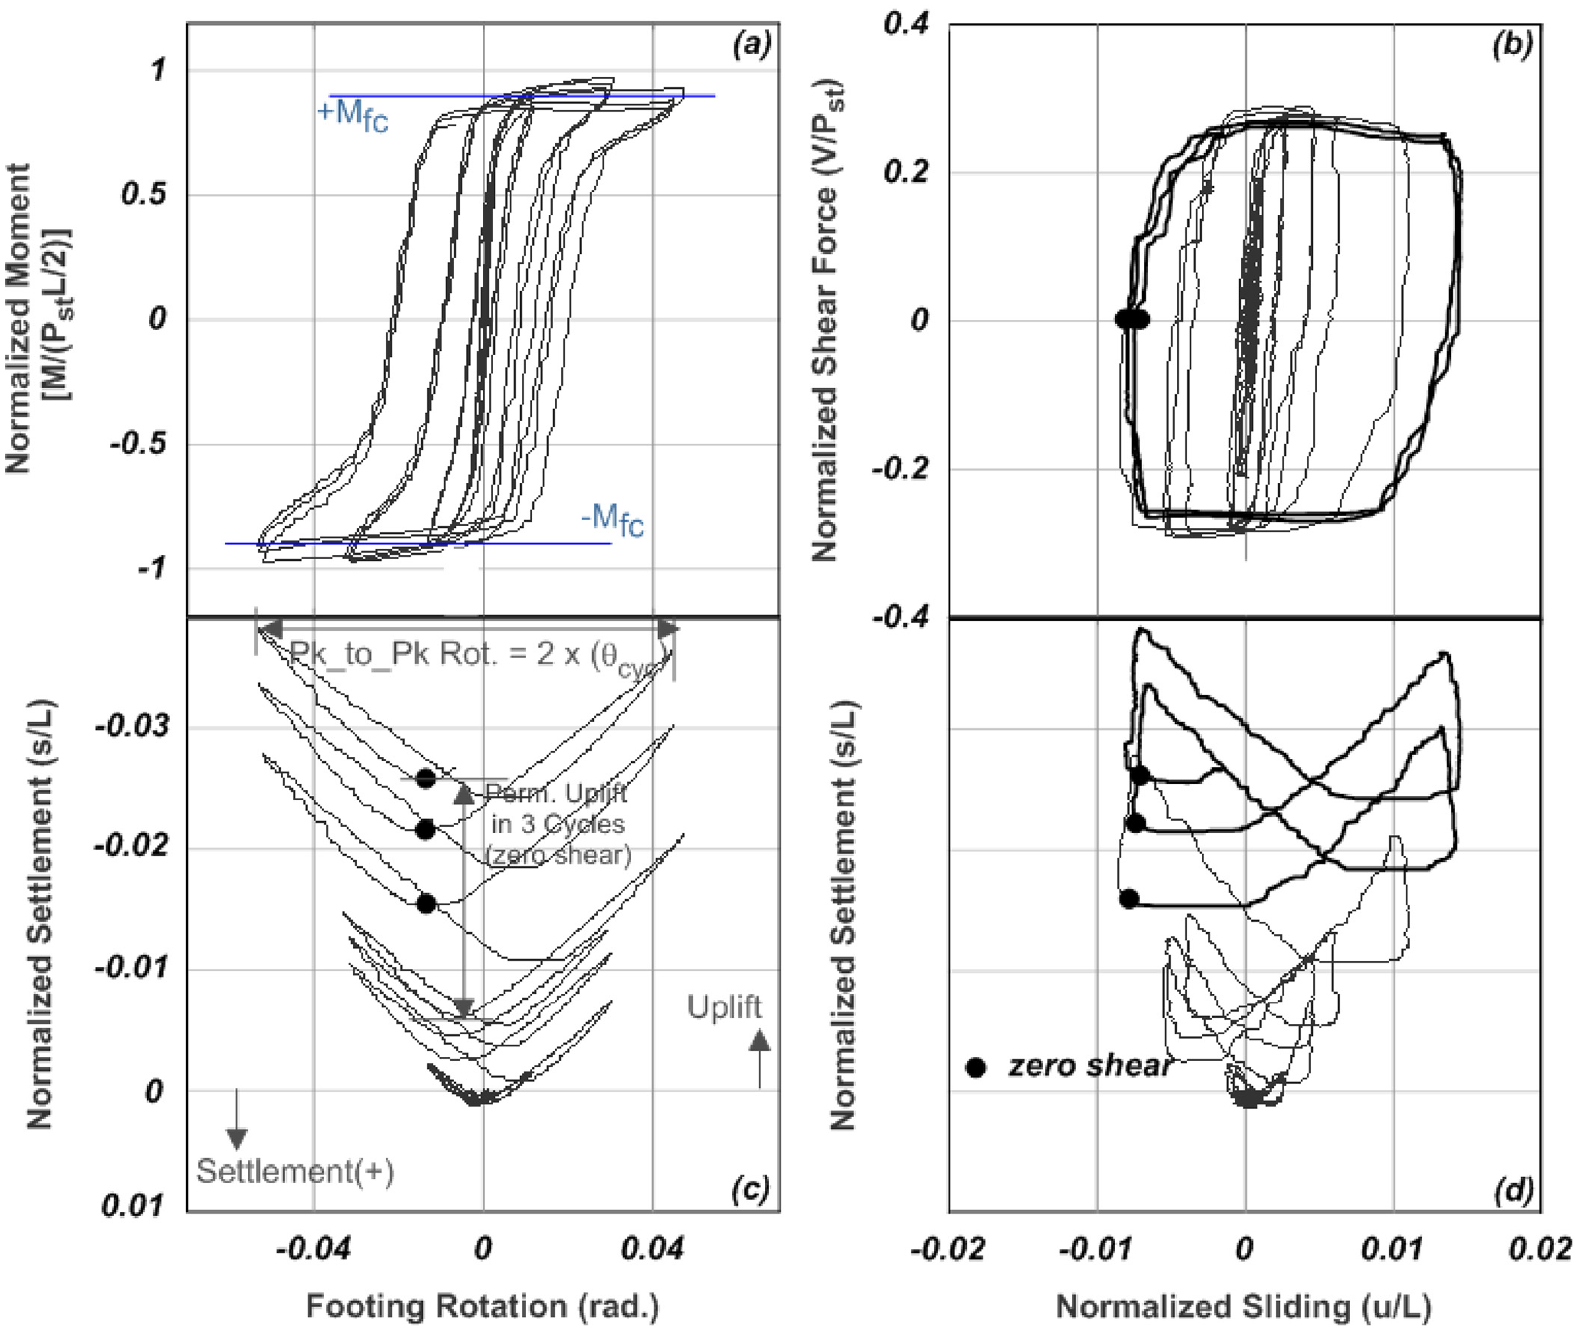
Example of key normalized force-deformation plots for a rocking foundation test (a) Moment versus rotation, (b) Shear Force versus sliding displacement, (c) settlement versus rotation, and (d) settlement versus sliding displacement.
Online database interaction
FoRCy uses the DataCenterHub Datastore tool (Hakhamaneshi et al., 2016, https://nees.org/resources/databases). The tool allows data contributors to assemble all of the data in a spreadsheet and then upload and convert it to a sortable, searchable online database. The data are organized and presented in tabular format in the default DataCenterHub dataview. The online database site includes a cover page with a description of the project and “Resource” page which is essentially the entry point for database users. After accessing the data using “View Data,” each column can be used as a filter to help the user find data sets that fit search criteria. The entire database can also be downloaded as a .csv file for further analysis in a spreadsheet environment.
Database curation and limitations
The reported values in the database were initially reported by test researchers and then checked primarily by the first author for consistency. Project and facility information, scaling factors, footing, soil and structural properties were checked against the available data reports, published papers, and project websites, when available. The time history data files were plotted and compared against the similar plots provided by the researchers and the available published reports. The values reported by researchers in the Results section were compared against the available time history data files. It must be noted that methods used to determine the A/Ac and FSv vary to some extent across test series. The differences between the methods were considered acceptable, given their key assumptions are based on available literature and consistent with their published reports. Details of methods used by each researcher to determine footing capacities is also archived in the database.
It should be noted that footing rotation and other important quantities such as moment, shear, settlement, and sliding are typically calculated by processing data from multiple sensors in an experiment. For example, the rotation is obtained from the difference between the displacement from one sensor and the displacement of another divided by the distance between the sensors; this calculation process was not checked as part of the curation; the principal investigators of each experiment are responsible for the correctness of these calculations.
The database allowed for reporting of variability associated with soil density and shear strength; it does not, however, account for variability in key performance results such as rotation, settlement, and moment. Users of the data are highly encouraged to carefully read the corresponding data reports and avoid speculations that might lead to overgeneralized conclusions driven from the database.
How to cite this work
The relatively recent phenomenon of publishing databases raises the issue of how the researchers should be credited for their contributions to this project. It is suggested that researchers using the database refer to the present data paper, and the database itself (Hakhamaneshi et al., 2019). If a future work heavily relies upon a small subset of the experimental data in the database (i.e. data from one or two test series), it is strongly recommended that in addition to above citations, the individuals that produced that subset of the data should also be cited using the citation(s) listed in the database.
Performance evaluations using the database
In this section, we will elaborate on two example uses of data in FoRCy that illustrate the value of being able to compare large quantities of data from diverse sources.
Normalized maximum mobilized moment
The backbone curves from the cyclic moment-rotation loops are presented in Figure 9. Normalized maximum mobilized moment is defined as the maximum footing moment mobilized in a load packet, divided by the static rocking moment capacity (Mfc). As it became apparent in the example of Figure 8, the footing moment gradually increases with an increase in the amplitude of footing rotation. The moment capacity does not degrade significantly for larger rotations. Figure 9 plots results from all of the data records grouped according to their A/Ac ratio. The symbols in Figure 9 distinguish the footing embedment (embedded vs surface), soil type (sand vs clay), and testing equipment (1g vs Ng).
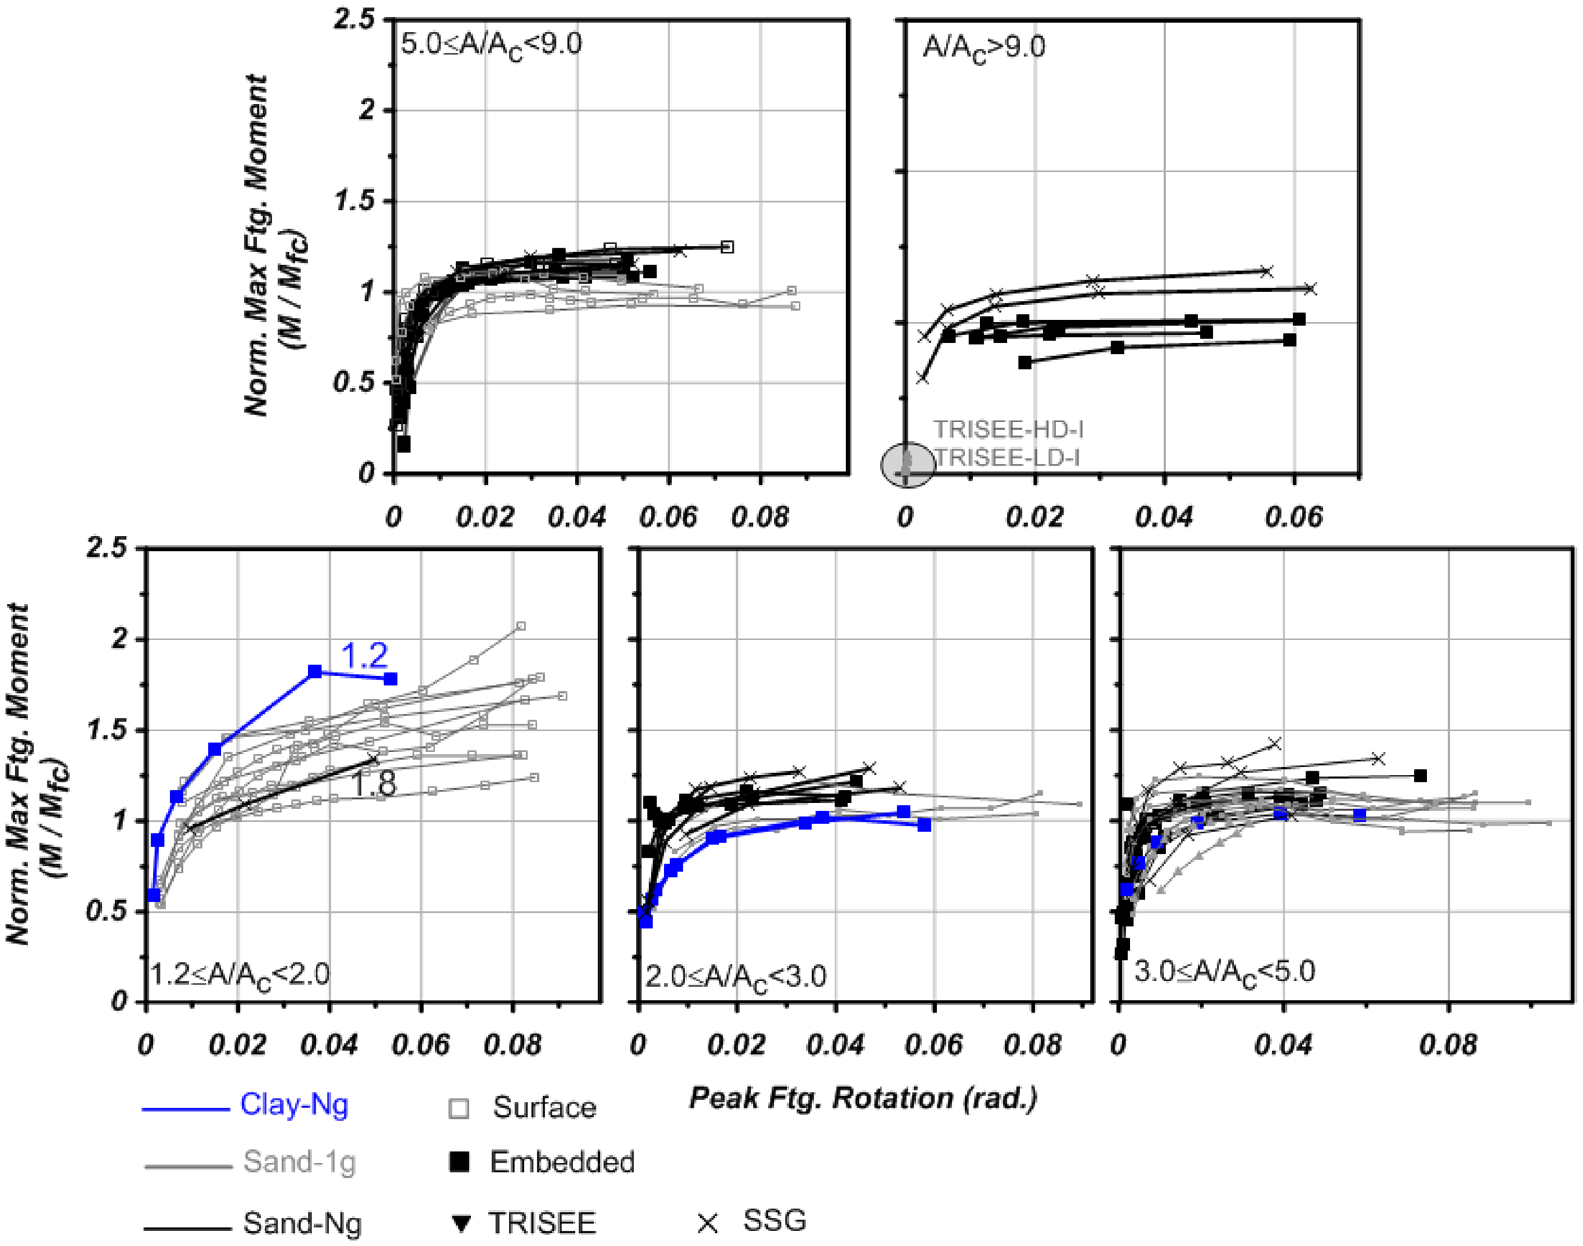
Backbone curves from cyclic tests. Normalized peak moment in a load packet versus peak footing rotation in that packet.
The normalized mobilized moment exceeds a value of 1 (footing moment demand is larger than the footing estimated initial rocking capacity) in many cases, especially for heavily loaded (small A/Ac ratio) footings. Heavily loaded surface footings tend to settle during cyclic loading; as they settle, embedment increases, which increases the bearing capacity and hence the moment capacity. Another reason why the mobilized moment may exceed the calculated moment capacity is that embedment allows side friction and passive pressures on the sides of the footing to contribute to the moment resistance, whereas the calculation of Mfc ignores these effects. The amount of increase is greatest for heavily loaded surface footings in the 1g tests (see unfilled squares on the graph for A/Ac < 2); these footings are expected to settle and embed themselves more. On the contrary, lightly loaded (large A/Ac) footings that are embedded may uplift during cyclic loading and experience a small reduction in capacity; some results in the top right graph (A/Ac > 9) filled squares show a small reduction in moment capacity.
The centrifuge tests on clay and sand (A/Ac = 1.2 and 1.8) also exhibit footing moment exceeding their initial estimate of rocking moment capacity. The uncertainty associated with estimation of A/Ac propagates to the estimation of moment capacity; this uncertainty is larger when A/Ac is small (refer to Equation 1). As an example, for a system of fixed axial load and footing length, if the estimate of A/Ac changes from 1.2 to 2, the corresponding change in moment capacity will change by a factor of 3. Therefore, one explanation for the measured moment to significantly exceed the calculated moment capacity is associated with the larger level of uncertainty in the estimation of rocking capacity at small A/Ac ratios.
The centrifuge and 1g data points show less variability when A/Ac > 2. For this category and similar peak footing rotation demand values, the different loading protocols seem to have small effect on the resulting maximum moment demands. The clay data points also show reasonably good similarity with the dry sand data points of similar A/Ac ratio. The TRISEE HD-I and LD-I tests (shown in gray triangles in Figure 9) undergo very small rotation values (peak footing rotation of 0.04% radians) and therefore experience very small moment demand values.
Although there is variability in the cyclic rotation amplitude required to mobilize the moment capacity, as long as A/Ac > 2, it appears that most footings seem to have mobilized their rocking capacity at a rotation amplitude of about 0.01. Deng and Kutter (2012) also reported a value of 0.01 radians to mobilize the moment capacity of rectangle-shaped footings. One may intuitively expect that the rotation to mobilize capacity might be a function of the footing size or A/Ac; however, it is not possible to see either trend in this data set. Hakhamaneshi and Kutter (2016) observed that H-shaped footings, loaded in their strong direction do mobilize their moment capacity at smaller rotation.
Footing settlement/uplift
Foundation settlement (or uplift) is a detrimental consequence of rocking. Hakhamaneshi and Kutter (2016), Hakhamaneshi et al. (2016), and Deng and Kutter (2012) summarized rocking foundation settlements associated with different A/Ac ratios. They correlated footing settlement with respect to the footing cumulative rotation. The cumulative footing rotation for each packet is defined by Deng and Kutter (2012) as the summation of absolute values of local maxima and minima in a rotation time history for cycles exceeding a threshold rotation, for cycles smaller than this threshold, they suggested that negligible settlements would accumulate. Deng et al. (2012) suggested a threshold of 0.001 radians. Hakhamaneshi et al. (2016) confirmed that this threshold was reasonable.
Figure 10 correlates normalized cumulative settlement to cumulative rotation for all packets of data available in the FoRCy database (excluding monotonic tests). Similar to Figure 9, the data are binned according to their A/Ac values with the bottom-left plot having the smallest and the top right plots the largest A/Ac.
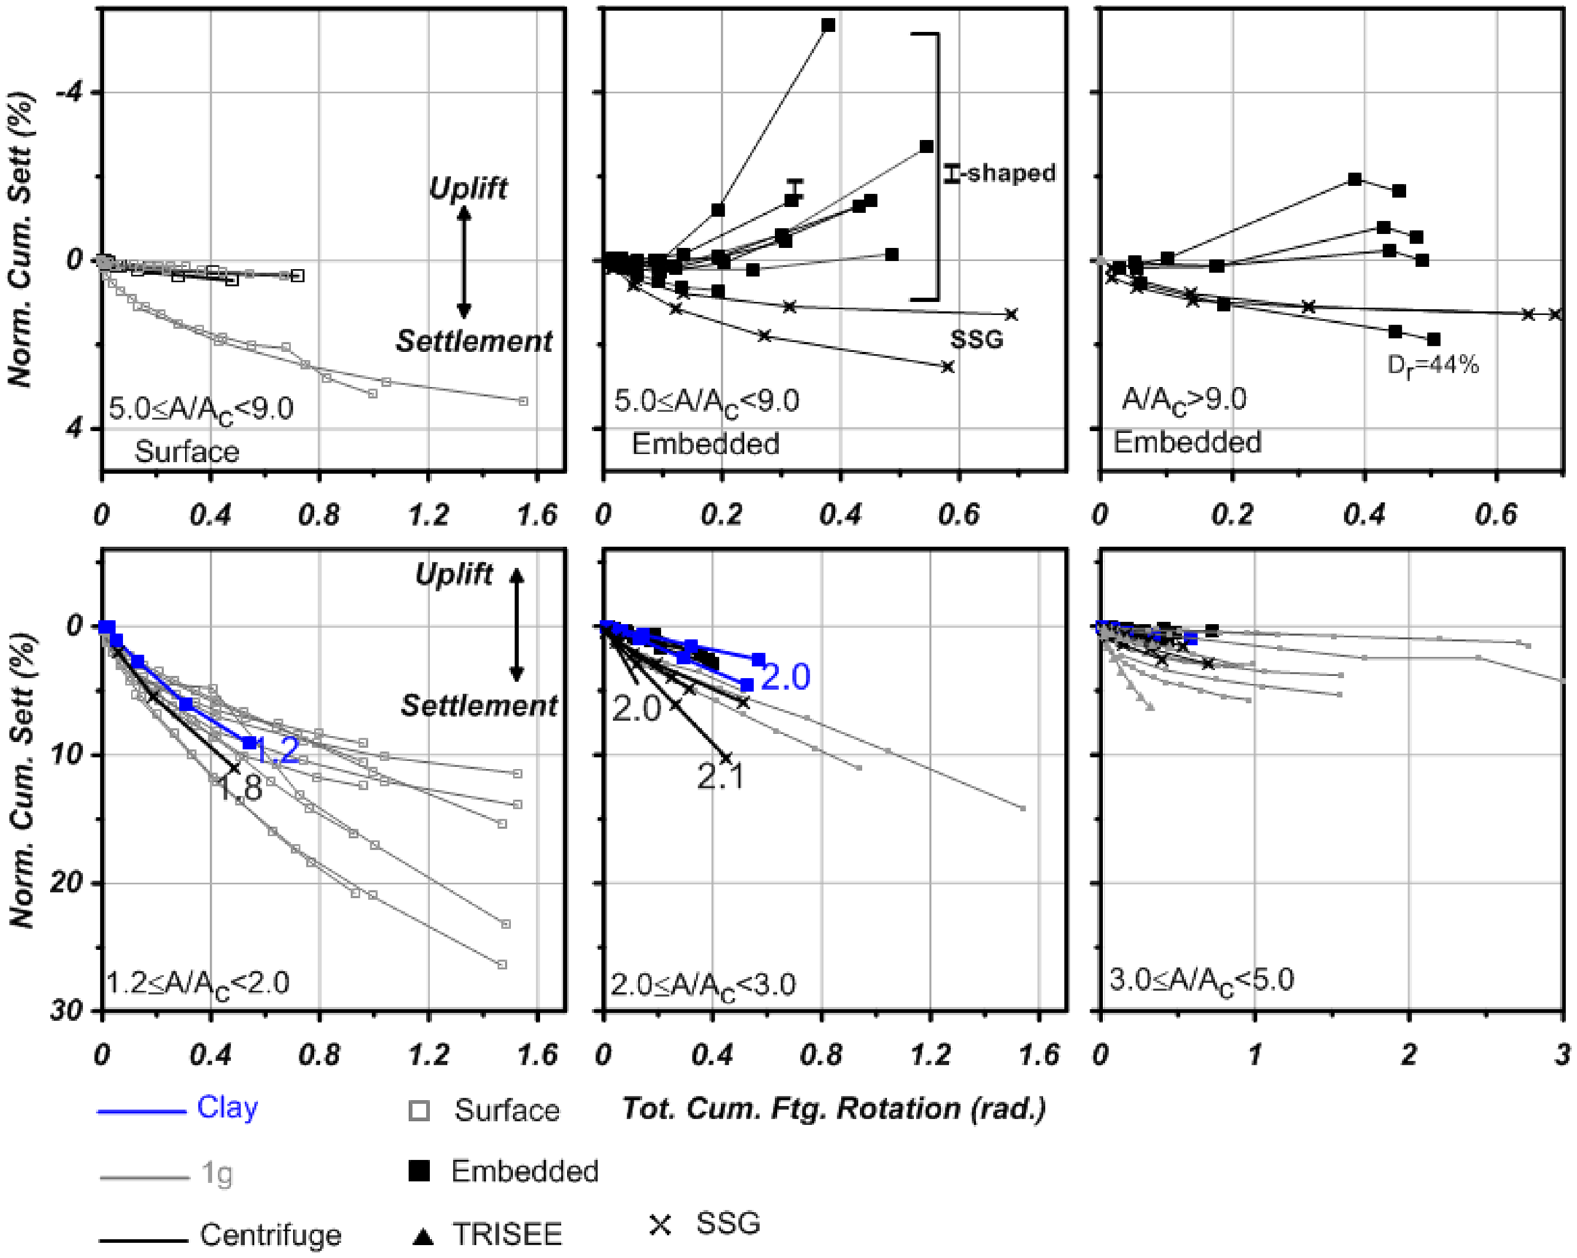
Normalized footing settlement (and uplift) versus the total cumulative footing rotation.
The bottom-left plot for heavily loaded footings shows relatively large settlements, up to 10% of the footing length at a total cumulative rotation of about 0.6 radians for the centrifuge tests, and settlements up to 25% of footing length at a total cumulative rotation of 1.5 radians for 1g testing. Again, the results for sand and clay are reasonably consistent with each other. Heavily loaded (small A/Ac) surface footings settle due to rocking and lightly loaded, embedded footings uplift as a function of the cumulative rocking rotation. As it may be expected, the surface footings did not exhibit residual uplift. Hakhamaneshi and Kutter (2016) studied the effect of footing shape on footing uplift and reported an increase in uplift for I-shaped footings (these results correspond to the curves with the largest uplift in the top-middle plot). The SSG data points (shown by symbol x) in the top-middle plot exhibit footing settlement while other footings undergo footing uplift. The moist sand condition present in the SSG test series, adds cohesion to the sand and prevent sand falling into the gap opened during rocking. The SSG data points exhibit similar behavior when A/Ac > 9; in this plot, one test series (LJD01) also exhibits footing settlement. The relative density of the sand for this LJD01 test was only 44% and a relatively light mass was used to achieve a large initial A/Ac. Although A/Ac is large for this case (small required contact area) and sand is expected to fall into the gap produced due to rocking, the compaction of the loose sand may counteract the uplift mechanism.
Conclusion
A database of foundation rocking performance during monotonic and cyclic loading (FoRCy) is shared publicly through the DataCenterHub Databases platform. This article presents a summary of the database, explains key database columns, test series and their objectives, database organization, and provides examples of how the data can be used for further analysis. The current database includes data from seven centrifuge test series and three 1g test series. The normalized moment to shear ratios (M/VL) reported in this article (and database) are near or greater than 1 (i.e. rocking-dominated condition).
The overarching reason for developing this database was to archive the important information from many experiments in a form that allows users of the data to conveniently understand and compare the results. Having all of this information in one place allows us to begin to understand the uncertainty, reliability, consistency, and accuracy of the experiments. It is problematic to figure these things out from a single independent test program. Some systematic errors are overcome by comparing results from different test equipment and different research groups, and the larger than usual amount of information in one place should allow researchers to see new patterns that emerge or disappear and to give researchers greater confidence in trends that are consistent.
To demonstrate the utility of the database, two performance measures (mobilized moment and footing settlement) were examined. Footing settlement and uplift are found to depend on the A/Ac ratio, soil type, footing embedment, and cumulative footing rotation. Initially embedded footings of large A/Ac are found to undergo footing uplift, while surface footings of smaller A/Ac settle. The maximum mobilized footing moment is correlated to the amplitude of the cyclic footing rotation; interestingly, it appears that the cyclic rotation required to mobilize the moment capacity is approximately 0.01 radians for rectangular footings with A/Ac > 2, irrespective of the L/B ratio of rectangular footings.
Footnotes
Acknowledgements
The authors gratefully acknowledge the help of the staff at different testing facilities that has led to the generation of the test series data. The authors would also like to thank the suggestions and contributions of Sashi K. Kunnath, Tara C. Hutchinson, Ross W. Boulanger, Mark Aschheim, Daniel Wilson, Ezio Faccioli, Paolo Negro, Panagiota Kokkali, Masahiro Shirato, and Shoichi Nakatani.
Author’s Note
Keshab Sharma is currently affiliated to BGC Engineering, Fredericton, NB, Canada.
Declaration of conflicting interests
The author(s) declared no potential conflicts of interest with respect to the research, authorship, and/or publication of this article.
Funding
The author(s) disclosed receipt of the following financial support for the research, authorship, and/or publication of this article: The experimental data presented in the database were supported by the National Science Foundation (NSF) Network for Earthquake Engineering Simulation Research (NEESR), California Department of Transportation (Caltrans), European Research Council (ERC), Public Works Research Institute (PWRI), Pacific Earthquake Engineering Research (PEER), and European Commissions. Any findings, statements, and conclusions are those of the authors and do not necessarily reflect the opinions of the sponsoring organizations listed in the database.