
Abstract
Recent studies have discussed lifeline resilience factors for industrial sectors. However, these results are derived from business surveys on hypothetical disasters or estimations based on expert opinions: this is mainly due to a lack of data from businesses that actually experienced lifeline disruptions after a disaster. Therefore, this study proposes a modeling framework to estimate the remaining proportions of production capacity after lifeline disruptions due to a disaster, called lifeline resilience factors, in different business sectors. Lifeline resilience factors are estimated using a production function based on responses from a post-disaster business survey in areas affected by the 2011 Great East Japan Earthquake. A comparative study between the manufacturing and non-manufacturing sectors was conducted to understand their relative resilience and vulnerability. The results show the varying importance of different lifeline services among sectors and are consistent with those of existing studies. These findings make a significant contribution in confirming the reliability and stability of lifeline services for post-disaster economic impact analysis.
Keywords
Introduction
Businesses and their economic functions are generally vulnerable to disasters, and their vulnerability has increased with agglomerated urban development (Baade, 2007; Webb et al., 2002). Given the increase in economic losses caused by business interruptions after a disaster, post-disaster business recovery is gaining increasing importance, which explains the need for a prompt and strategic business recovery process to reduce the time to recovery (Bruneau et al., 2003) as well to reduce the indirect losses caused by business interruptions. Business recovery refers to the process by which businesses and local economies return to stability after a disaster (Chang, 2010; Rose, 2004; Rose and Krausmann, 2013). There are several ways to define and evaluate business recovery, a measurable benchmark variable referring to production capacity. Production capacity is the maximum possible output of an industrial sector (Kajitani and Tatano, 2014; Rose et al., 1997), which can be damaged in the event of a disaster. Therefore, this is used as the index to describe the business recovery process in this research. Once the production capacity of a firm is restored to the pre-disaster level, the firm is regarded as achieving a full recovery. This research focuses only on the recovery of the supply-side of an industrial sector. The estimation of business post-disaster recovery is important as it can contribute to estimating business vulnerability, improving decision-making efficiency, and promoting sustainable communities.
Lifelines are critical and necessary resources for the optimal functioning of human life and urban areas (Corey and Deitch, 2011). When faced with electric power or water shortages, business interruptions can occur even if production facilities are not damaged. Speedy business recovery relies on integrated internal and external recovery resource support, especially in terms of lifeline systems. As such, resilient systems can help decrease failure probabilities and lead to quick recovery (Tierney and Bruneau, 2007). In other words, resilience can be measured by the functionality of infrastructure systems after an external shock, including the time it takes to return to the initial level of performance (Ayyub, 2014). Identifying the resilience of crucial lifelines is important for assessing the economic impact of disasters and reducing indirect business losses caused by post-disaster lifeline interruptions. Several studies estimate the impact of lifeline disruptions on the economy, mostly focusing on single lifeline disruption impacts, such as electricity (Rose et al., 1997), water (Chang et al., 2002), and transportation disruptions (Boarnet, 1998). In addition, studies mostly derive results from survey data based on hypothetical disasters (Kajitani and Tatano, 2009) or estimations based on expert opinions (Applied Technology Council (ATC-13), 1985; Applied Technology Council (ATC-25), 1991), due to a lack of post-disaster business recovery data. Specifically, ATC-13 (1985) investigates the impact of infrastructure disruption on economic sectors, being widely used as a reference for economic loss estimation caused by natural disasters. However, the input data of this study are based on the experience and judgment of seasoned earthquake engineers, due to a lack of earthquake damage loss and inventory data. The Disaster Research Center (DRC) at the University of Delaware (Tierney, 1997; Tierney and Dahlhamer, 1998) has conducted two business surveys to investigate the dependency of Memphis area businesses on infrastructure services under the impact of a disaster. Nevertheless, the results are limited in scope, because the survey data from Shelby County were originally based on responses from businesses without earthquake experience, while the survey data from the Los Angeles region based on the 1994 Northridge earthquake may be limited by regional differences in terms of business types, practice, or disaster preparedness. Although the restoration of lifeline services is essential to the re-opening of businesses and it is the first step for disaster recovery (Rose et al., 1997; West and Lenze, 1994), lifeline resilience is still difficult to distinguish and estimate due to the complexity of lifeline systems as well as the interdependence between infrastructures.
Lifeline resilience factor (LRF) can be defined as the remaining proportions of production capacity in the event of lifeline disruptions. It is a critical input indicator in the model for addressing the importance of each lifeline service and estimating economic losses due to lifeline disruptions (Chang et al., 2002; Rose et al., 1997). Hence, the estimation of LRFs based on real disaster data is necessary for achieving effective and efficient post-disaster recovery. In 1985, the Applied Technology Council (ATC-13, 1985) published a pioneering work that estimated the LRF (which they refer to as the importance factor) for different industrial sectors based on specialists’ opinions. These estimates have been adopted by many scholars to gage the economic impacts of lifeline disruptions (Chang et al., 2002; Rose et al., 1997). Kajitani and Tatano (2009) estimated the LRF based on questionnaires of over 700 industries in Japan, and they extended the concept of LRF to consider multiple lifeline disruptions. Their LRF showed high applicability to the case of the Great East Japan Earthquake of 2011 (Kajitani and Tatano, 2014). However, their study investigated production capacity losses only at a regional scale (prefecture level), not at an individual business scale as is done in this study.
This study contributes to the literature by estimating LRFs in an effort to quantitatively describe the economic impact of lifeline disruptions on business recovery using the 2011 Great East Japan Earthquake as a case study. In addition, recovery patterns and lifeline disruptions may change over time; hence, it is important to estimate resilience under different lifeline disruption patterns (Kajitani and Tatano, 2009). To estimate lifeline resilience and the economic impact of lifeline disruptions, this article describes production capacity recovery patterns under two types of recovery scenarios. The first scenario assumes production capacity under the impact of facility damage, which is directly related to business outputs; this is termed the production capacity recovery rate under facility damage (FPCRR). Here, facility damage refers to the non-structural damage to critical equipment or tools or supporting infrastructures that directly produce or increase the output. The facility production capacity is independent to, and not influenced by, other lifeline services’ supply status in the questionnaire. The second scenario assumes that production capacity is impacted by both lifeline system disruptions and facility damage, being termed the total production capacity and recovery rate under facility damage and lifeline disruptions (TPCRR). In this research, the estimated lifeline systems are electric power, water, and gas supply. Based on the questionnaire (Appendix 1) conducted after the 2011 Great East Japan Earthquake, business managers were required to answer questions related to when and what caused FPCRR and TPCRR to be recovered; the exact date of when the production capacity improved; which lifeline restoration improved production capacity; and the percentage of production capacity. Business recovery process data with and without the impact of lifeline disruptions were collected and production capacity recovery curves could be estimated based on this database. Then, the impact of lifeline disruptions on business recovery could be distinguished by comparing the recovery process with and without lifeline disruptions under FPCRR and TPCRR.
Based on the two recovery scenarios described, this research proposes a model to estimate LRFs based on the production function in section “Modeling LRFs.” The details of the case study area and the data set following the 2011 Great East Japan earthquake, as well as the descriptive statistics, are introduced in section “Case study and data description.” The estimation results are then calculated using the data set following the 2011 Great East Japan Earthquake and this is used to derive a set of resilience factors in different industrial sectors in section “Results of LRF estimation.” Here, production capacity recovery processes under different scenarios are estimated and compared, along with the impact of lifeline disruptions due to other factors. In addition, LRFs are estimated by establishing a production function to explain the economic impact of lifeline disruptions. A comparison is also made between the manufacturing and non-manufacturing sectors, since recovery varies depending on the resilience and vulnerability of different sectors. Finally, the last section discusses the results and concludes the article.
Modeling LRFs
The productivity of a firm is highly influenced by the inputs, including labor, capital, and lifeline services, as well as different types of intermediate inputs. The impact of each input on productivity is hard to define due to the interdependence between lifeline systems. This research separates the productivity decreases caused by lifeline disruptions by establishing two recovery scenarios to estimate the LRFs. For firms, the malfunction of lifeline services will lead to decrease in production capacity even if production facilities themselves do not suffer from damage following a disaster. Here, to assess the impact of lifeline services disruption, the production capacity of a firm is assumed to have determined by production inputs, including the labor, capital, and supply status of lifeline services. Using the separate production model as a basic form, the production function of business Y could be defined as:

where
First, we define firms’ production capacity rates before and after disaster. Here, we use subscripts to separate the production capacity and recovery scenarios before and after the disaster. The production capacity of the firm in the pre-disaster scenario is defined in Equation 1 as:
Second, to calculate the production capacity and recovery rates after disaster, two post-disaster recovery scenarios are considered. As previously mentioned, the first scenario concerns the production capacity recovery rates under the impact of only facility damage after a disaster, which means only the utility of the K function changed before and after disaster, and this is represented as FPCRR. The second scenario is the production capacity and recovery rates under the impact of both facility damage and lifeline service disruptions, where the utility of both lifeline services and capital has changed. This is represented as TPCRR.
In this case, a firm’s FPCRR can be expressed as:

TPCRR is expressed as:

To summarize, the ratio differences between FPCRR and TPCRR are primarily caused by lifeline service disruption. These ratio differences reflect the resilience of production capacity when faced with lifeline disruptions. Here, we quantitatively described the resilience of production capacity toward lifeline disruption by introducing the LRF, which is defined as

In addition, the values of the LRF,

where
To estimate the economic impact of lifeline services disruption, it is important to distinguish the impact of electrical power supply disruption, water supply disruption, and gas supply disruptions from other impact factors, as well as the interdependency between the lifeline systems themselves. The data obtained from the questionnaire survey described the recovery of facility damage and restoration of lifeline services. One possible recovery process for FPCRR and TPCRR, which used as an illustrative structure to model the LRF, is shown in Figure 1.
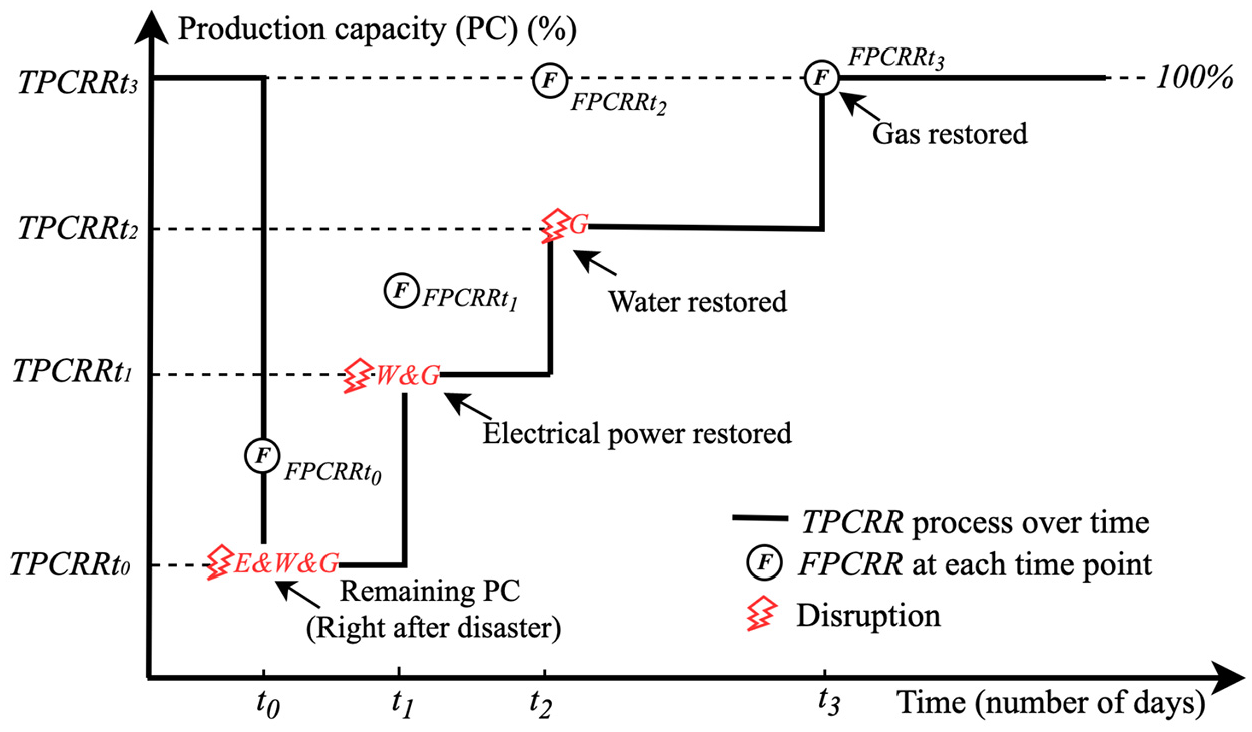
An illustrative structure for the recovery of FPCRR and TPCRR.
As shown in Figure 1, the recorded data describe the recovery of production capacity and the restoration of lifeline services. First, all lifeline services are disrupted at time t0 (the time at which a disaster occurs), and we observe the corresponding values of FPCRR and TPCRR. According to Equations 4 and 5, TPCRR equals to FPCRR times the LRF. Hence, the function between FPCRR and TPCRR at time t0 can be written as:

At time t1, the electric power supply is restored, while the water and gas supply are not. In this case, the function between FPCRR and TPCRR at time t1 can be represented as:

Then, at time t2, both the electric power supply and water supply are restored, while the gas supply is not. The function between FPCRR and TPCRR at time t2 is stated as:

As such, as shown in Equation 8, when one lifeline service is disrupted at a time, the LRF can be calculated (for example, if only gas is disrupted at t2,
Thus,

In addition, as defined previously, the utility of lifeline services on a firm’s production capacity is impacted by the availability of electricity, water, and gas. To estimate the

here,
As such, Equation 10 can be expressed as:

where

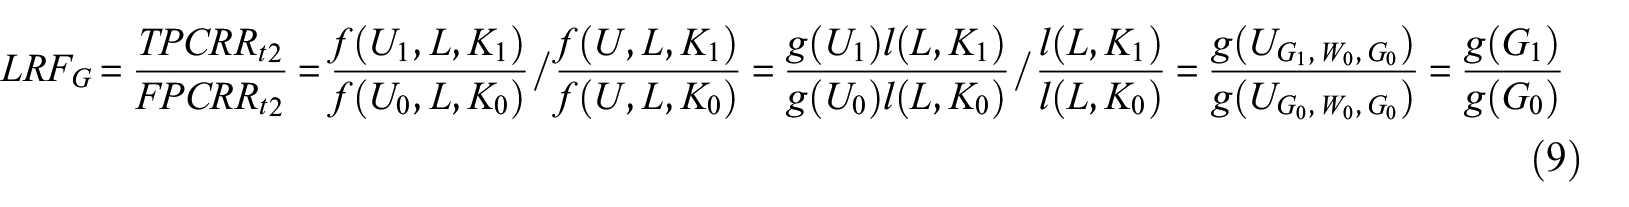
Therefore, the remaining proportions of production capacity under a gas supply disruption, defined as the gas resilience factor (LRFG), are equal to
Using the same concept, the electricity resilience factor (LRFE) and water resilience factor (LRFW) can be calculated, respectively, as follows:


It is worth noting that the coefficient β is the impact factor of lifeline services on production capacity and, as implied in Equations 13 to 15, is non-positive. Under this condition, LRFs, including LRFE,
Case study and data description
Data sources
The 2011 Great Japan Earthquake occurred at 14:46 Tokyo time on 11 March 2011, with a magnitude of 9.0. The epicenter was located at 38.322°N, 142.369°E, about 122 km from Sendai, 177 km from Fukushima, and 373 km from Tokyo.
The data come from a survey conducted by the Disaster Prevention Research Institute (DPRI) at Kyoto University and the International Institute of Disaster Science (IRIDeS) at Tohoku University from November to December 2012. The key questions for the data set used in this research are shown in Appendix 1. There were 8000 questionnaires distributed to businesses managers, 1289 random responses collected, and 434 observations analyzed after removing invalid responses (invalid responses refer to cases when firms did not suffer from damage from the earthquake or when business managers did not answer all the required questions). All the firms were located in the Tohoku and Kanto area in Japan, located in Akita, Aomori, Fukushima, Yamagata, Ibaragi, Tochigi, and Chiba prefecture to be specific. In addition, all the surveyed firms were not affected by the tsunami or nuclear disaster, but only suffered earthquake damage. The spatial distribution of businesses is mapped in Figure 2, based on address data provided by business managers.
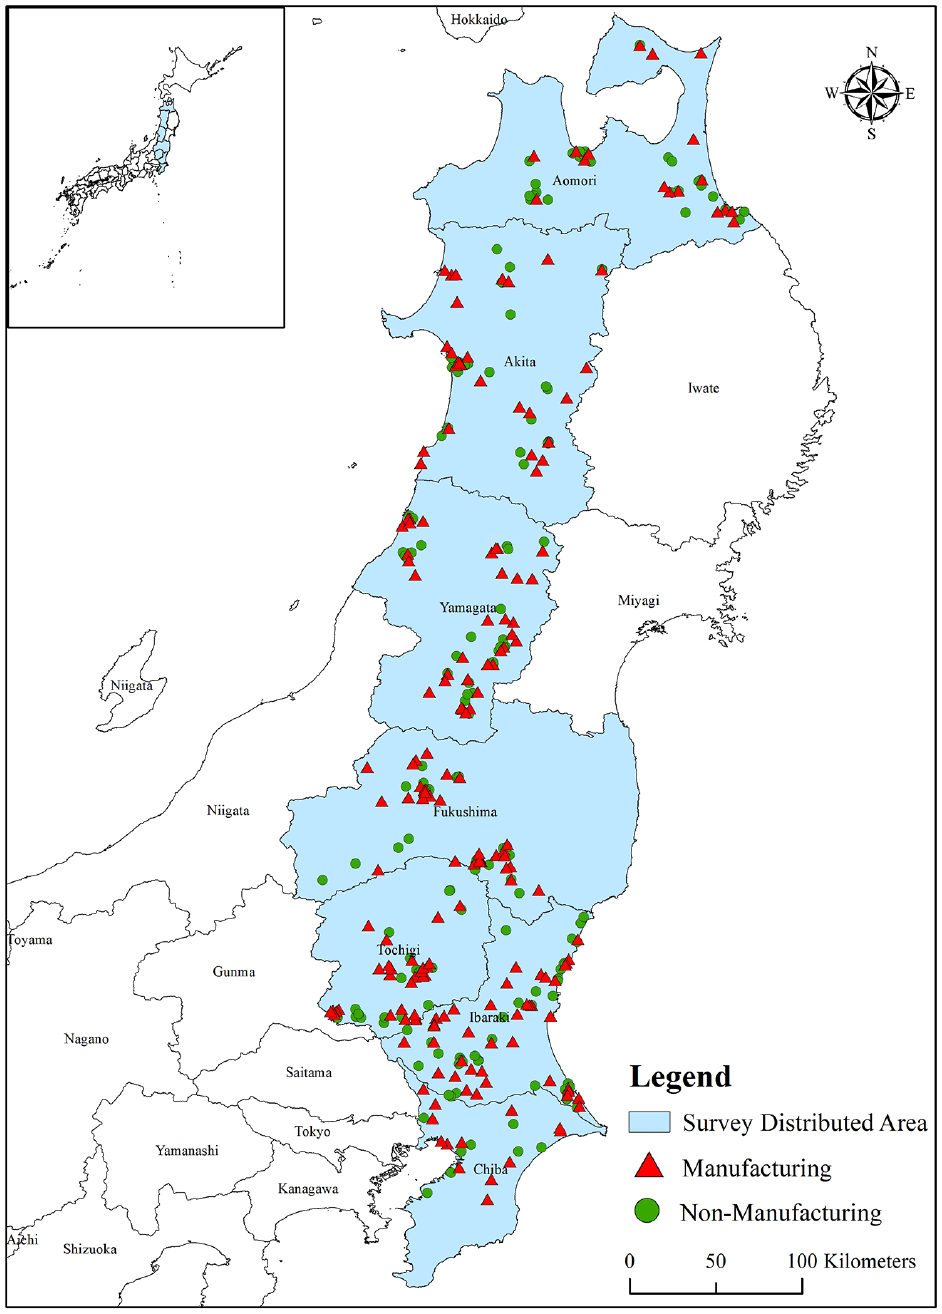
Study area and spatial distribution of firms.
Relationship between production capacity and lifelines
The industrial production index sharply declined by 15.5% after the earthquake (Okada et al., 2011) and more than 80% of businesses have suffered damage in the Tohoku and Kanto areas (Teikoku Data Bank Co., conducted in June 2011). The total property damage value, which includes residential, industry, lifelines, public infrastructure, primary industry, and other property damage, reached JPY 16,900 million (Cabinet Office, Government of Japan, 2011). Although recovery commenced immediately under the joint efforts of businesses, government, and social assistance groups, the economic impact of lifeline disruption on business recovery has not been identified and estimated yet, especially based on empirical data.
To highlight the impact of lifeline disruptions, an example of a business recovery process is described in Figure 1, assuming other lifelines functioned normally and the dynamic change in production capacity was only affected by lifeline supply status, namely, electrical power, water, and gas supplies. The economic impact of lifeline disruption refers to the reduction in production capacity caused by lifeline disruptions. Based on the survey data, the production capacity recovery under different scenarios can be used to estimate the importance of each lifeline.
Furthermore, two production capacity and recovery scenarios were established to determine the impact of lifeline disruptions. Production capacity is measured as a percentage based on data provided by business managers. The first scenario is FPCRR, which concerns the recovery rates of production capacity only under facility damage, and the second scenario is TPCRR, which calculates the total recovery rates of production capacity under both facility damage and lifeline service disruptions. Hence, the ratio difference between the two scenarios is defined as the recovery rate on production capacity under lifeline services disruption, referred to as LPCRR. Table 1 shows the relationship between the two recovery scenarios using an example and explains how to differentiate between the impacts of the various lifeline services. For example, on March 17, the FPCRR was 70% of the pre-disaster level. However,
Example of questionnaire data
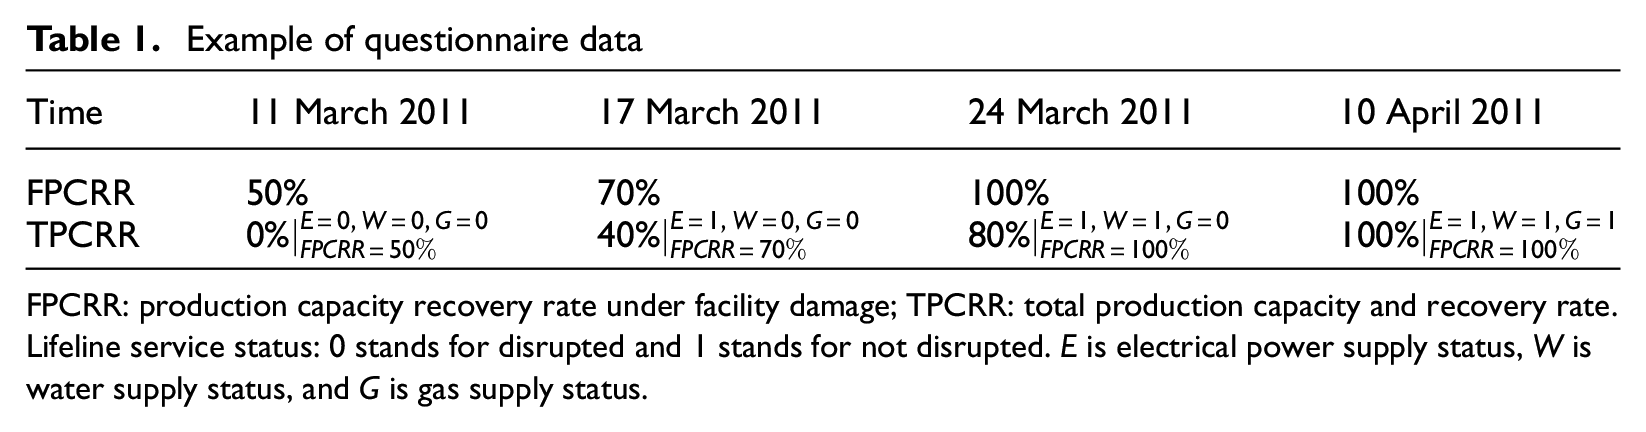
FPCRR: production capacity recovery rate under facility damage; TPCRR: total production capacity and recovery rate.
Lifeline service status: 0 stands for disrupted and 1 stands for not disrupted. E is electrical power supply status, W is water supply status, and G is gas supply status.
Descriptions of lifeline disruptions after the 2011 Great East Japan Earthquake
The survey was distributed in the Tohoku and Kanto areas, with the businesses in this study covering seven prefectures affected by the earthquake, namely, Akita, Aomori, Fukushima, Yamagata, Ibaragi, Tochigi, and Chiba. Of these, 53.2% of businesses belong to manufacturing sectors and 46.8% to non-manufacturing sectors, further being divided into eight sectors. Here, manufacturing sectors include materials, processing, and assembly, and life-related sector (including food, beverage, tobacco, feed, and textile manufacturing); non-manufacturing sectors include construction, transportation, wholesale/retail, finance, insurance, and real estate; and the service sector. A manufacturing firm located in Fukushima prefecture took 276 days to recover and experienced the longest recovery duration. These measurement variables are listed in Table 2.
Descriptive statistics of measurement variables
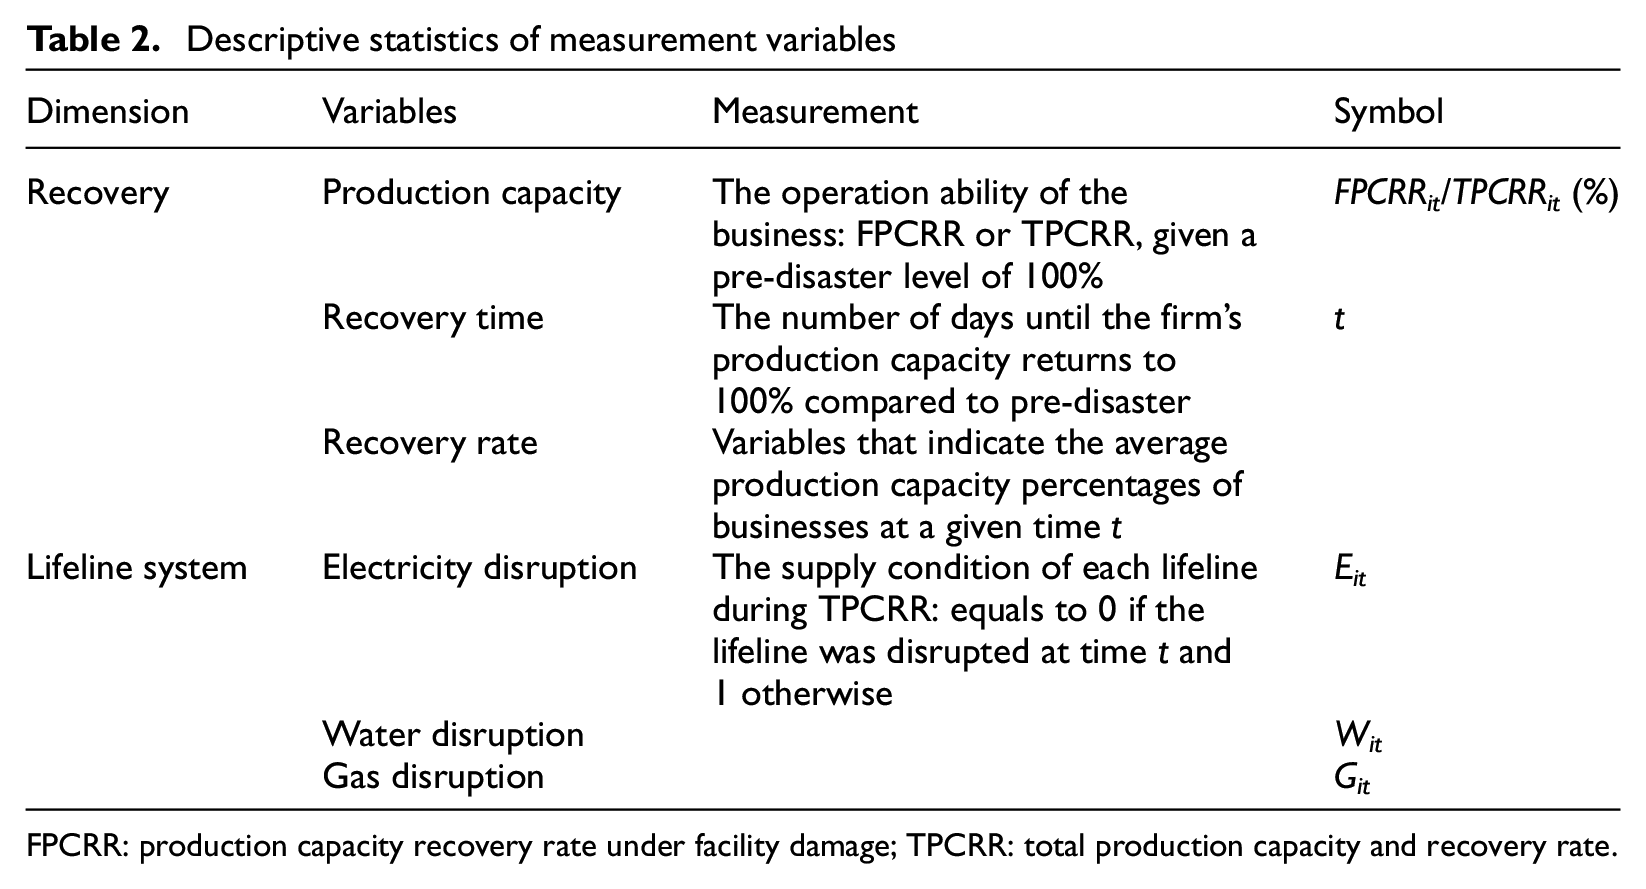
FPCRR: production capacity recovery rate under facility damage; TPCRR: total production capacity and recovery rate.
Figures 3 and 4 show the percentages of firms for which each lifeline was restored in a given time after the earthquake and the recovery rate for facilities and lifelines of all firms after the earthquake, respectively, as summarized from the questionnaire data. Figure 3 shows that of all firms, 48.9% did not suffer facility damage, 24.7% did not suffer electric power shortage, 54.4% did not suffer water supply shortage, and 67.5% did not suffer gas shortage after the earthquake. In addition, as shown in Figures 3 and 4, after 7 days, the restoration of facility, electricity, water, and gas supplies reached 65.9%, 97.5%, 91.5%, and 96.8%, respectively. Compared to the facility restoration curve, lifeline services restoration experienced a faster recovery. To return to pre-disaster production, firms were required to solve the lifeline services disruption problems owing to the indirect losses caused by lifeline disruptions after the earthquake. Therefore, lifeline service restoration after disaster is crucial for business recovery and resilience measurement is a key to a speedy recovery process.
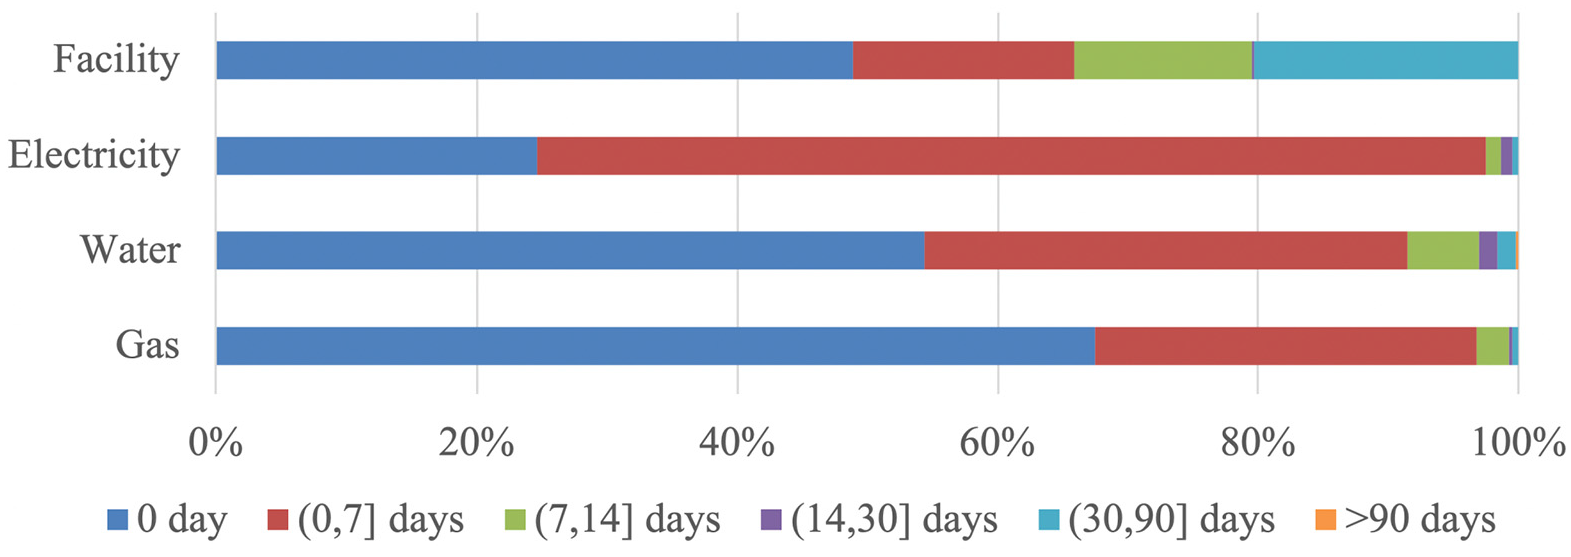
Percentages of firms for each lifeline service restored in a given time after the earthquake.
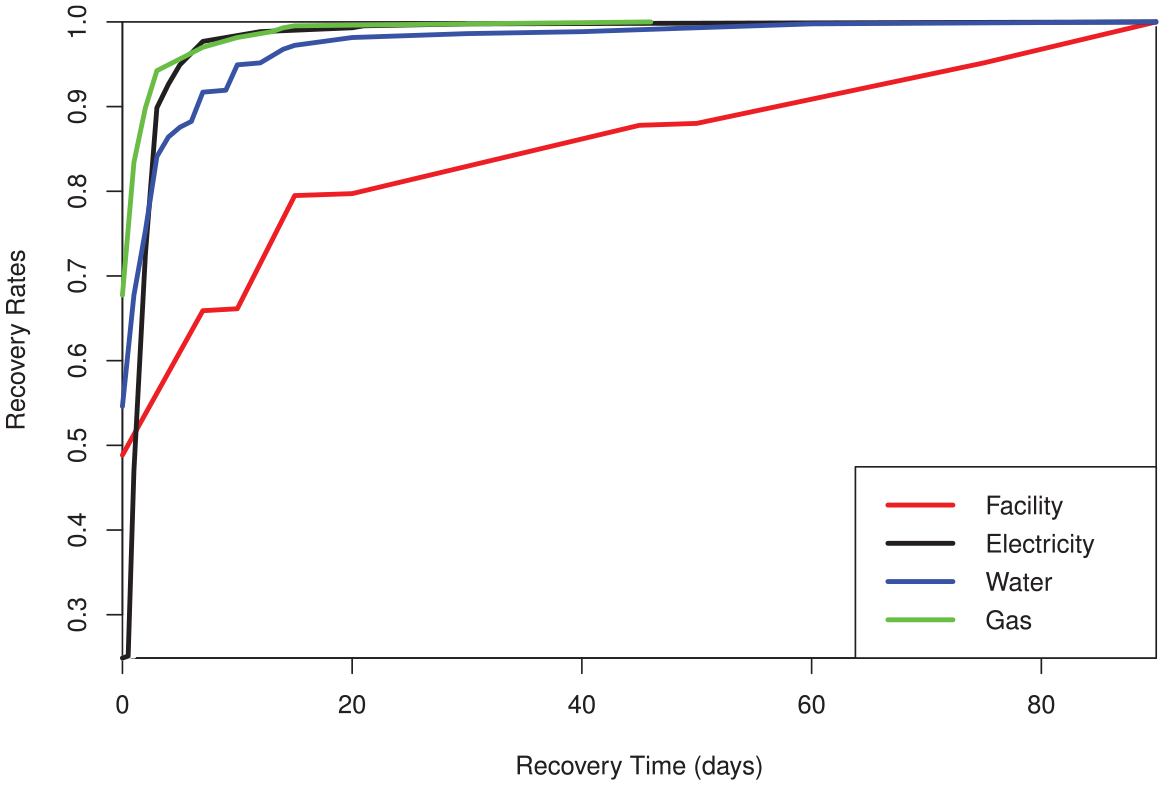
Recovery rate for facilities and lifelines processes of all firms after the earthquake.
Results of LRF estimation
To describe the proposed LRFs model, a case study based on survey data of the 2011 Great East Japan Earthquake is presented below. The recovery process curves of FPCRR and TPCRR in the manufacturing and non-manufacturing sectors are drawn according to the survey data, followed by the estimations of the LRFs.
Comparison of the recovery process with and without impact of lifeline disruptions
Next, the business recovery processes with and without the impact of lifeline disruptions are estimated. According to survey data, the average recovery process curves of FPCRR and TPCRR in the manufacturing and non-manufacturing sectors are estimated and shown in Figure 5, which also addresses the relationship between average FPCRR and average TPCRR after the 2011 Great East Japan Earthquake, showing that, in general, FPCRR experienced a faster recovery compared with TPCRR after the earthquake. The black curve is the recovery scenario of FPCRR, where the production capacity and recovery process were impacted only by facility damage. The red curve is the recovery scenario of TPCRR, where the production capacity is impacted by both facility damage and lifeline service disruptions. As for the comparison between manufacturing and non-manufacturing sectors, non-manufacturing sectors have achieved a comparatively quicker recovery. The facility damage in manufacturing sectors is also usually more severe. In terms of facility damage, 43.3% of businesses in the manufacturing sectors, while 52.6% in non-manufacturing sectors did not suffer from damage. A total of 12.1% of businesses did not suffer from damage after the earthquake, 15.8% of them being in the non-manufacturing sector. The longest recovery time for the non-manufacturing sector is 265 days, while it is 276 days for the manufacturing sector.
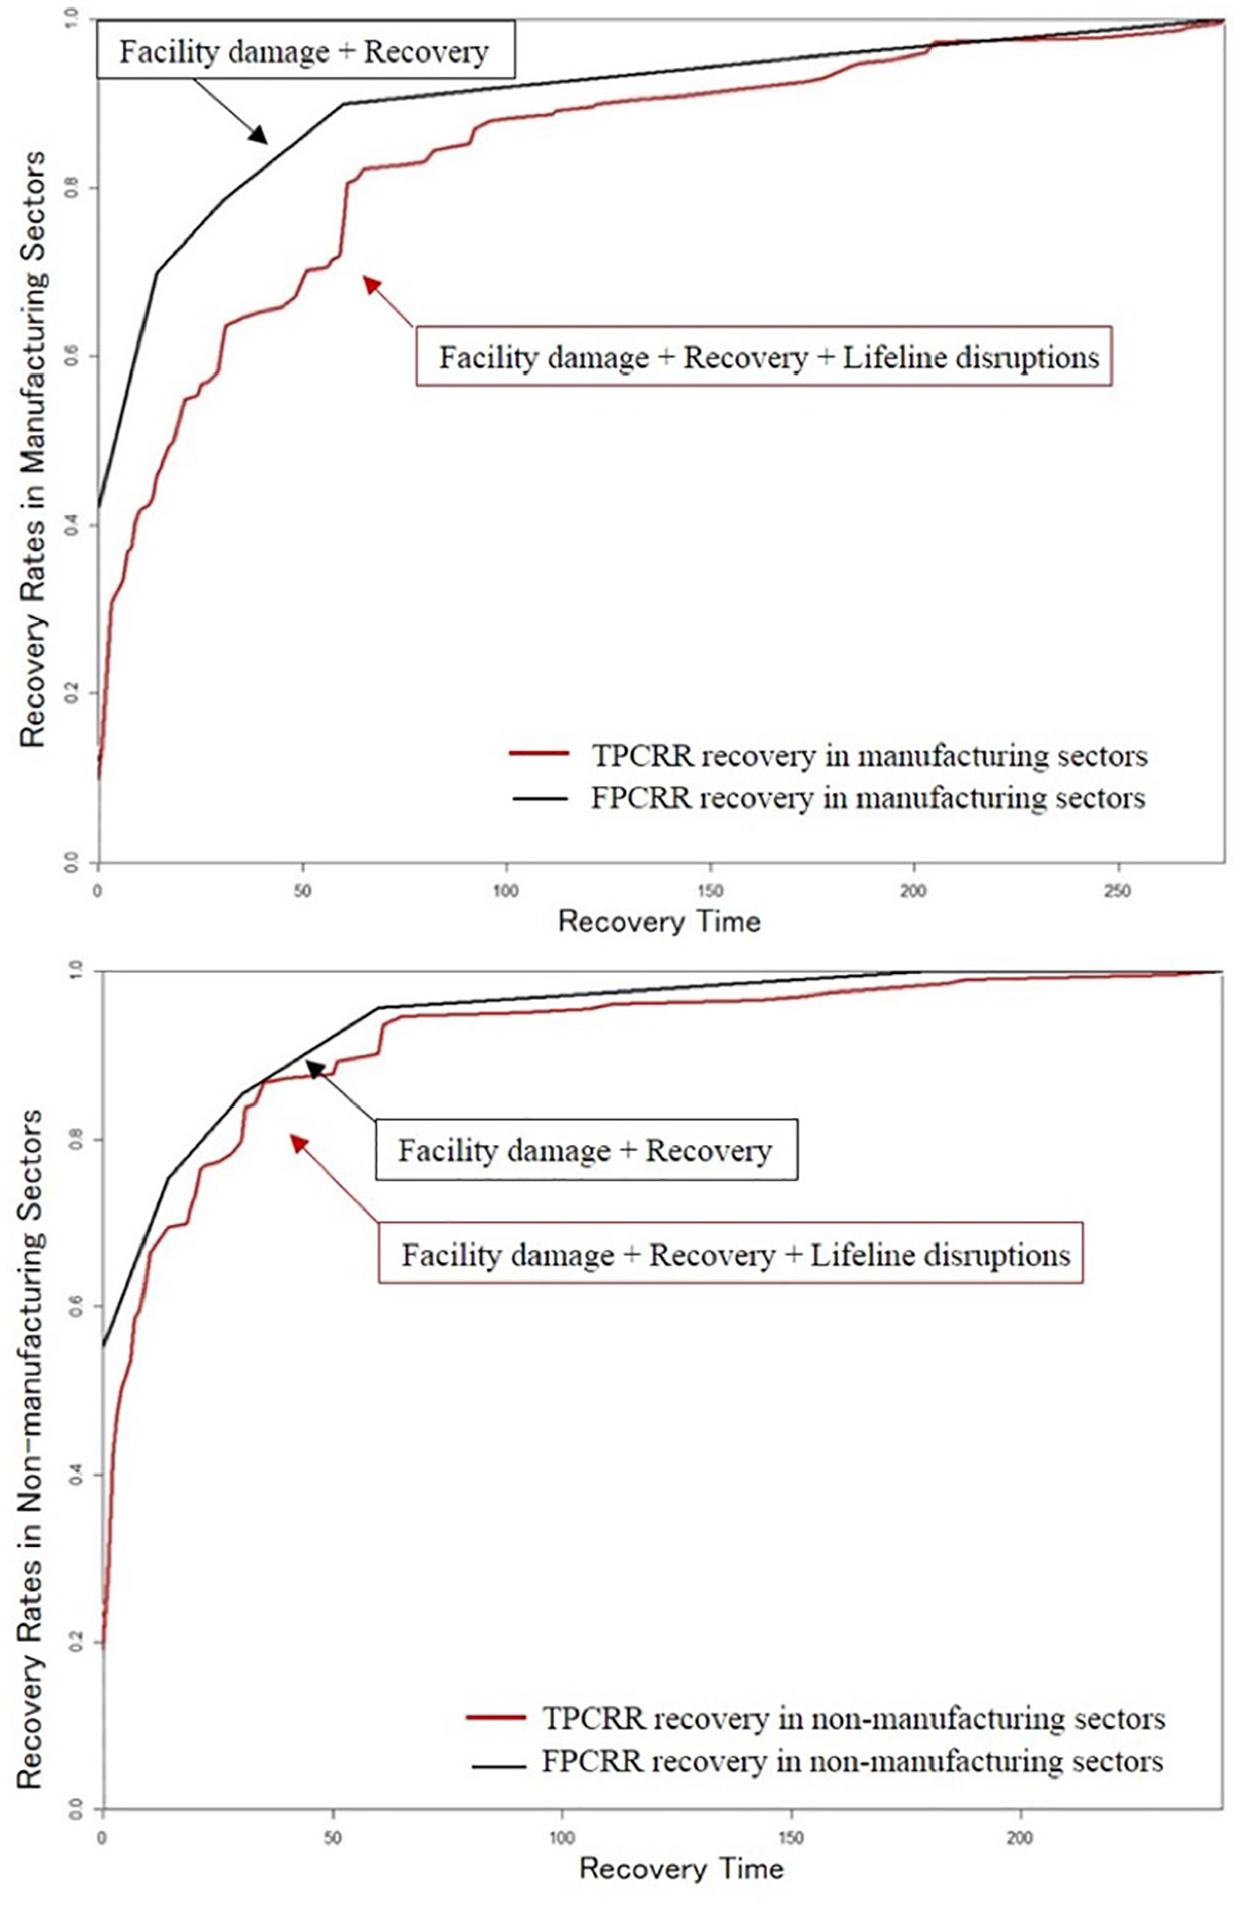
Recovery processes with and without lifeline disruptions.
Generally, FPCRR seems to have achieved a faster recovery compared to TPCRR. The two recovery processes are significantly different, with the production capacity and recovery rate differences caused by lifeline disruptions and measured by

The functions of FPCRR and TPCRR are defined in Equations 2 and 3, respectively. The values of FPCRR, TPCRR, and

However, the

By taking the logarithm of Equation 18, it is restated as:

Then, we can state the following:

Using Equations 11 to 15, we obtain:

To derive a final set of the coefficients β, this research investigated an empirical case study, with survey data obtained after the 2011 Great East Japan Earthquake. Here, FPCRR, TPCRR, ΔE, ΔW, and ΔG are answered by business managers according to the questionnaire form listed in Appendix 1. An ordinary least squares (OLS) regression is applied here to calculate the coefficients β, the result represent the mean change in the firms’ production capacity in the event of a lifeline disruption. Inputting these observed values (FPCRR, TPCRR, ΔE, ΔW, and ΔG) into Equation 21, we can estimate the average
LRFs’ estimation results
Regarding the calculation function of LRFs, the
Estimated average LRF in manufacturing and non-manufacturing sectors.
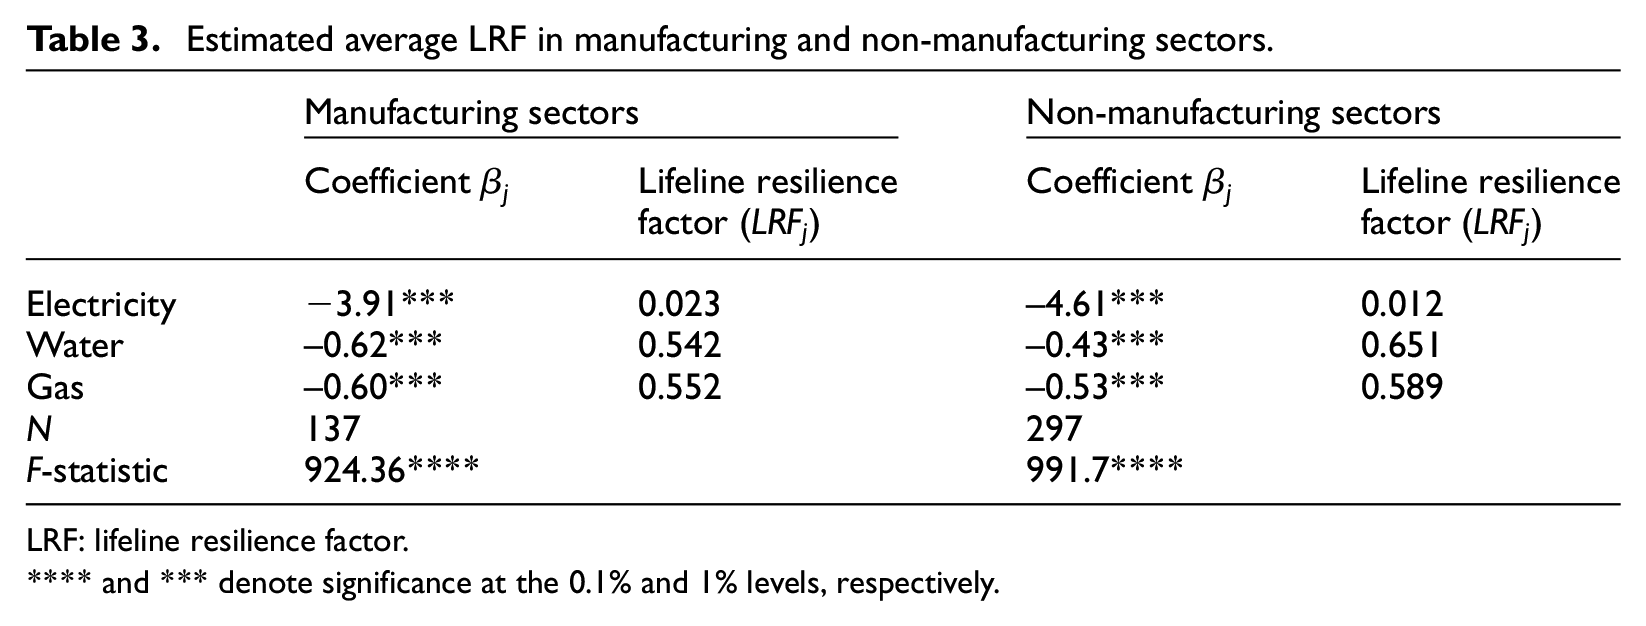
LRF: lifeline resilience factor.
**** and *** denote significance at the 0.1% and 1% levels, respectively.
In manufacturing sectors, the results indicate that the impact of electric power disruption is most severe, with a resilience factor of 0.023, which corresponds to a 97.7% loss of production capacity. For water and gas supply disruptions, the resilience factors are 0.542 and 0.552, corresponding to production capacity losses of 45.8% and 44.8%, respectively. In the non-manufacturing sector, the importance of electricity is also high, with a resilience factor of 0.012, corresponding to 98.8% production capacity losses occurring during disruptions. The resilience factors of water and gas are 0.651 and 0.589, which correspond to 34.9% and 41.1% production capacity losses under disruption, respectively. In general, the estimated results are consistent with the reality for the 2011 Great East Japan Earthquake case.
The way in which lifeline resilience varies in different sectors is also crucial for post-disaster recovery in different production mechanisms and among different sectors (Brown et al., 2015). Hence, we also estimate LRFs in different sectors and results are shown in Table 4 and Figure 6. The lifeline disruption impact on production capacity varies substantially by industrial sector because of the various vulnerabilities and resource dependencies. First, electricity supply has significant importance in all sectors, with the electricity resilience factors ranging from 0.02 to 0.06 and production capacity losses caused by electric power disruptions range from 94% to 98%. This result indicates that businesses rely a lot on stable electric supply due to the mechanization and automation of industries. Second, the role of water is more important in the processing and assembly and service sectors, followed by the materials, wholesale/retail, and transportation sectors, with resilience factors of 0.423, 0.434, 0.510, 0.515, and 0.538, respectively. Compared to other sectors, water supply has lower importance in the life-related and construction sectors. Third, gas supply also shows a significant impact on firms’ productivity, especially in the materials sector and wholesale/retail sector. The importance of gas supply is the highest in the materials sector, with a lower impact on the processing and assembly sectors. Although the coefficients for electricity in the processing and assembly sector as well as the coefficient for gas in the construction sector and finance, insurance, and real estate sector are not significant due to the limited sample size, the estimated results are consistent with the characteristics of economic systems. For example, the importance of gas supply was not significant for firms’ production capacity in the construction sector because most construction firms install gas pipelines for kitchen use only. As such, they are relatively unaffected by gas disruptions because their operations do not rely on a steady supply of gas. It is acknowledged that a larger number of data samples could contribute to obtaining results that are more robust.
Estimated average LRF in different sectors
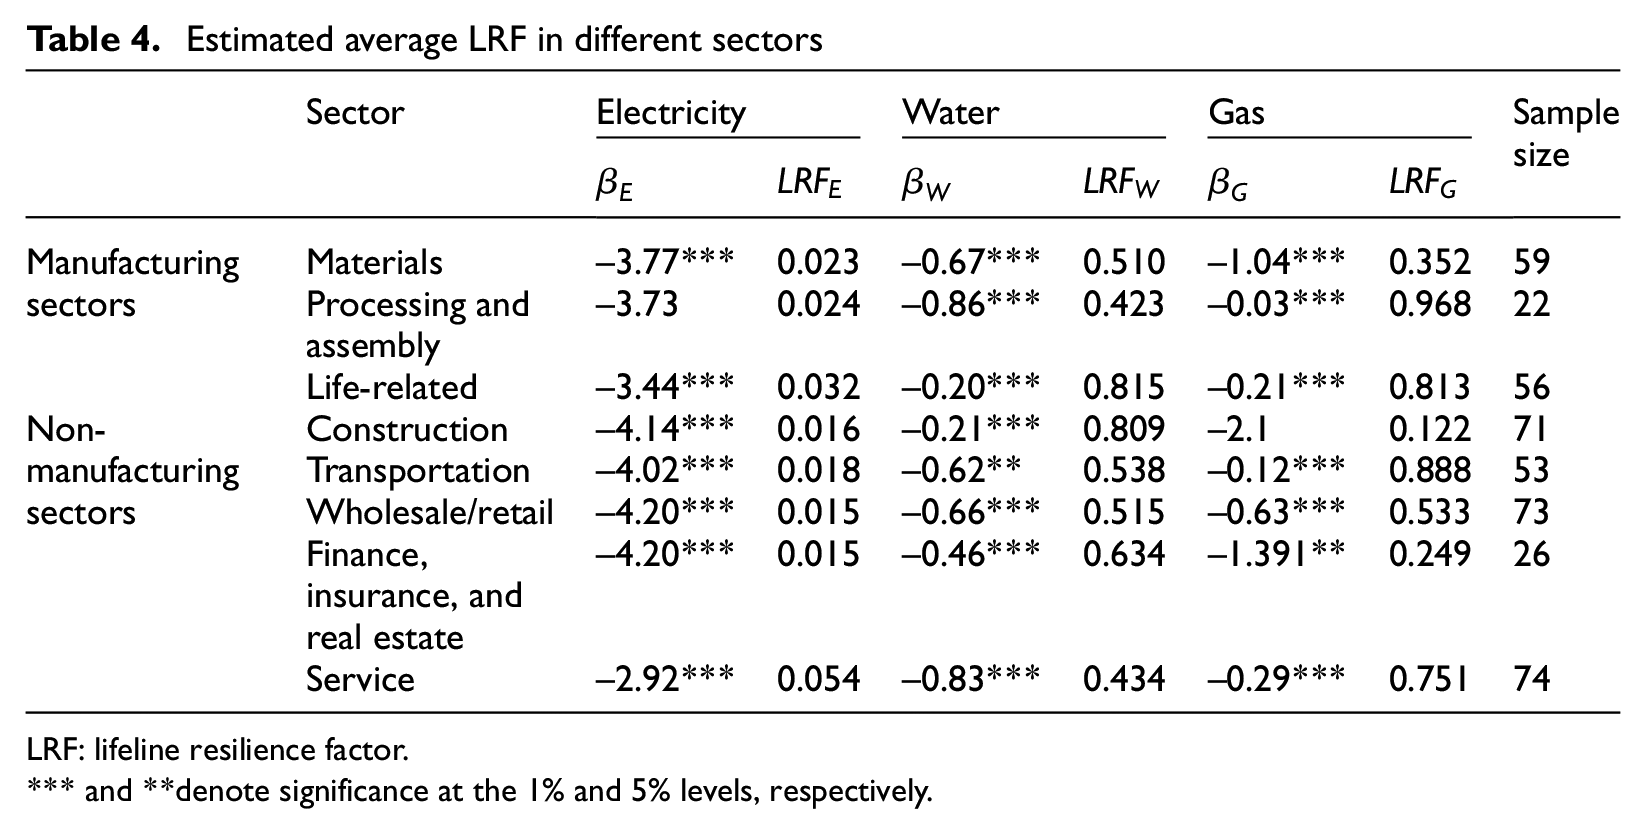
LRF: lifeline resilience factor.
*** and **denote significance at the 1% and 5% levels, respectively.
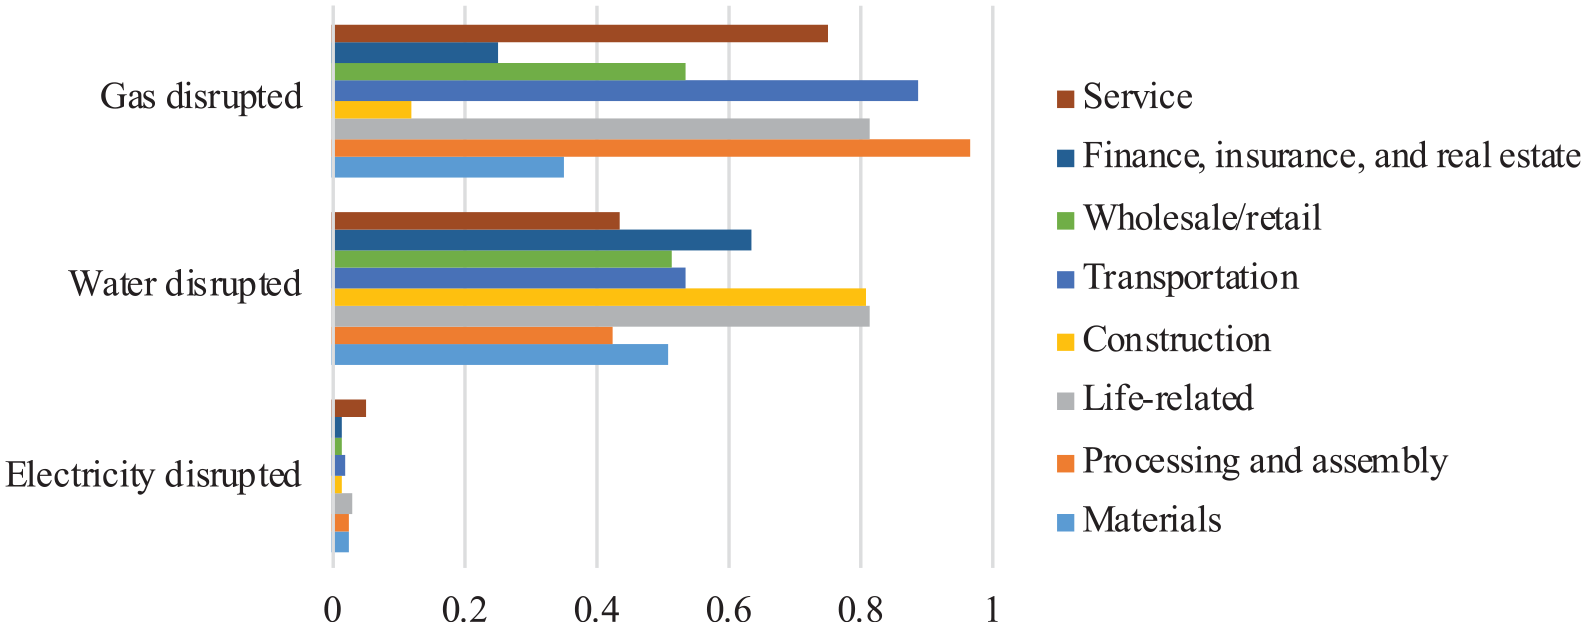
The estimated lifeline resilience factors in different sectors.
A comparison between the LRFs estimated based on post-disaster data in this research and other hypothetical-disaster-based or expert opinion-based studies is listed in Table 5. Specifically, it includes our estimations based on the 2011 Great Japan Earthquake business recovery survey data, a hypothetical-disaster-based survey conducted in Tokai area in Japan (Kajitani and Tatano, 2009), and the corresponding expert-opinion-based estimation from ATC-25. ATC-25 is the first approximation of the indirect economic effects caused by lifeline disruptions due to earthquakes.
Comparison of lifeline resilience factors results with previous research
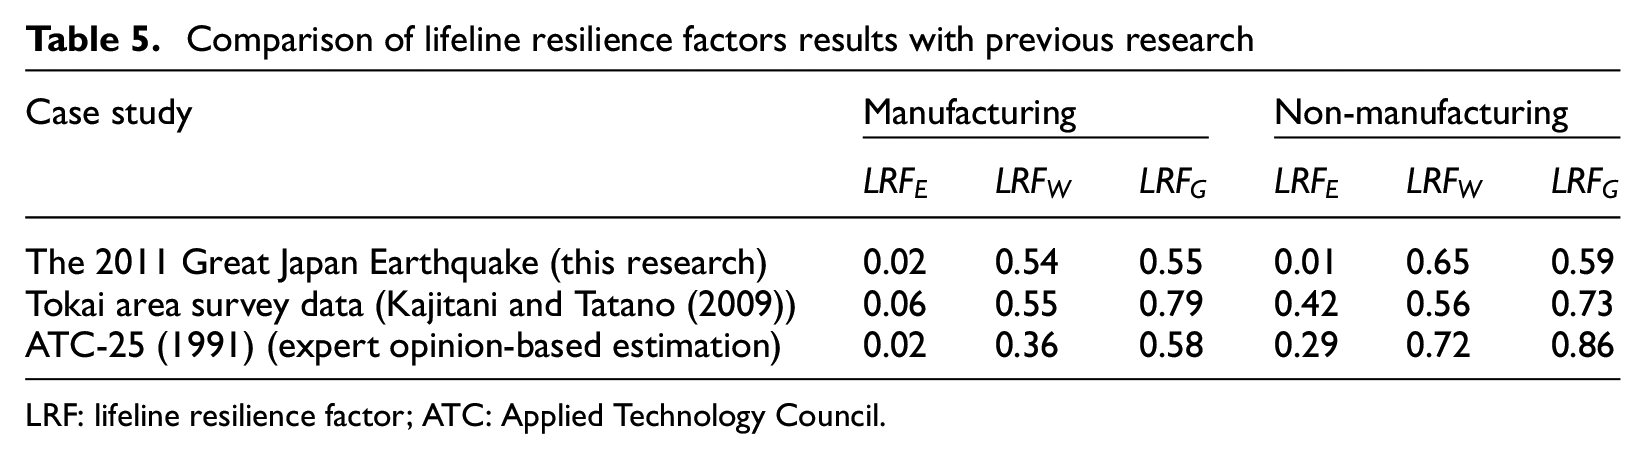
LRF: lifeline resilience factor; ATC: Applied Technology Council.
Overall, our results are consistent with the previous survey-based studies and expert-based evaluations. However, at present, businesses are more vulnerable to electricity and gas supply disruptions, while the vulnerability to water disruptions has reduced compared to when previous studies were carried out. One possible reason is the mechanization and automation development trends of businesses, which means that they have a higher dependency on electric power. Besides, different data sets (different region and disaster characteristics) and estimation methodology also affect the LRFs’ estimation results. To be specific, ATC-25 utilized expert opinions for defining lifeline services’ importance on firms’ productivity, while Kajitani and Tatano’s (2009) estimated results take advantage of the evaluation of statistical characteristics of resilience in large samples from the hypothetical disaster questionnaire surveys.
Discussion and conclusion
This study estimates LRFs quantitatively describing the economic impact of lifeline disruptions on business recovery. The results are consistent with those of previous studies, indicating that in both manufacturing and non-manufacturing sectors, businesses suffering from lifeline disruptions experienced a comparatively slower recovery. In terms of the economic impact of lifeline disruption, the results derived from the 2011 Great East Japan Earthquake indicate that the impact of electric power disruption on production capacity is most severe, both in the manufacturing and non-manufacturing sectors, with resilience factors of 0.023 and 0.012, respectively, which corresponds to 97.7% and 98.8% losses of production capacity, respectively. For water disruption, the resilience factors in the manufacturing and non-manufacturing sectors are 0.542 and 0.651, corresponding to 45.8% and 34.9% production capacity losses, respectively. The gas resilience factors in the manufacturing and non-manufacturing sectors are 0.552 and 0.589, corresponding to production capacity losses of 44.8% and 41.1%, respectively. As different sectors attach varying levels of importance to these factors, the LRFs in eight sectors are estimated, namely, three manufacturing sectors—materials, processing, and assembly, and life-related sectors—and five non-manufacturing sectors—construction; transportation; wholesale/retail; financial, insurance, and real estate; and service sectors. The impact of electricity and gas disruption were the most relevant, while less importance is given to water, given the mechanization and automation development trends in modern society. The results provide a reference on the priority of lifeline service recovery and evidence-based decision-making support for investments in restoring lifeline systems after a disaster.
The research on business recovery is important for reducing economic losses and achieving a quicker recovery, especially when businesses face increasing exposure risks. There are a growing number of studies addressing how businesses prepare for, respond to, and recover from disasters. However, the lack of disaster data is a common challenge, especially when dealing with post-disaster recovery. In addition, the economic impact of infrastructure recovery is complicated and hard to evaluate when considering the interdependencies within infrastructure systems. As this study has established a production function that empirically estimates the LRFs, it contributes to improving the disaster awareness and preparation of business managers, such as providing information for business managers in making business continuity plans, empirical evidence for post-disaster recovery, and disaster awareness that could help policy-makers and business managers achieve quick recovery.
There is room for improvement in our existing research that can be attained in future work. One drawback of the questionnaire survey is that it did not include content evaluating participants’ risk perceptions. However, a verification of the representativeness of the sample is detailed in Furuhashi et al. (2014), which uses the same data set as our research. Specifically, the correlation coefficients between the sales estimated from the questionnaire and the statistical index of industrial production (IIP) in each prefecture are used to measure the representativeness. The result shows that the correlation coefficients between the estimated sales, based on the questionnaire, and the IIP for all prefectures are from 0.78 to 0.88, which indicates the data collected from the questionnaire survey are representative and consistent with the official published economic index. In addition, the assumption of mutual independence between influence factors may lead to an estimation bias on the impact of each lifeline on business recovery. For example, recovery may be delayed if electric power is disrupted, although other lifeline services may have already recovered. Moreover, the case study methodology applies to other types of disasters or regions, while the regional differences and vulnerability to disaster should also be considered in the future.
Footnotes
Appendix 1
Acknowledgements
The authors are grateful to editors and anonymous reviewers who made valuable comments. Their comments and suggestions have been most helpful for the authors’ revisions.
Declaration of conflicting interests
The author(s) declared no potential conflicts of interest with respect to the research, authorship, and/or publication of this article.
Funding
The author(s) declared the following potential conflicts of interest with respect to the research, authorship, and/or publication of this article: Huan Liu acknowledges the financial support from China Scholarship Council (CSC).