
Abstract
As part of the update of the 2018 National Seismic Hazard Model (NSHM) for the conterminous United States (CONUS), new ground motion and site effect models for the central and eastern United States were incorporated, as well as basin depths from local seismic velocity models in four western US (WUS) urban areas. These additions allow us, for the first time, to calculate probabilistic seismic hazard curves for an expanded set of spectral periods (0.01 to 10 s) and site classes (VS30 = 150 to 1500 m/s) for the CONUS, as well as account for amplification of long-period ground motions in deep sedimentary basins in the Los Angeles, San Francisco Bay, Seattle, and Salt Lake City areas. Two sets of 2018 NSHM hazard data (hazard curves and uniform-hazard ground motions) are available: (1) 0.05°-latitude-by-0.05°-longitude gridded data for the CONUS and (2) higher resolution 0.01°-latitude-by-0.01°-longitude gridded data for the four WUS basins. Both sets of data contain basin effects in the WUS deep sedimentary basins. Uniform-hazard ground motion data are interpolated for 2, 5, and 10% probability of exceedance in 50 years from the hazard curves. The gridded data for the hazard curves and uniform-hazard ground motions, for all periods and site classes, are available for download at the U.S. Geological Survey ScienceBase Catalog (https://doi.org/10.5066/P9RQMREV). The design ground motions derived from the hazard curves have been accepted by the Building Seismic Safety Council for adoption in the 2020 National Earthquake Hazard Reduction Program Recommended Seismic Provisions.
Keywords
Introduction
Approximately every six years, the U.S. Geological Survey (USGS) National Seismic Hazard Model (NSHM) Project updates the NSHM for the conterminous United States (CONUS), calculates probabilistic seismic hazard curves, and produces a set of uniform-hazard ground motion maps. These hazard curves and maps provide the basis for many policies regarding earthquake hazards, including seismic-design regulations for buildings (e.g. Building Seismic Safety Council (BSSC), 2015), bridges, highways, railroads, and other structures. These data and maps are also used by the insurance industry and federal, state, and local governments for policy and risk mitigation documents.
From 2017 to 2019, the NSHM Project updated the NSHM for the CONUS (Petersen et al., 2020, referred to as the “2018 NSHM”) and presented a limited number of uniform-hazard ground motion maps: 2, 5, and 10% probability of exceedance in 50 years, interpolated from probabilistic seismic hazard curves for peak ground acceleration (PGA) and 0.2, 1, and 5 s spectral accelerations (SA) for both a rock site condition (time-averaged shear wave velocity in the upper 30 m of the crust (VS30) = 760 m/s) and a soil site condition (VS30 = 260 m/s) (Rukstales and Petersen, 2019).
In this article, we discuss the hazard curves and uniform-hazard ground motion map data for 2, 5, and 10% probability of exceedance in 50 years, for 22 spectral periods (including PGA) and 8 different site classes corresponding to VS30 values from 150 to 1500 m/s (i.e. representing site classes A to E as defined by the 2020 National Earthquake Hazards Reduction Program (NEHRP) Recommended Seismic Provisions; BSSC, 2020) using the 2018 NSHM. A limited subset of this data is presented and discussed. The full set of gridded hazard curves and uniform-hazard ground motion map data are available for download at the USGS ScienceBase Catalog (Shumway et al., 2020; https://doi.org/10.5066/P9RQMREV). Due to the large number of maps that would result from this dataset (22 spectral periods x 8 site classes x 3 return periods = 528 maps), we have decided not to produce map figures, but to simply provide the gridded uniform-hazard ground motion data that can be accessed by users to produce maps.
The design ground motion data derived from these hazard curves have been accepted by the BSSC for adoption in the 2020 NEHRP Recommended Seismic Provisions (BSSC, 2020). This is the first time that a building code document will be using the USGS NSHM additional period and site class data directly to develop design response spectra as recommended by Project 17 (BSSC, 2019), versus calculating design response spectra that were based on only two periods and one reference site class (Kircher et al., 2019; Rezaeian and Luco, 2019). We anticipate these data will also be used by many other users of the NSHMs.
2018 update of the NSHM
The 2018 NSHM includes (1) updated seismicity rate models for the CONUS outside of California; (2) new ground motion models (GMMs), aleatory variability models, and site effect models (for amplification or de-amplification of GMMs) in the central and eastern United States (CEUS); and (3) incorporation of basin depths from local seismic velocity models in four urban areas in the western United States (WUS). The fault model of the 2018 NSHM remains the same from the last update in 2014 (Petersen et al., 2014, 2015; referred to as the “2014 NSHM”). The sections “Seismicity rate models,”“Ground motion models,” and “Site effect models” give a brief summary of the model updates; more details can be found in the work by Petersen et al. (2020).
Seismicity rate models
The seismicity catalog was updated to include new events (in 2013 through 2017) that occurred since the 2014 NSHM (Mueller, 2019). The California seismicity catalog was not updated because that catalog is part of the unchanged Uniform California Earthquake Rupture Forecast Model (UCERF3, Field et al., 2014). The updated seismicity catalog was used to update the gridded rate models for the CEUS and WUS (outside of California).
Ground motion models
In the CEUS, GMMs were updated to include the Next Generation of Ground-Motion Attenuation Models for central and eastern North America (NGA-East GMMs) developed for the USGS (“NGA-East for USGS GMMs”; Goulet et al., 2017) as well as a set of “Updated Seed GMMs” (Petersen et al., 2020; Rezaeian et al., 2021). These two sets of GMMs were implemented as a logic tree, with two-thirds (0.667) weight given to the NGA-East for USGS GMMs and one-third (0.333) to the Updated Seed GMMs (a logic tree of weights was also developed for the Updated Seed GMMs). A logic tree of two aleatory variability models (standard deviation of GMMs, or sigma) was applied to the two sets of CEUS GMMs, with four-fifths weight (0.8) given to a model based on the work by Goulet et al. (2017) and one-fifth weight (0.2) given to a model based on the work by Stewart et al. (2019) (Petersen et al., 2020; Rezaeian et al., 2021).
In the WUS, the same set of GMMs, weights, and aleatory variability models used to calculate additional period and site class maps from the 2014 NSHM (Shumway et al., 2018) were used in the 2018 NSHM. Using basin depths from local seismic velocity models required modification of the subduction GMMs because they do not include a parameter for depth to a shear-wave velocity of 1.0 km/s (Z1.0) or 2.5 km/s (Z2.5). We did this by incorporating the basin term from the work by Campbell and Bozorgnia (2014) GMM (CB14). We determined that the basin term from the CB14 GMM was the most appropriate to use based on studies done in the city of Seattle, WA (Chang et al., 2014; Wirth et al., 2018a), which indicate the CB14 GMM provided estimates of basin amplification are in closer agreement to recent 3D simulations (Frankel et al., 2018; Wirth et al., 2018b) than other NGA-West2 GMMs (Petersen et al., 2020; Powers et al., 2021).
Table 1 summarizes all GMMs and weights used in the 2018 NSHM. In-depth discussion of CEUS and WUS GMMs are provided in the works by Rezaeian et al. (2021) and Powers et al. (2021), respectively.
Ground motion models and weights used in the 2018 National Seismic Hazard Model
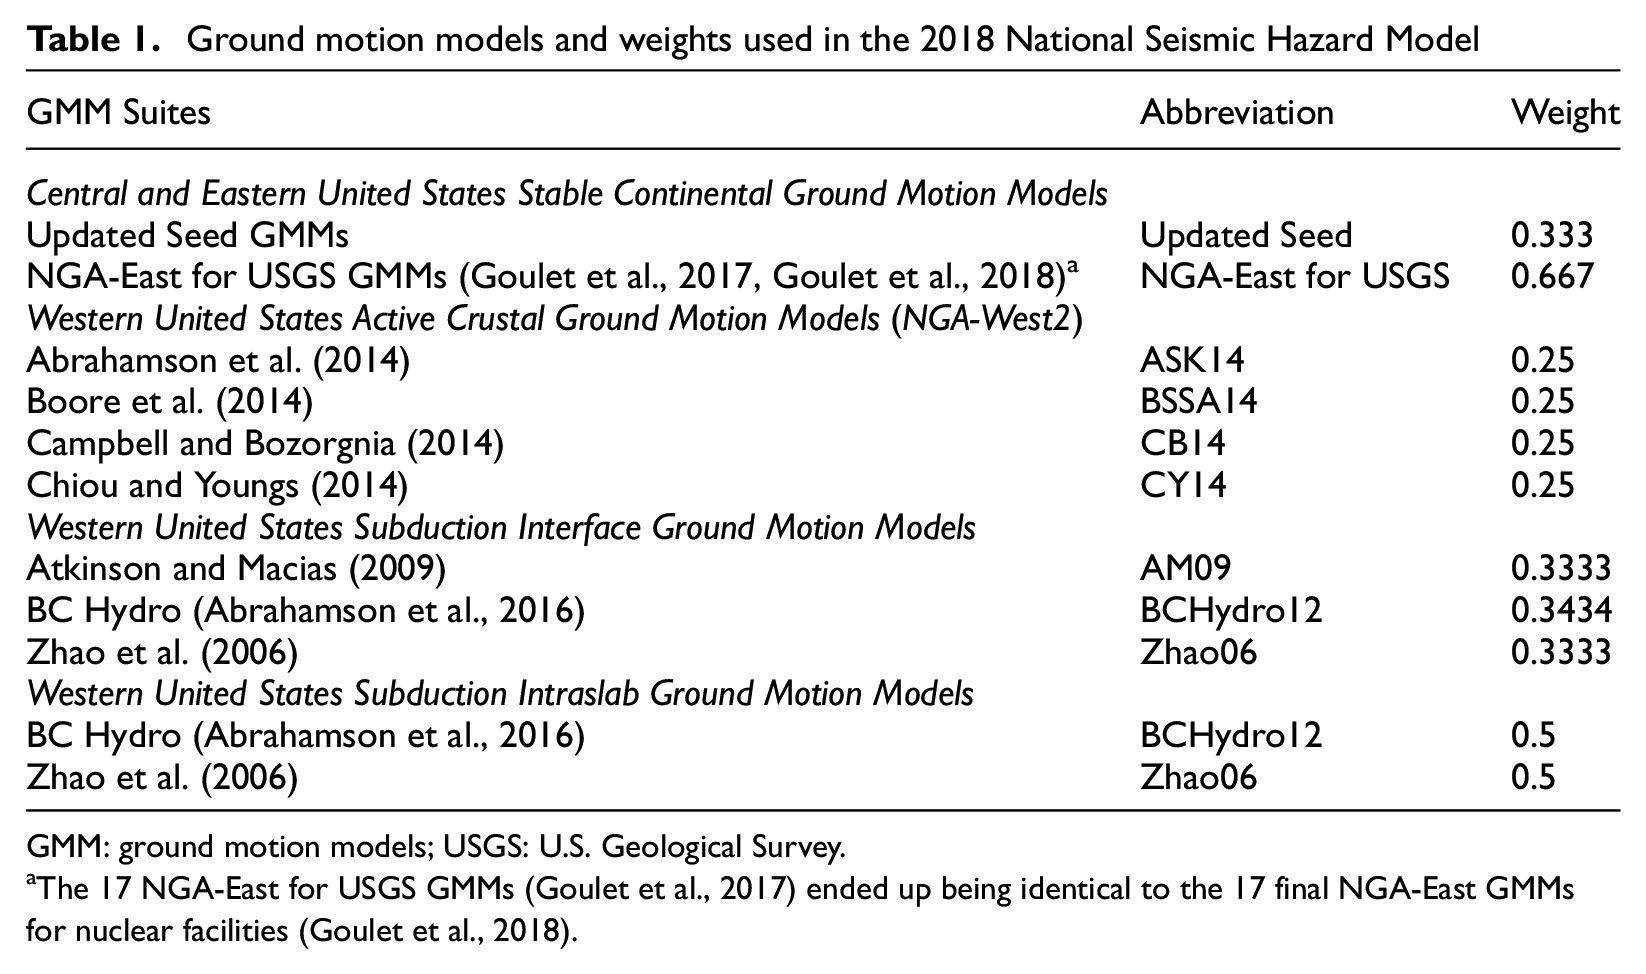
GMM: ground motion models; USGS: U.S. Geological Survey.
The 17 NGA-East for USGS GMMs (Goulet et al., 2017) ended up being identical to the 17 final NGA-East GMMs for nuclear facilities (Goulet et al., 2018).
Site effect models
The GMMs used in the CEUS were developed only for hard rock site conditions of VS30 = 3000 m/s. In order to account for site effects in the 2018 NSHM, we implemented a model based on those proposed by Stewart et al. (2020; linear) and Hashash et al. (2020; nonlinear), which convert hard rock sites to firm rock sites (VS30 = 760 m/s) and then to a specific site condition defined by VS30 (Petersen et al., 2020; Rezaeian et al., 2021).
The NGA-West2 GMMs used in the WUS include site effects conditioned on VS30. In the absence of basin depth values, the NGA-West2 models compute a default basin depth from the site VS30 value, which leads to a uniform basin effect over a map of hazard computed for a specific VS30. In the 2018 NSHM, we include spatially varying basin depth values within four urban areas with deep sedimentary basins: Los Angeles, San Francisco Bay, Seattle, and Salt Lake City (Figure 1).
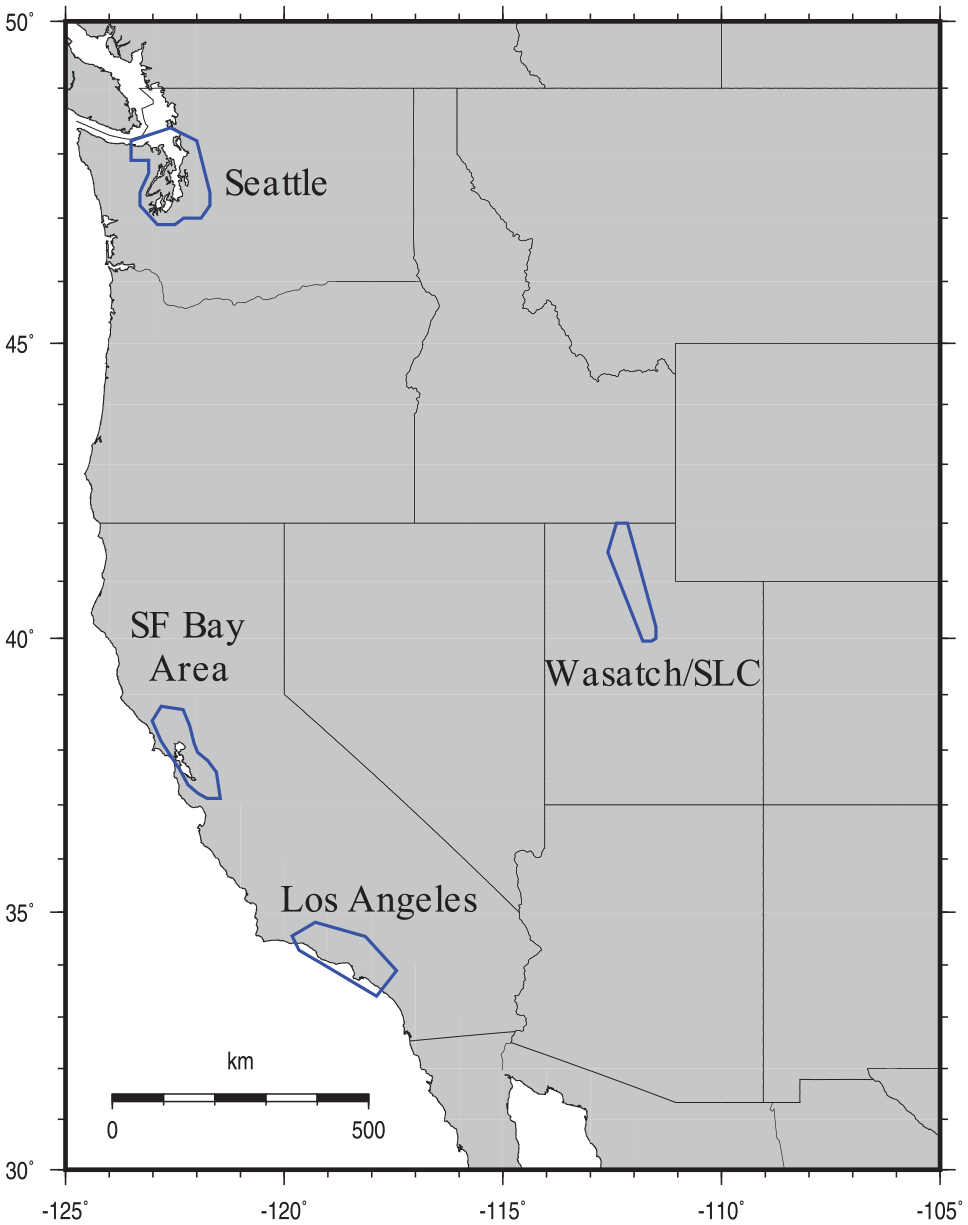
Map of four urban areas in the western United States where data from local seismic velocity models are used directly in the calculation of hazard from the 2018 National Seismic Hazard Model (NSHM). The local seismic velocity models used in the 2018 NSHM are for Los Angeles (Lee et al., 2014), the San Francisco Bay Area (Aagaard et al., 2008), Seattle (Stephenson, 2007; Stephenson et al., 2017), and the Wasatch/Salt Lake City area (Magistrale et al., 2008).
Calculating additional period and site class data
In the 2014 NSHM, CEUS GMMs and the lack of a CEUS site effect model limited the number of spectral periods (seven; PGA, 0.1, 0.2, 0.3, 0.5, 1, and 2 s) and site classes (two; VS30 = 2000 and 760 m/s) at which probabilistic seismic hazard curves could be calculated. In the WUS, we were able to calculate hazard curves for 11 spectral periods (PGA, 0.1, 0.2, 0.3, 0.5, 0.75, 1, 2, 3, 4, and 5 s) and 8 site classes (VS30 = 1500, 1080, 760, 530, 365, 260, 185, and 150 m/s) because the WUS GMMs were available for more spectral periods and account for site effects using a VS30 value. More information on additional periods and site classes from the 2014 NSHM is provided in the work by Shumway et al. (2018).
Our ultimate goal is to provide a selection of hazard data for all periods and site classes recommended by Project 17 (BSSC, 2019). The new CEUS GMMs used in the 2018 NSHM were developed for 25 spectral periods (including peak ground velocity (PGV) and PGA), and the new CEUS site effect model is valid for VS30 values from ∼200 to 3000 m/s. Combining these new GMMs with the WUS GMMs allows us, for the first time, to calculate hazard maps for the periods and site classes of interest for the entire CONUS.
Additional spectral periods
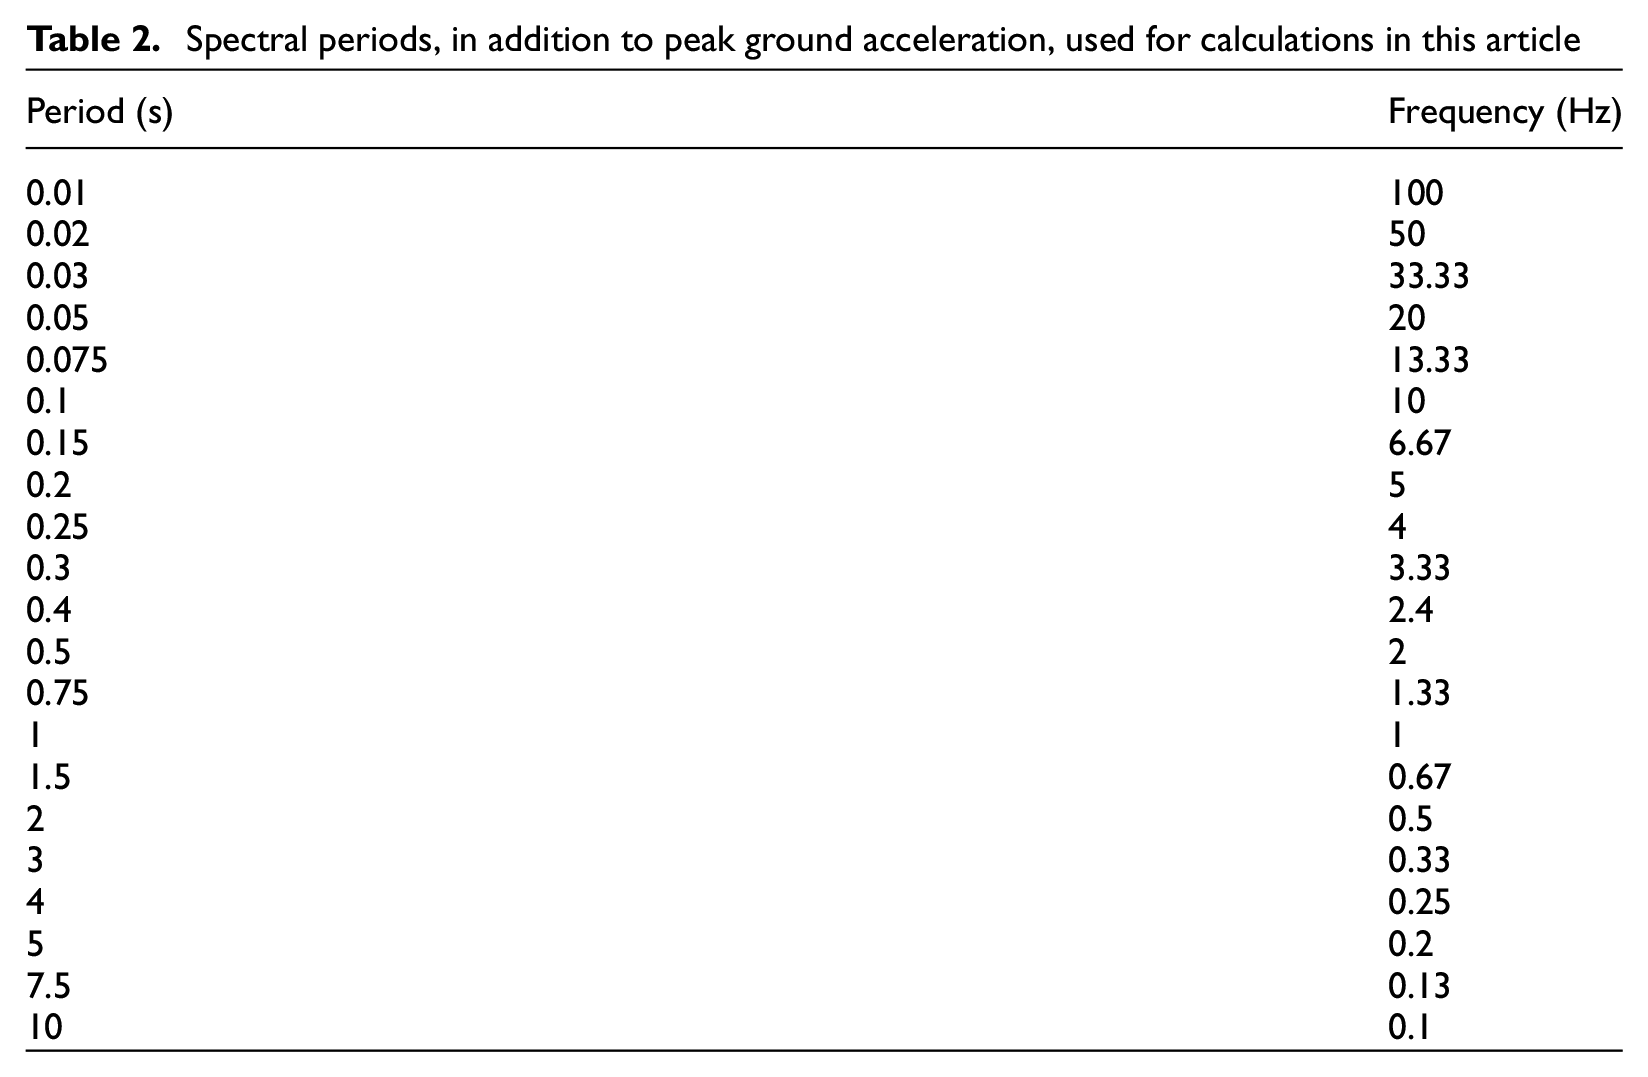
We first needed to define a set of spectral periods at which to calculate hazard. To do this, we looked at the spectral periods available for each of the GMMs implemented in the 2018 NSHM (Table 1). Many of the GMMs that we implemented (e.g. NGA-East for USGS, NGA-West2) were developed as part of the Next Generation of Ground-Motion Attenuation Models (NGA) Program and are available for a wide range of spectral periods (0.01 s to 10 s). Spectral periods common to both NGA-West2 (22 periods, including PGA) and NGA-East for USGS (24 periods, including PGA) allow for consideration of GMMs with 22 spectral periods, including PGA.
Some of the older, and non-NGA developed GMMs, have more limited ranges of spectral periods. However, when a GMM was missing a spectral period(s), we were able to work with the GMM developer(s) to interpolate (in the case of AM09, BCHydro12, and Zhao06) and/or extrapolate (for Zhao06) their models so that we could calculate hazard for the 22 spectral periods shown in Table 2.
Spectral periods, in addition to peak ground acceleration, used for calculations in this article
Additional site classes
When calculating additional site class maps from the 2014 NSHM (Shumway et al., 2018), we defined a set of VS30 values in collaboration with the BSSC Provisions Update Committee (PUC) to represent the NEHRP site classes proposed for the 2020 NEHRP cycle (Kircher et al., 2019). For the 2018 NSHM, we use this same set of VS30 values to define our additional site classes. Table 3 lists the eight VS30 values and their corresponding site classes. The only difference from the work by Shumway et al. (2018) is that VS30 = 1500 m/s now represents site class A, instead of the previous site class boundary AB. This change was made to be consistent with the new site class definitions proposed for the 2020 NEHRP Provisions, with VS30 = 1500 m/s being the lower bound of site class A (site class AB is not defined).
Eight site classes defined by their VS30 values and their corresponding proposed site classes for the 2020 NEHRP Provisions (BSSC, 2020), used for calculations in this article
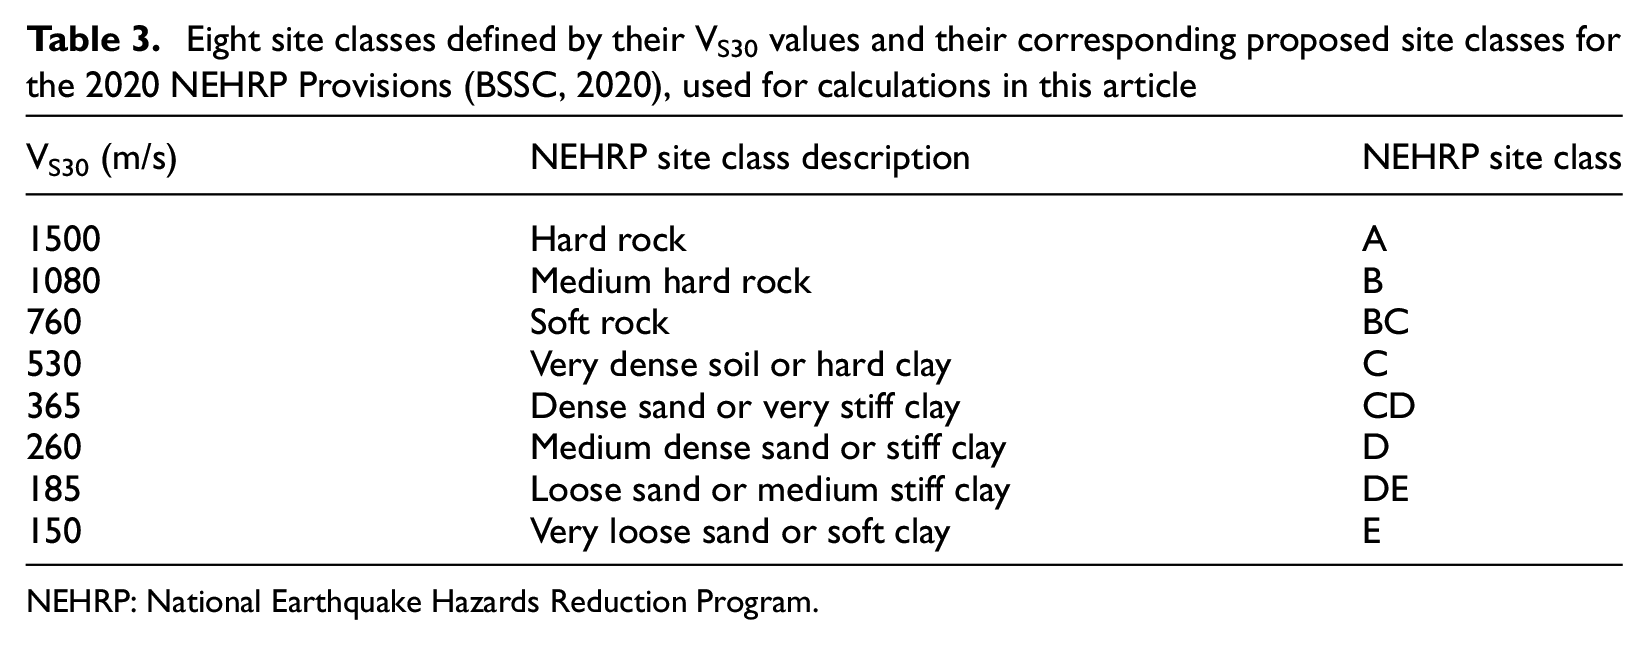
NEHRP: National Earthquake Hazards Reduction Program.
Extrapolation of the VS30 models for certain GMMs, both in the WUS and CEUS, were required in order to run some of the site class calculations. In the WUS, we extrapolated some GMMs to 150 and 1500 m/s and confirmed that they were reasonable (Powers et al., 2021). In the CEUS, the site effect model was developed for VS30 values from ∼200 to 3000 m/s. Based on discussions with the modelers, we applied the model down to VS30 = 150 m/s to compute ground motions at NEHRP site class E (Rezaeian et al., 2021).
Hazard calculations
Using the 2018 NSHM, probabilistic seismic hazard calculations were performed using previous NSHM methodologies (e.g. Algermissen and Perkins, 1976; Frankel et al., 1996, 2002; Petersen et al., 2008, 2014, 2015) based on the fundamental method reported by Cornell (1968). Hazard calculations were done using the computer code nshmp-haz (Powers, 2017). The code is publicly available for download and use from GitHub (https://github.com/usgs/nshmp-haz), along with the 2018 NSHM (https://github.com/usgs/nshm-cous-2018). The version of the code used for these hazard calculations is v1.2.0 (https://github.com/usgs/nshmp-haz/releases/tag/v1.2.0). The version of the source model used for these hazard calculations is v5.0.0 (https://github.com/usgs/nshm-cous-2018/releases/tag/v5.0.0). Basin depth values (Z1.0 and Z2.5), used as input to hazard calculations for sites within the WUS basin polygons, are available at the USGS ScienceBase Catalog (Rukstales and Petersen, 2019; https://doi.org/10.5066/P9WT5OVB).
Results
Using the 2018 NSHM, we calculated probabilistic seismic hazard curves on a 0.05°-latitude-by-0.05°-longitude grid across the CONUS for 22 spectral periods (Table 2), with 5% damping, and for 8 site classes (Table 3). In addition, we calculated 0.01°-latitude-by-0.01°-longitude gridded regional-scale hazard curves for the four urban areas in the WUS in order to provide higher resolution to show the effects of basin amplification at long periods in deep sedimentary basins. However, note that both sets of hazard curves contain basin effects, matching on grid points that are common to both sets. We then interpolated the hazard curves to generate uniform-hazard ground motion map data at return periods corresponding to 2, 5, and 10% probability of exceedance in 50 years (0.000404, 0.00103, and 0.0021 annual rates of exceedance, respectively). The complete set of gridded hazard curve data and uniform-hazard ground motion map data are available at the USGS ScienceBase Catalog (Shumway et al., 2020; https://doi.org/10.5066/P9RQMREV), with a few example results presented below.
Hazard curves and uniform-hazard response spectra
To inspect the hazard results, we plotted hazard curves and uniform-hazard response spectra (UHRS) for 190 test sites across the CONUS. Total mean hazard curves for the 22 spectral periods of Table 2 are compared for a location in Seattle, WA, showing the variation of hazard with the period (Figure 2). Hazard curves are plotted for two site classes with VS30 = 760 m/s and VS30 = 260 m/s. Total mean hazard curves for the eight site classes shown in Table 3 are compared for a location in Charleston, SC (Figure 3). Hazard curves are plotted for 0.2 and 5 s periods and show the variation of hazard with site class at this location.
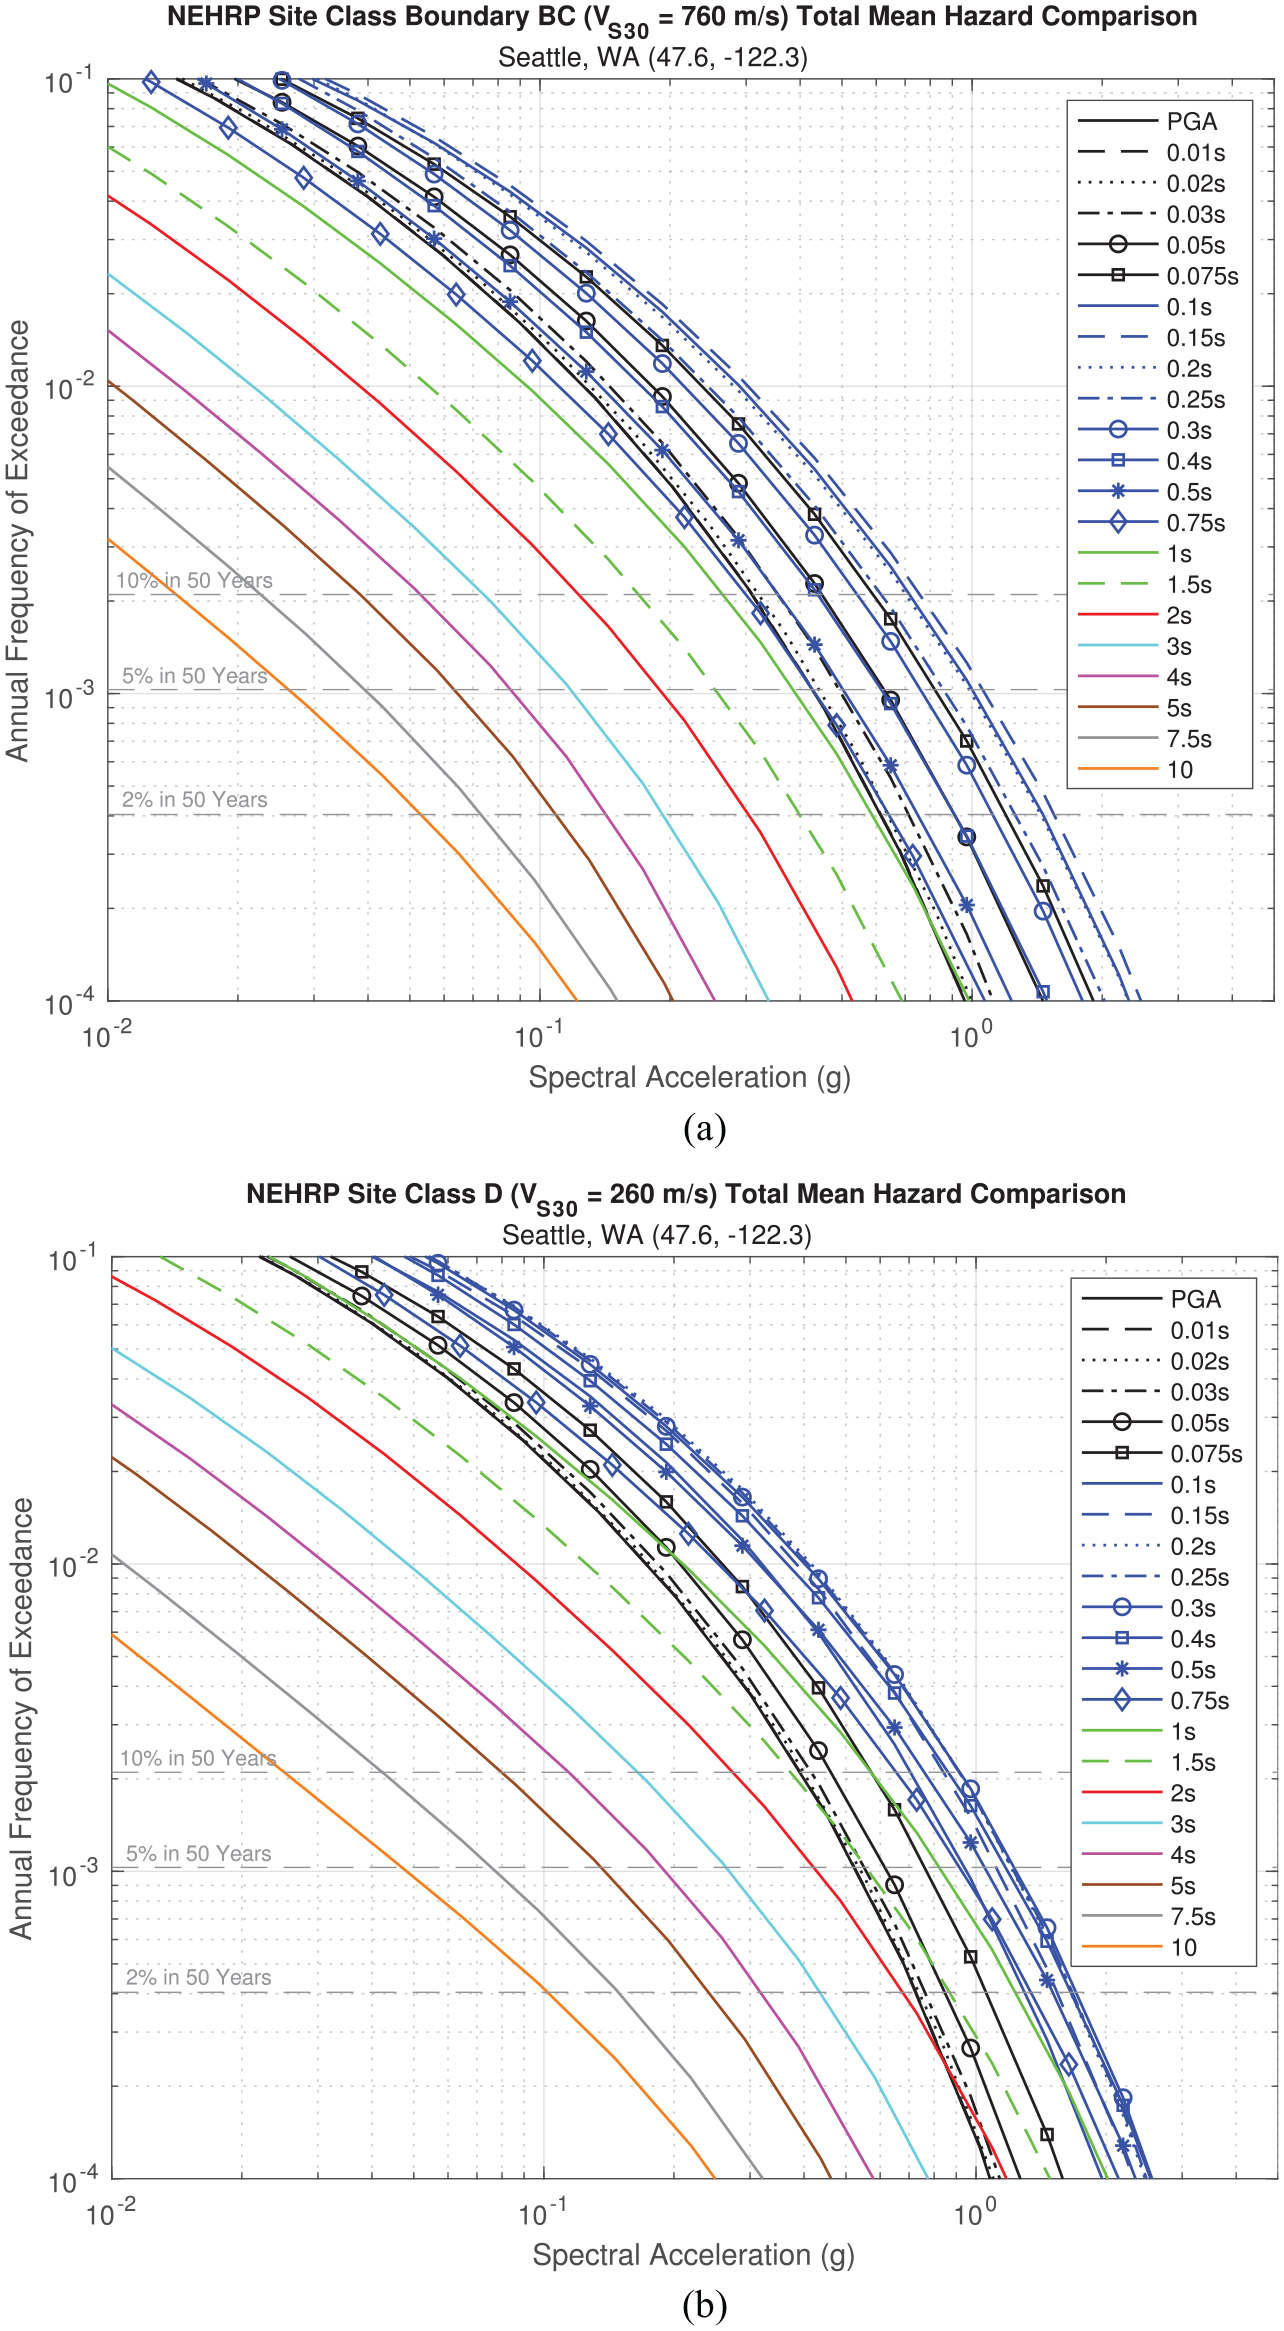
Comparison of total mean hazard curves for 22 spectral periods for (a) soft rock (VS30 = 760 m/s) and (b) medium dense sand or stiff clay (VS30 = 260 m/s) site conditions in the vicinity of Seattle, WA.
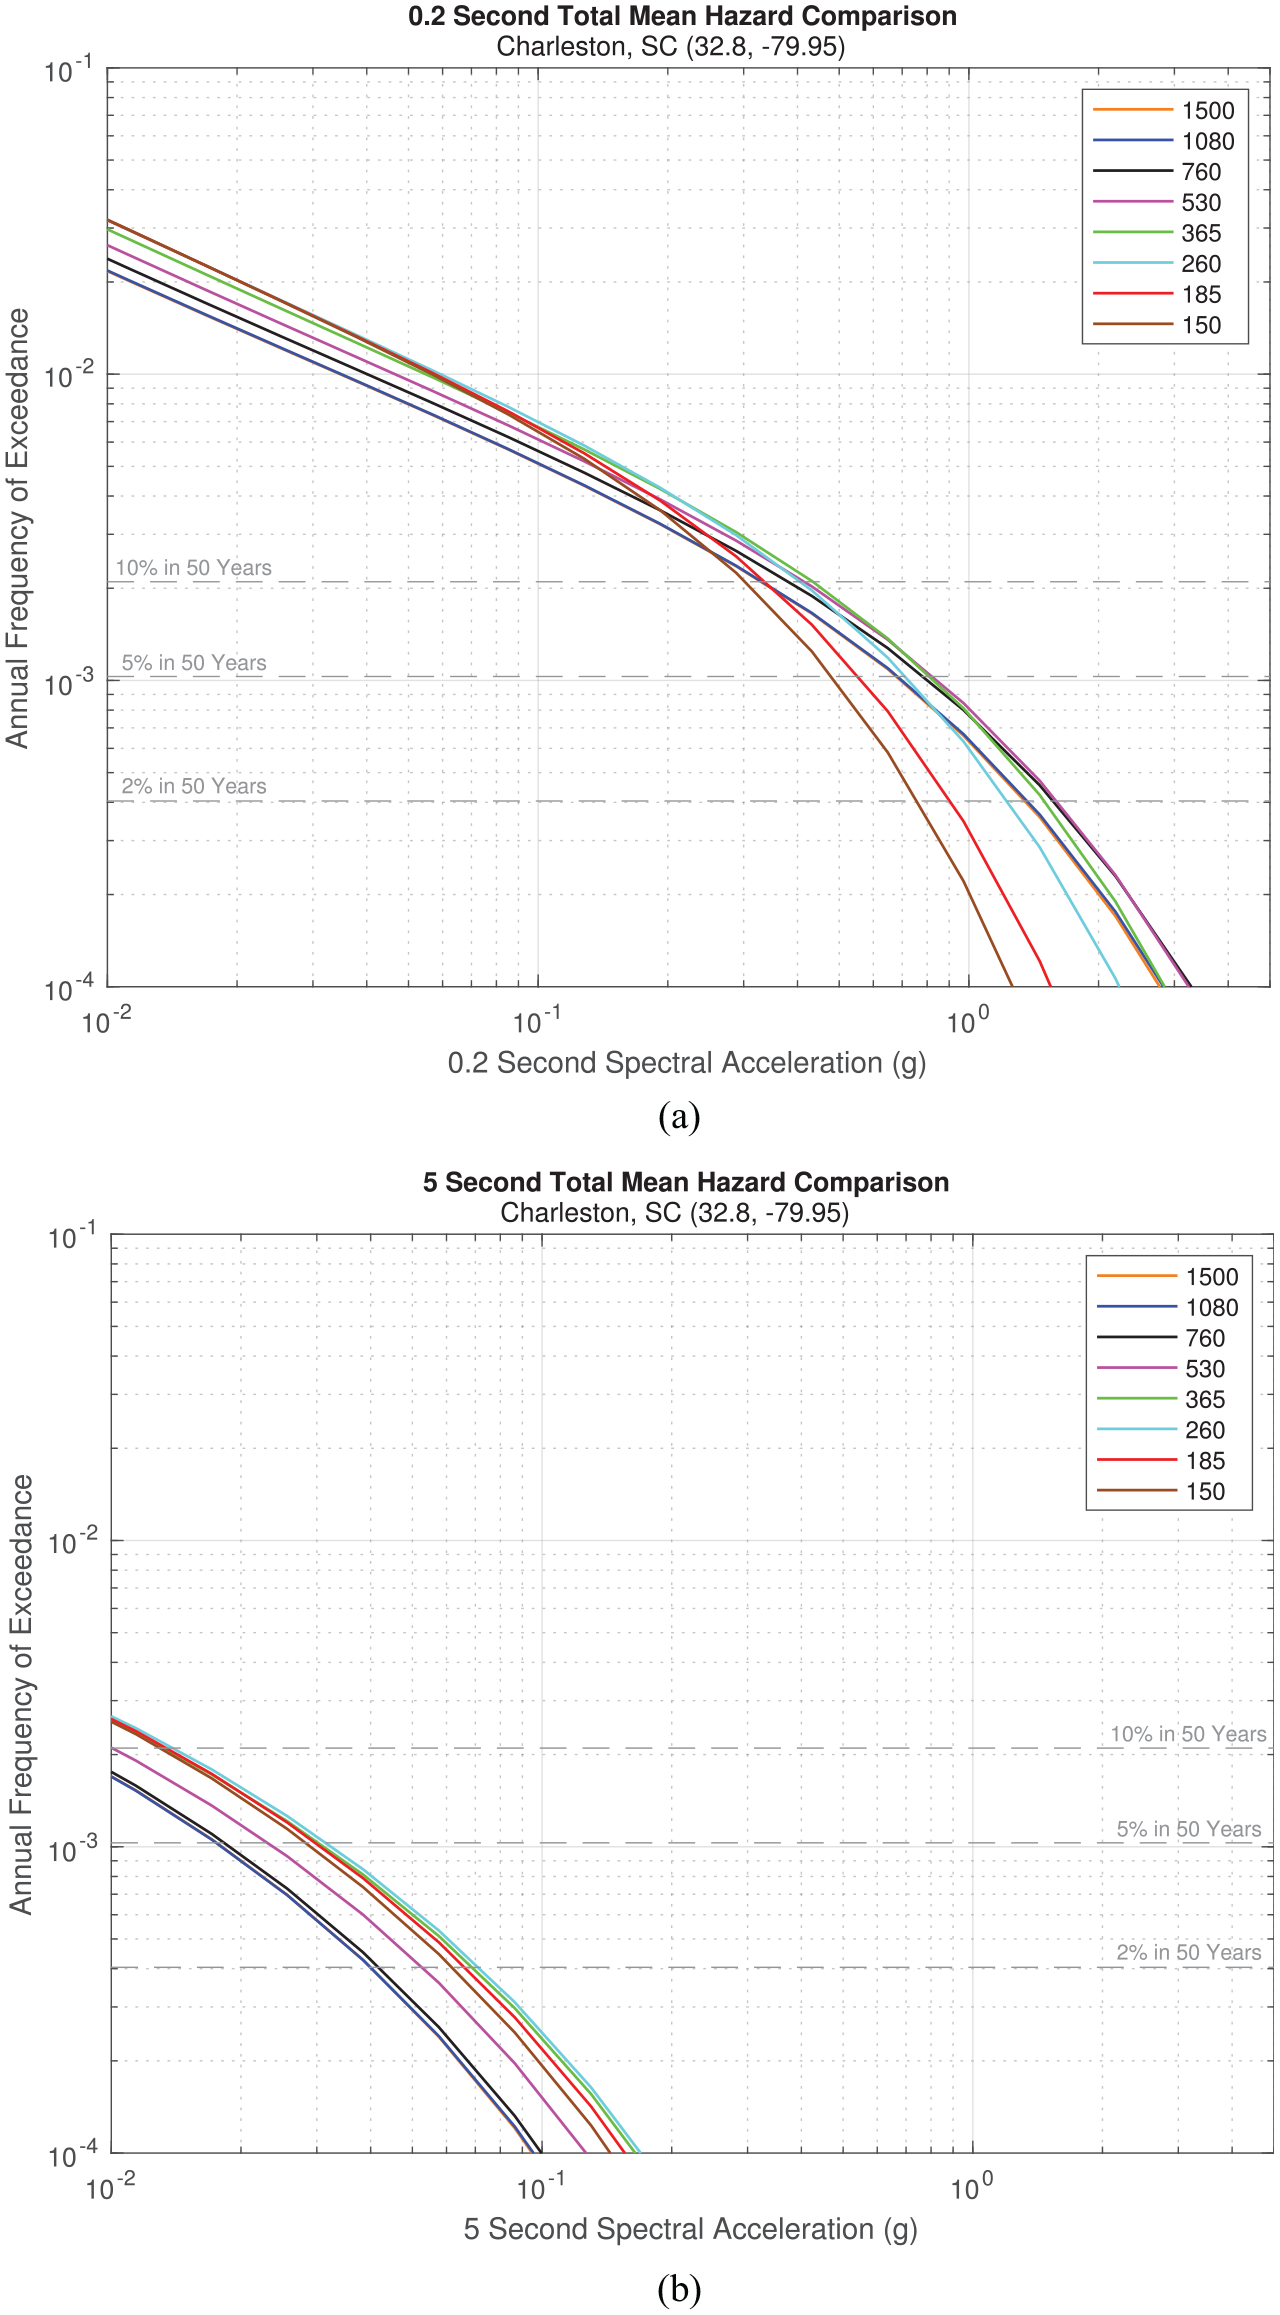
Comparison of total mean hazard curves for eight VS30 values at (a) 0.2 s and (b) 5 s spectral accelerations for a site in the vicinity of Charleston, SC (see Table 3 for corresponding National Earthquake Hazards Reduction Program site classes).
The three hazard levels (2, 5, and 10% in 50 years) are shown, for which the uniform-hazard map data are provided (Figures 2 and 3). An example set of UHRS for all periods and site classes of interest are shown for six sample sites across the CONUS (Figure 4). See the works by Petersen et al. (2020, 2021), Rezaeian et al. (2021), and Powers et al. (2021) for comparisons of hazard between the 2018 NSHM and 2014 NSHM due to specific changes to model components.
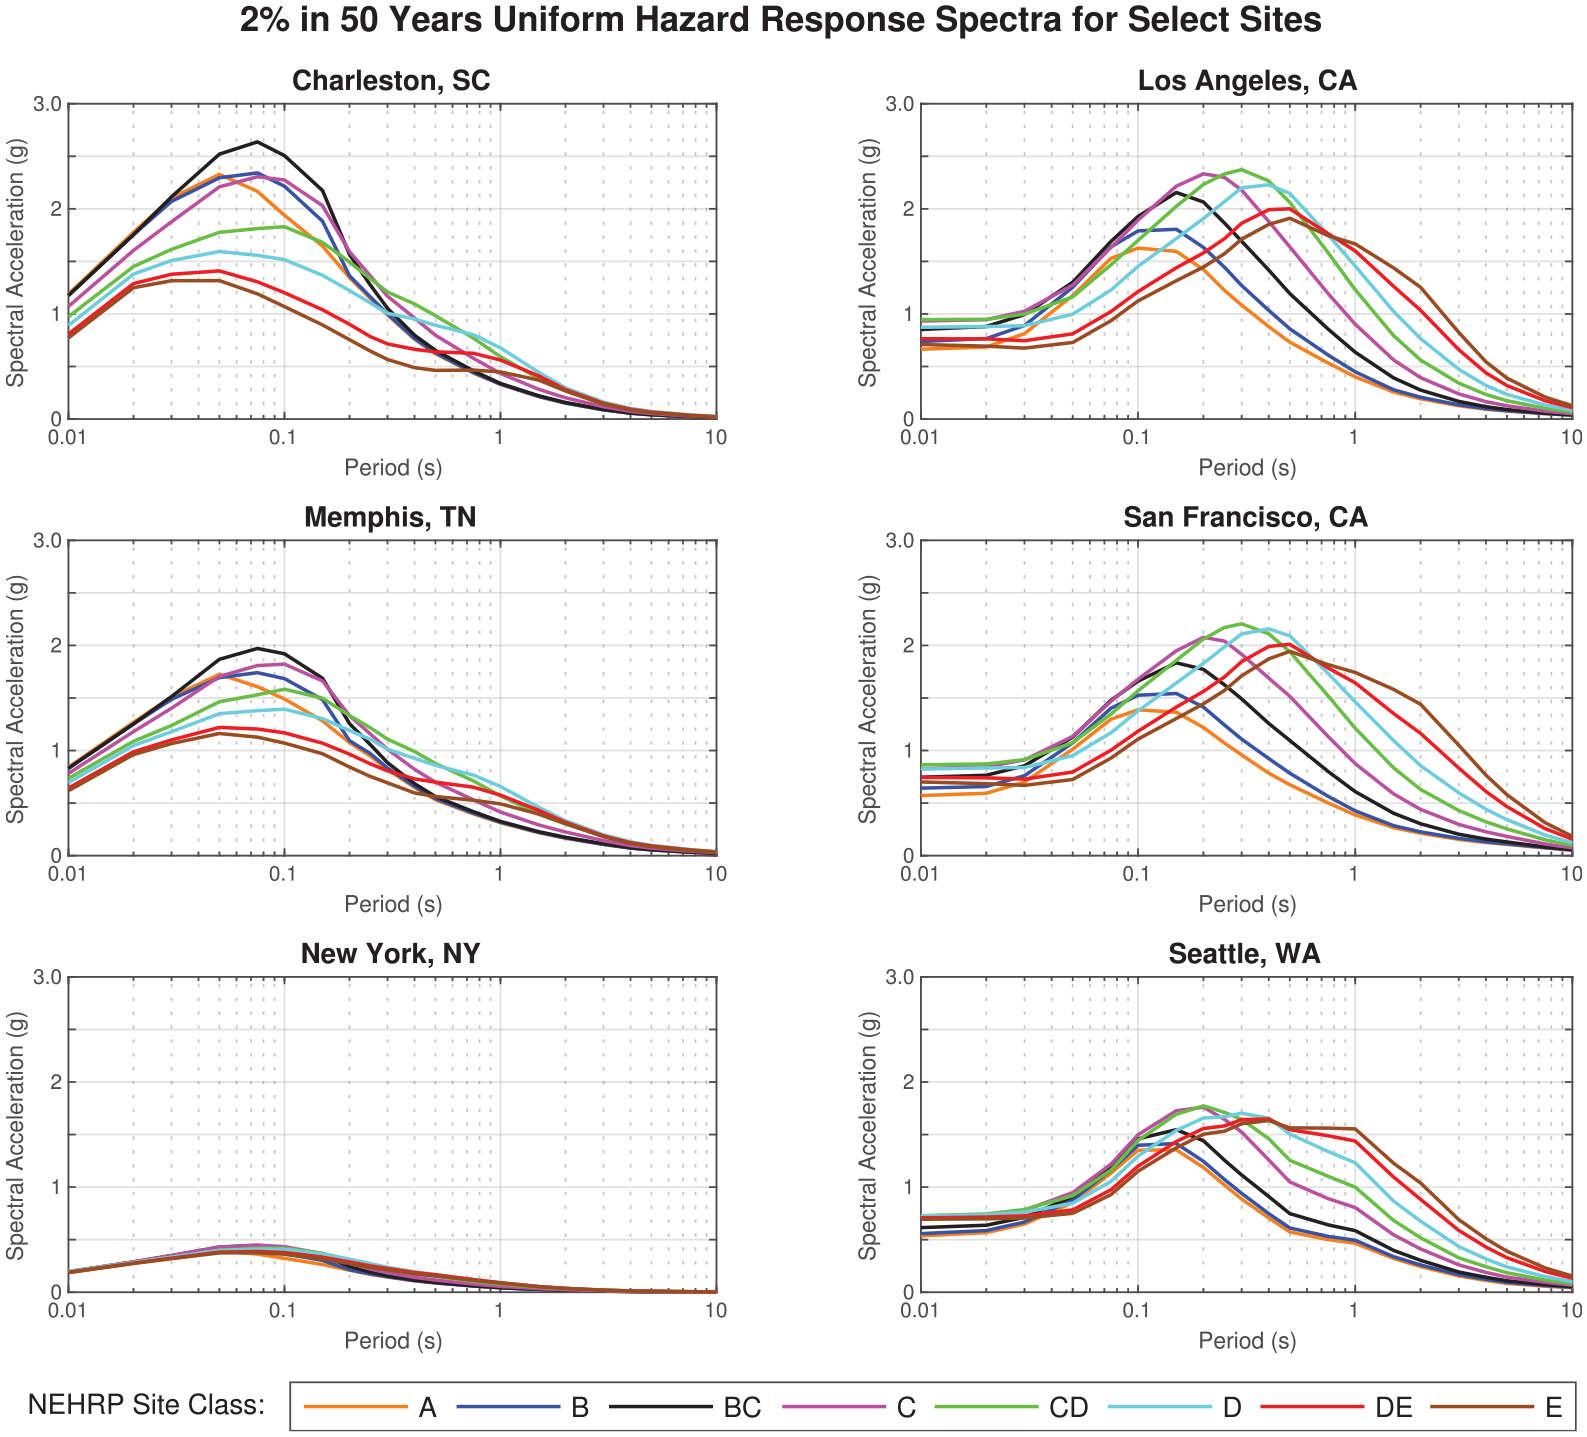
Uniform-hazard response spectra for multiple VS30 values at six sites in the United States for a 2% probability of exceedance in 50 years (see Table 3 for the corresponding National Earthquake Hazards Reduction Program site classes).
Uniform-hazard ground motion gridded data for the CONUS
Examples of uniform-hazard ground motion maps are shown for a soft rock site condition (VS30 = 760 m/s) for 0.2 and 5 s for 2% probability of exceedance in 50 years (Figure 5a and b). Examples of uniform-hazard ground motion maps are shown for a medium dense sand or stiff clay site condition (VS30 = 260 m/s) for the same periods and hazard level (Figure 6a and b). These maps were calculated on a 0.05°-latitude-by-0.05°-longitude grid and include basin effects in four urban areas in the WUS. Additional maps at these same periods and site classes for 5% and 10% probability of exceedance in 50 years are available at the USGS ScienceBase Catalog (Rukstales and Petersen, 2019).
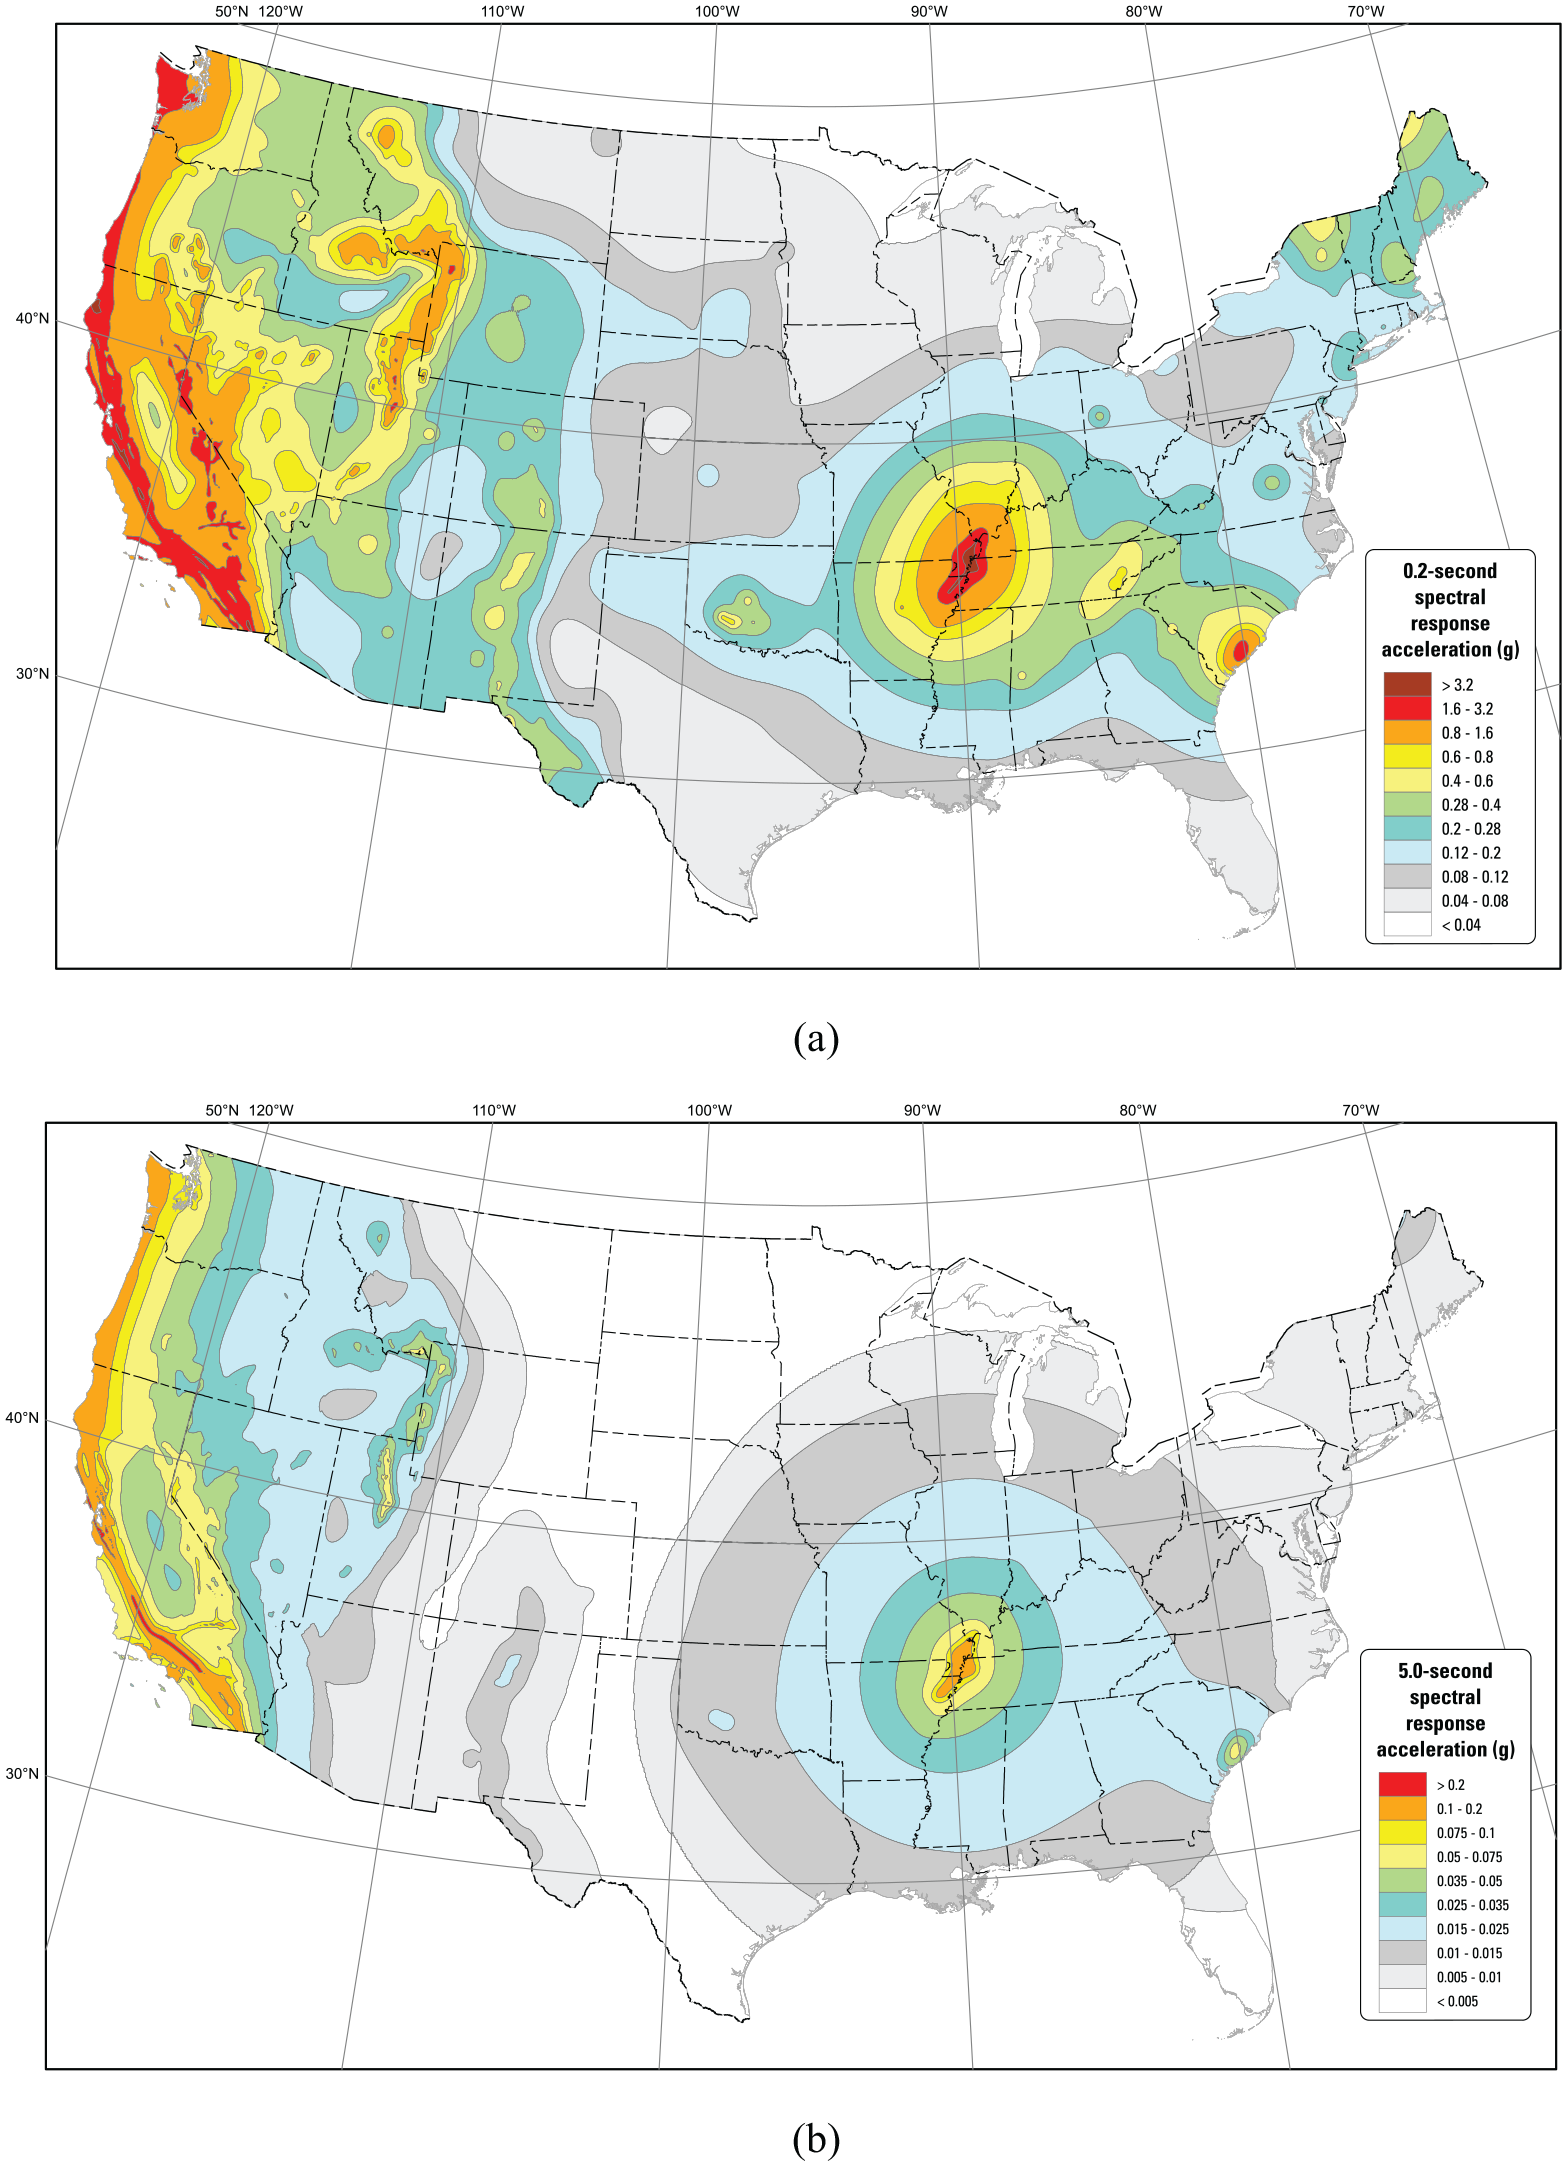
Total mean hazard for 2% probability of exceedance in 50 years at a soft rock site condition (VS30 = 760 m/s) for (a) 0.2 and (b) 5 s spectral accelerations for the 2018 National Seismic Hazard Model (modified from Rukstales and Petersen, 2019).
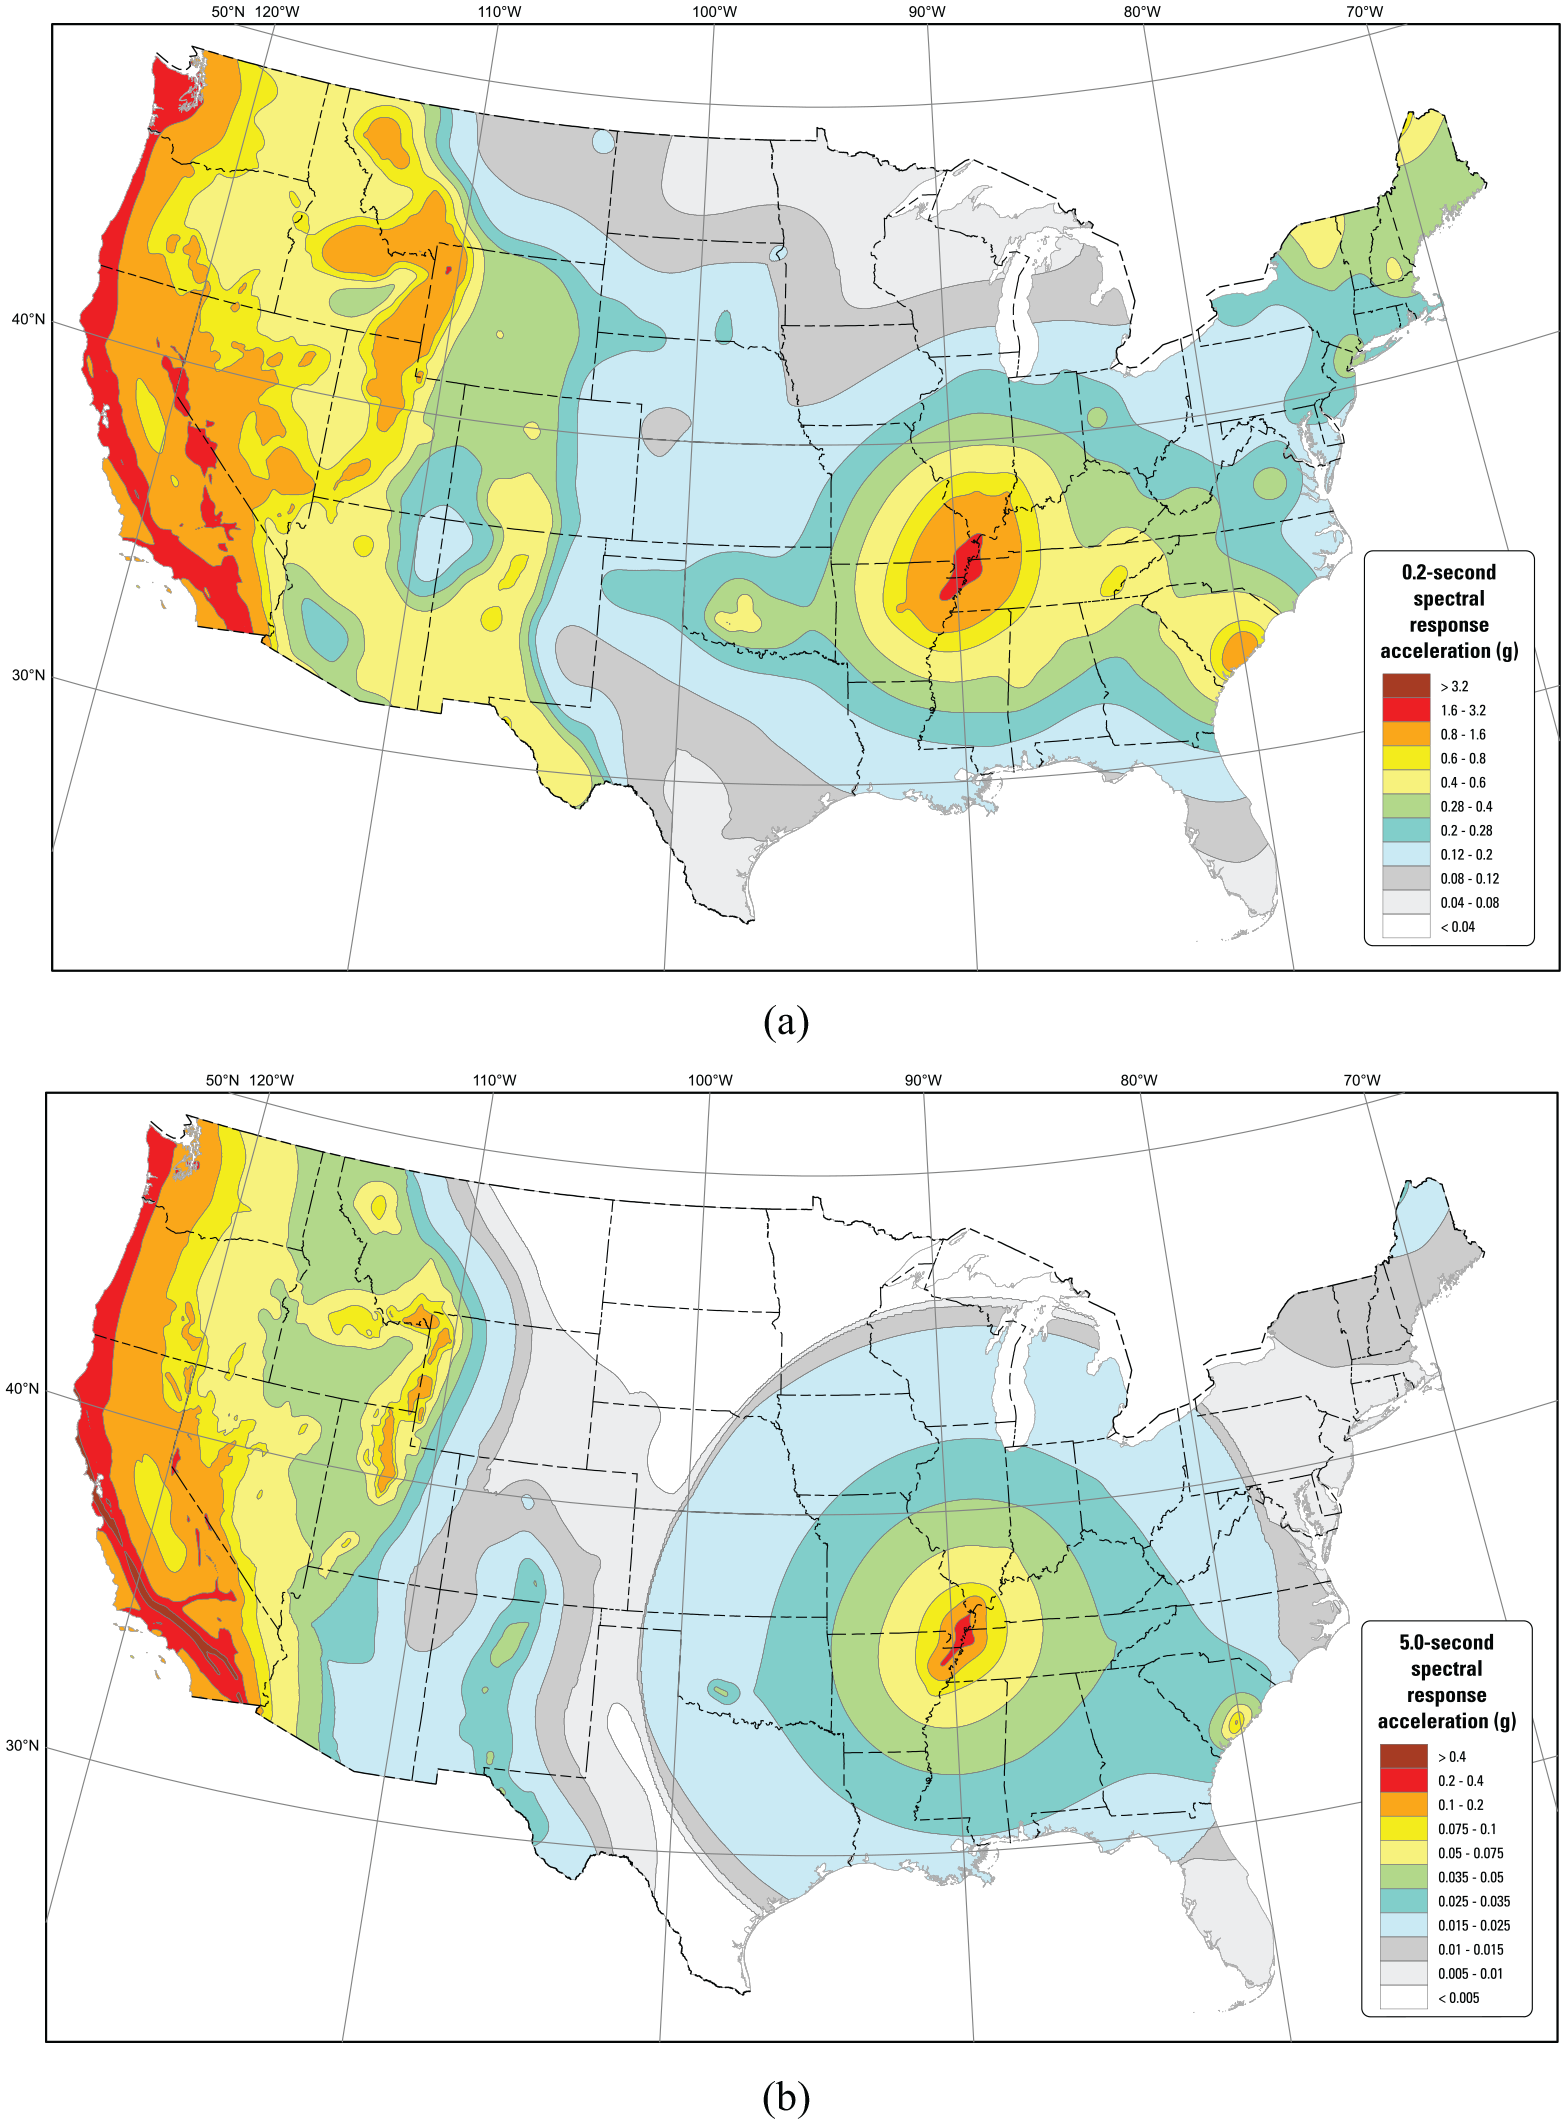
Total mean hazard for 2% probability of exceedance in 50 years at a medium dense sand or stiff clay condition (VS30 = 260 m/s) for (a) 0.2 and (b) 5 s spectral accelerations for the 2018 National Seismic Hazard Model (modified from Rukstales and Petersen, 2019).
Regional-scale uniform-hazard ground motion gridded data for WUS basins
We also calculated higher resolution hazard curves using the 2018 NSHM in four urban areas in the WUS with deep sedimentary basins. Regional scale 2% probability of exceedance in 50 years seismic hazard maps are shown for a 5 s period for a medium dense sand or stiff clay site condition (VS30 = 260 m/s) (Figure 7a to d). These maps were calculated on a 0.01°-latitude-by-0.01°-longitude grid. Amplification of long-period ground motions in deep sedimentary basins can be seen in areas throughout the four urban regions (i.e. areas colored green, yellow, and orange in Figure 7). To see a comparison of hazards in the four basins, with and without basin amplification (see Figure 9 in the work by Petersen et al., 2020).
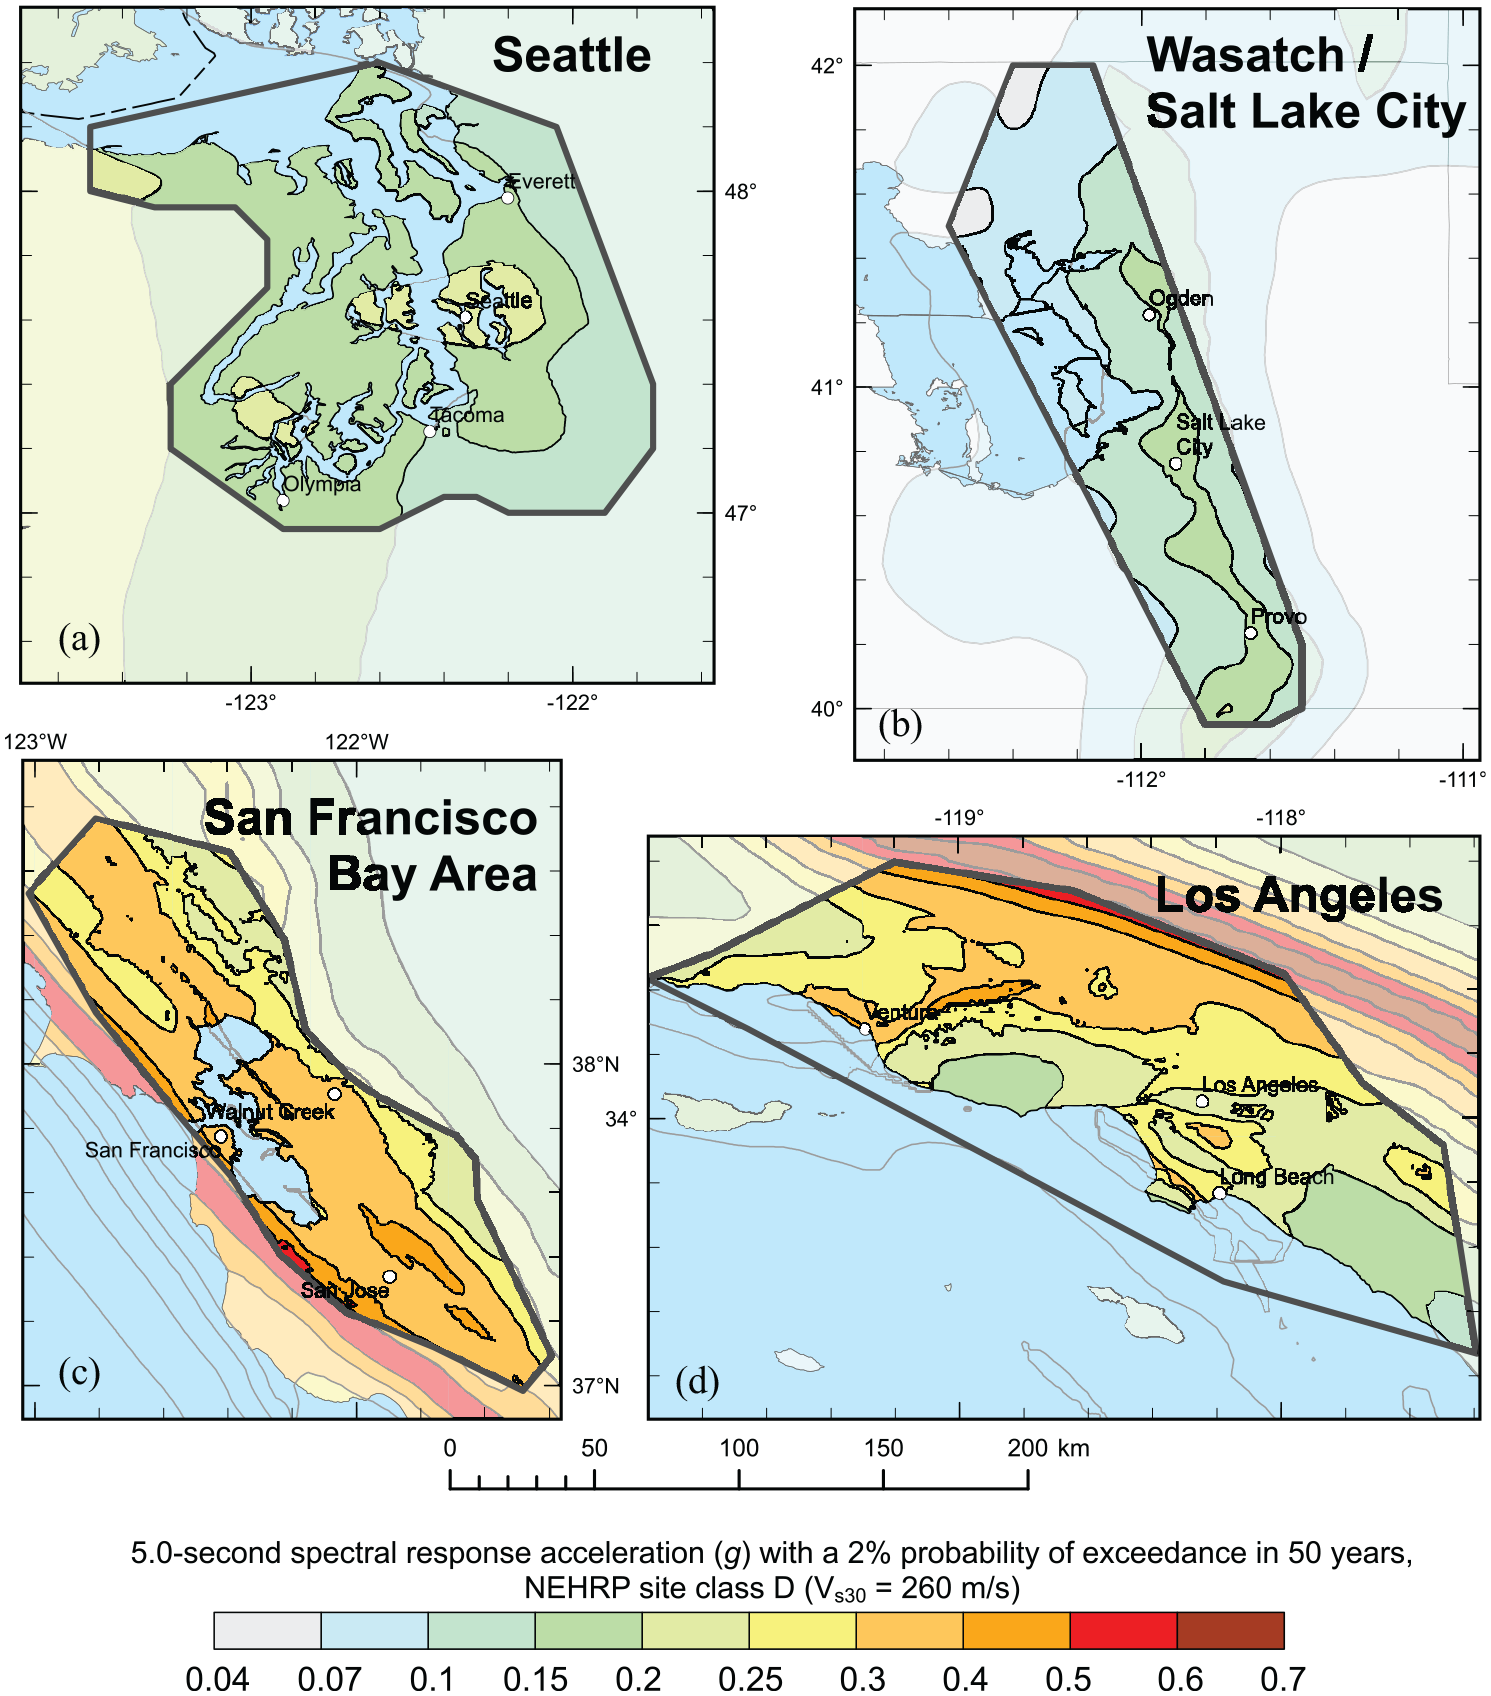
Spectral accelerations for a 2% probability of exceedance in 50 years at a 5 s period. Maps are for a medium dense sand or stiff class site condition (VS30 = 260 m/s) and consider spatially varying basin depths; maps are shown for (a) Seattle, WA, (b) Wasatch/Salt Lake City area, UT, (c) San Francisco Bay Area, CA, and (d) Los Angeles, CA.
Adoption by the building codes and other users
The design ground motions derived from the 2018 NSHM hazard curves have been accepted by the BSSC PUC for adoption in the 2020 NEHRP Provisions (BSSC, 2020). This is the first time that a building code document will be using the USGS NSHM data for all periods and site classes of interest (Kircher et al., 2019; Rezaeian and Luco, 2019). This will allow the building codes to (1) transition from using a simplified spectral shape defined at only two spectral periods to a more accurate spectral shape derived from multiple periods and (2) use site class data directly, rather than using approximate site coefficients (BSSC, 2019; Kircher et al., 2019). Other potential building code users include the American Society of Civil Engineers (ASCE), the International Code Council (ICC), the American Association of State Highway and Transportation Officials (AASHTO), and the American Railway Engineering and Maintenance-of-Way Association (AREMA).
Other users of these data include federal and state agencies (e.g. the Federal Emergency Management Agency (FEMA), the United States Army Corp of Engineers (USACE), the Nuclear Regulatory Commission (NRC), Caltrans), the insurance industry, and risk modelers. The insurance industry, which uses USGS hazard model data in their catastrophic loss modeling, does not use the hazard results directly, but uses these data as a reference for comparison. Having additional periods and site class data available will expand their reference options. Risk modelers use USGS hazard model data to evaluate the safety of building stock and infrastructure. For example, FEMA uses these data directly in their computer program Hazus® (http://www.fema.gov/hazus/) to perform annual earthquake loss analyses to assess earthquake risk to the nation, which helps communities prepare for earthquake shaking (e.g. FEMA 366; Jaiswal et al., 2017).
Conclusion
With the incorporation of new CEUS GMMs and CEUS site effect models to the 2018 NSHM, we are now able to calculate probabilistic seismic hazard curves for a full suite of 22 spectral periods and 8 site classes for the entire CONUS. These hazard curves also consider basin depths from local seismic velocity models in four urban areas in the WUS. Two sets of data are available: (1) 0.05°-latitude-by-0.05°-longitude gridded hazard data for the CONUS and (2) higher resolution 0.01°-latitude-by-0.01°-longitude gridded hazard data for four WUS basins. These datasets have been accepted by the BSSC for adoption in the 2020 NEHRP Recommended Seismic Provisions, and we anticipate these data will also be used by many other users.
Footnotes
Acknowledgements
The authors wish to thank the U.S. Geological Survey (USGS) Earthquake Hazards Program for funding the development of the additional period and site class data for the 2018 NSHM. They also thank the reviewers and editors of Earthquake Spectra, and Nicolas Luco, Jill McCarthy, and Janet Slate for reviewing this paper and providing helpful feedback for the USGS.
Declaration of Conflicting Interests
The author(s) declared no potential conflicts of interest with respect to the research, authorship, and/or publication of this article.
Funding
The author(s) received no financial support for the research, authorship, and/or publication of this article.