
Abstract
The 2017 ML 5.4 Pohang, South Korea earthquake, which caused severe damage, raised attention to the importance of the characterization of the Pohang Basin structure and the identification of active faults. We utilize 366 seismograms recorded at 102 densely deployed seismic stations during 18 microearthquakes with ML ranging from −1.11 to 1.70. We perform the P-wave seismogram method, which has been validated in various regions using seismograms for moderate earthquakes, to estimate the time-averaged shear-wave velocity from the surface to a depth of 30 m (VS30) in and around the basin. We perform multichannel analyses of surface waves at the 32 sites to obtain shear-wave velocity (VS) profiles, and additionally acquire the 22 existing VS profiles within the study area. We observe that velocity seismograms predict VS30 more accurately than acceleration and displacement seismograms do. The estimated VS30 values are in good agreement with the measured VS30 values. Approximately 93.3% of the measured and estimated VS30 values are located between the ±100% difference lines. We propose a VS30 map for the vicinity of the Pohang Basin by geospatially interpolating both the measured and estimated VS30 values, which is consistent with the local topography and geology. The proposed map exhibits areas with strong VS30 contrast within the Quaternary and Tertiary sediments, which might be attributed to the existence of faults.
Introduction
It is well known that the ground response to earthquake loadings is affected by subsurface ground conditions (e.g. reduction of ground rigidity, shallow bedrock resulting in resonance excitations, and basin edges resulting in surface wave interactions), which are often represented by the shear-wave velocity (VS). In particular, the time-averaged shear-wave velocity to a depth of 30 m (VS30) is used as a significant parameter for ground motion amplification due to the reduction in soil rigidity. In addition, abrupt changes in VS profiles can be used to identify faults (e.g. Catchings et al., 2017, 2020; Duffy et al., 2014; Ivanov et al., 2006; Lee et al., 2010; Martínez-Pagán et al., 2018). The VS profiles have traditionally been measured through invasive active-source borehole-based field tests such as suspension PS (s-PS) logging, downhole, and crosshole tests. Recently, non-invasive field tests, such as multichannel analysis of surface waves (MASW) and spectral analysis of surface waves, are widely used to measure VS profiles using both active and passive sources. However, these field tests are constrained by the condition of the test site, as well as excessive time and cost.
As an alternative, Ni et al. (2014) proposed a method to estimate the average shear-wave velocity to a certain depth of z (VSZ) using the ratio of the radial to the vertical component of the initial portion of P-wave seismograms. Kim et al. (2016) validated this method using ground motions recorded at 31 seismic stations in Central and Eastern North America. Miao et al. (2018) and Kang et al. (2020) also validated the method using 298 and 630 Japanese Kiban-Kyoshin network stations, respectively. In particular, Kang et al. (2020) proposed a VS30 map for the whole of Japan based on the P-wave seismogram method. Recently, Kim et al. (2020b) validated the method using ground motions recorded at 50 seismic stations in South Korea. All of these studies used seismograms from moderate earthquakes with moment magnitudes ranging from 2 to 5.5.
Despite the importance of VS profiles or VS30, such properties have not been well studied for most of the basins in Korea. On 15 November 2017, an earthquake with an ML of 5.4 occurred in the basin of Pohang City, South Korea, followed by 101 aftershocks with ML≥2 (Korea Meteorological Administration (KMA) earthquake data service; http://www.weather.go.kr/weather/earthquake_volcano/domesticlist.jsp). This earthquake has been gaining significant attention from geoscience and engineering communities for the following reasons: (1) it was one of the largest earthquakes triggered by enhanced geothermal systems (e.g. Ellsworth et al., 2019; Grigoli et al., 2018; Kim et al., 2018b; Lee et al., 2019; Yeo et al., 2020), and (2) it caused severe damage to buildings and grounds because of its shallow focal depth (i.e. 4 km) (Ji et al., 2021; e.g. Kang et al., 2019a, 2019b; Kim et al., 2018a, 2020a). This earthquake occurred in the middle of the Pohang Basin, which is considered to have been generated by filling with unconsolidated marine sediments from the late Early Miocene to the late Middle Miocene (Song et al., 2015). However, the details of the structure and properties of the basin have not been well studied thus far.
To facilitate the prediction of ground motion intensities and identification of faults within the basin, this study acquired 1078 ground motion recordings during 19 small earthquakes with an ML ranging from −1.11 to 1.7 from the dense recording array (i.e. 122 temporary seismic stations and one regular seismic station within a radius of 14.4 km). This study estimates VS30 at 102 stations using the P-wave seismogram method and proposes a VS30 map for the Pohang Basin. It observes the zones with sharp VS30 contrasts that are consistent with the known faults within the basin, which proves the validity of the proposed method for identifying new faults. In addition to its potential to support seismic hazard mitigation, this study is distinct from previous studies for the following reasons: (1) it utilizes records from the densely located array to create a local VS30 map and (2) it validates the use of microearthquake records for the P-wave seismogram method.
Methodology
Figure 1 shows a flow chart of the entire procedure for VS30 estimation. Signal processing, P-wave arrival time detection, and local baseline correction are described in the subsequent section, followed by another section for the methodology for VS30 estimation using P-wave seismograms.
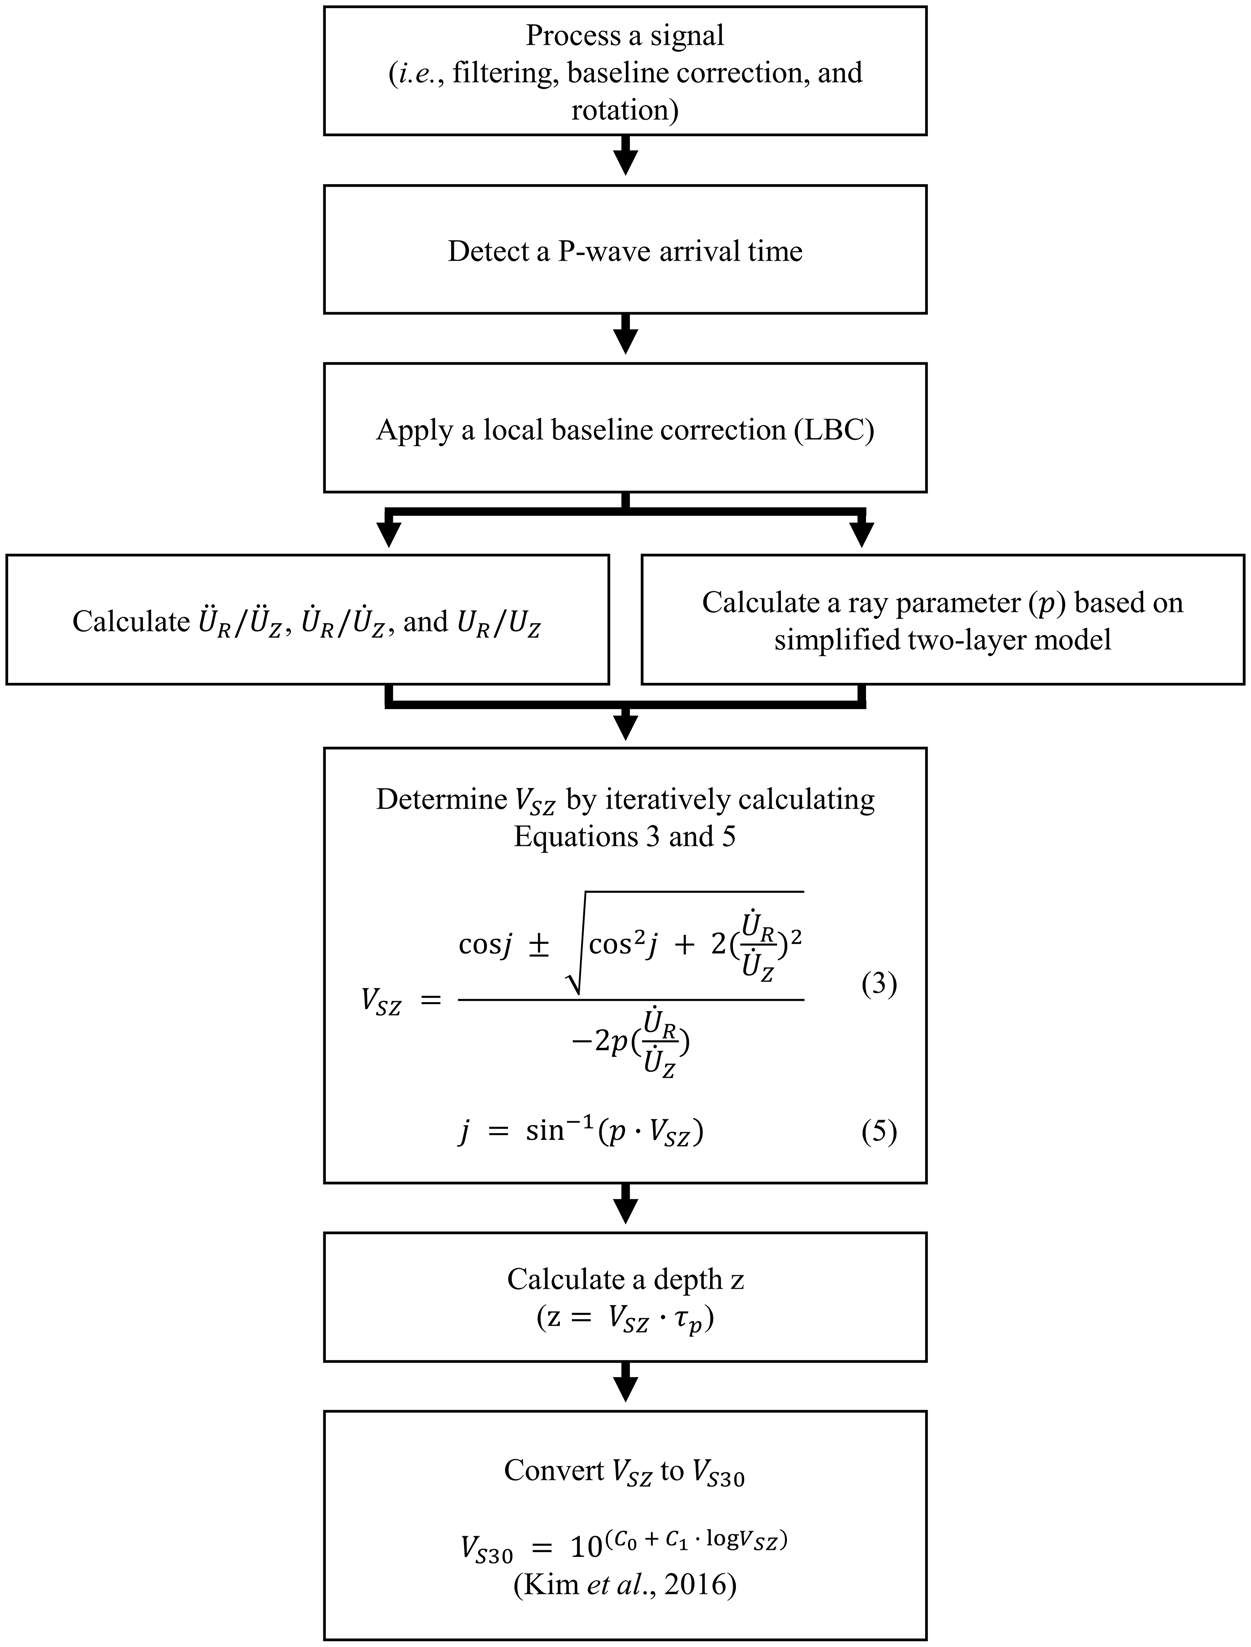
Flow chart for the procedures of VS30 estimation.
Signal processing
We followed the signal-processing procedure proposed by Kang et al. (2020). The raw seismograms were calibrated by conducting the baseline corrections. A Butterworth filter with band-pass (i.e. lower and higher cutoff frequencies of 5 and 30 Hz, respectively) was applied to the calibrated data to remove any background noise. The two horizontal components (i.e. east-west (EW) and north-south (NS)) of the records were rotated in the radial direction from the epicenter to the station. An algorithm called PPHASE PICKER (Kalkan, 2016) was used to detect the arrival time of the P-wave. When the algorithm could not detect the arrival time, we selected them by visual inspection. To calibrate the radial and vertical components more accurately, we applied the local baseline correction within a time window of 0.5 s
P-wave seismogram method
Aki and Richards (2002) expressed the displacement of the P-wave in the radial, tangential, and vertical directions (UR, UT, and UZ) on a free surface as follows:


where
The ratios of the radial to vertical components of acceleration, velocity, and displacement

Note that the ratios for acceleration, velocity, and displacement are the same. The equation for velocity can be further arranged as follows:
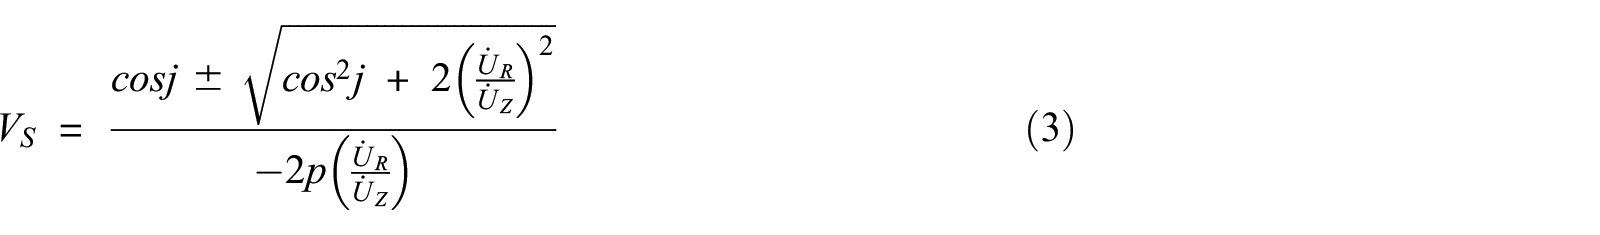
In this equation, VS is dependent on j, p, and the ratio of the radial to vertical components.
The ray parameter p can be expressed as follows:

The ray parameter p can be estimated by assuming two simplified layers from the known crustal velocity model (Kim et al., 2016). In this study, we used a crustal velocity model for Korea (Hong et al., 2017) (refer to Kim et al. (2020b) for more details on ray parameter estimation for Korea). Equation 4 can be rearranged for j as follows:

Once the ray parameter p is determined, the angle j and the shear-wave velocity can be determined by iteratively calculating Equations 3 and 5 (Kim et al., 2016). Kim et al. (2016) considered the shear-wave velocity in Equation 3 as equivalent to the time-averaged velocity for a depth z (VSZ), where z can be estimated as the product of the pulse duration of the source time function and shear-wave velocity
Note that the estimated VSZ values correspond to various depth extents. To obtain average VS values for the same depth extent, we converted VSZ to VS30, which is also a key variable for ground motion amplification. Kim et al. (2020b) confirmed that the empirical correlations between VSZ and VS30 for non-glaciated regions in Central and Eastern North America proposed by Kim et al. (2016) match with the data from Korea better than those by Boore et al. (2011) do. Furthermore, we checked that the residuals between the measured and estimated VS30 in this study were smaller when using the correlations for non-glaciated regions by Kim et al. (2016) than those by Boore et al. (2011). Therefore, we selected the correlations for non-glaciated regions in Central and Eastern North America proposed by Kim et al. (2016).
Kim et al. (2016) suggested that the P-wave pulse and pre-event noise are distinguished more clearly when using velocity seismograms than when using acceleration or displacement seismograms. In this study, we validated the use of all three types of seismograms (i.e. acceleration, velocity, and displacement).
Ground motion records
The Geophysics Research Group at Pusan National University deployed 69 and 60 temporary seismic stations in the Pohang Basin from 3 to 25 January 2019 (Phase 1) and from 27 January to 14 February 2019 (Phase 2), respectively. During these phases, 1078 ground motions were recorded at these stations and a regular seismic station operated by the KMA during 19 earthquakes. The locations of the stations and earthquake epicenters are illustrated in Figure 2a. Kang et al. (2020) reported that the P-wave seismogram method can yield over-prediction if the take-off angle is smaller than 40°. This is because the vertical components of P-wave seismograms are mostly stronger than the radial components, regardless of site conditions, if the waves are generated below the stations. Therefore, we did not consider records with such small take-off angles. In addition, we only considered seismograms with SNRs greater than unity, where the P-wave arrival times were distinguishable. This data selection resulted in 370 seismograms recorded at 50 stations operated during Phase 1 and 60 stations during Phase 2 for 18 earthquakes. The locations of the stations considered in this study are presented in Figure 2b.
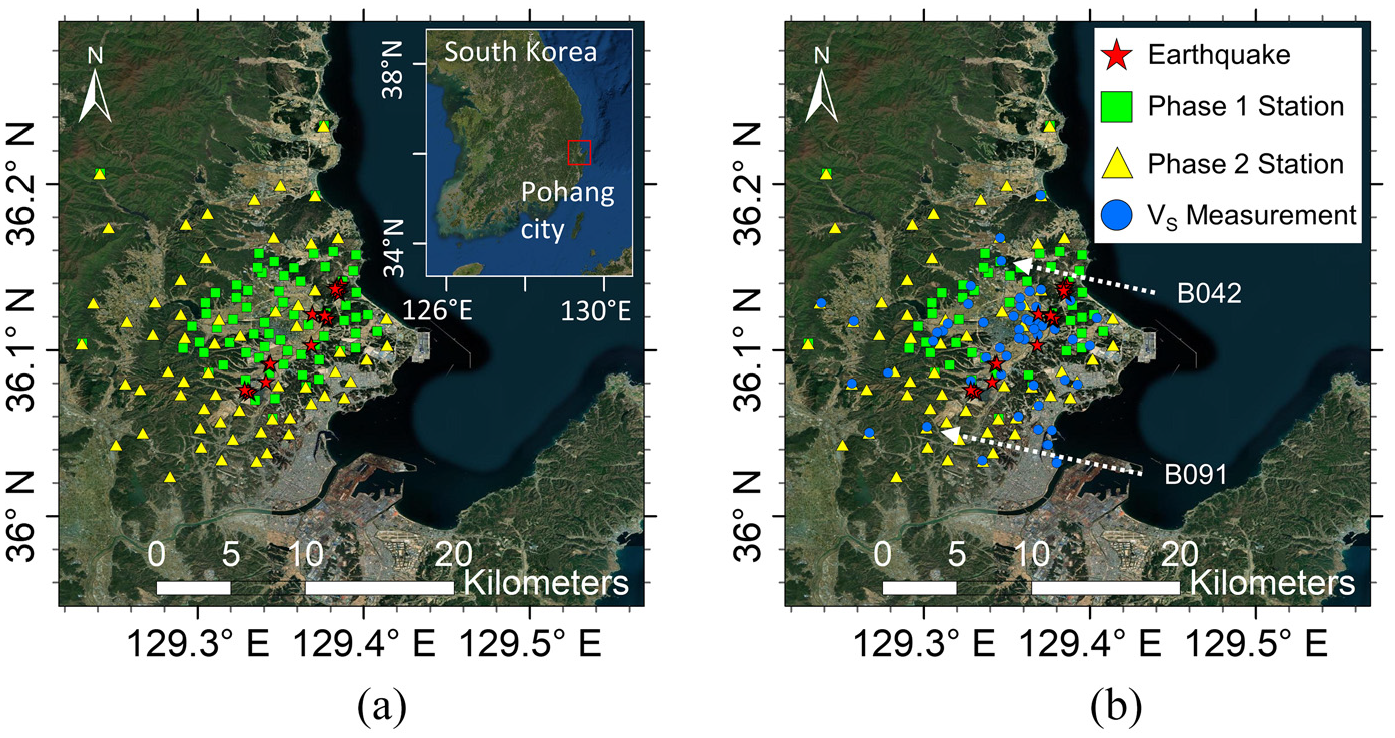
Locations of (a) seismic stations and temporary seismic stations deployed in the two phases (Phase 1: 3 to 25 January and Phase 2: 27 January to 14 February in 2019) and earthquake epicenters, and (b) the stations used in this study, as well as VS measurements.
We applied the short-term-average/long-term-average (STA/LTA) algorithm to continuous seismic data to detect potential earthquake signals (e.g. Allen, 1982; Thompson and Reyes, 2017). Potential signals with more than five triggers were manually reviewed, and 19 earthquake signals were confirmed. The P-wave and S-wave arrival times were measured from the earthquake signals. We used the Hypoellipse earthquake location software (Lahr, 1999) with a simplified one-dimensional (1D) velocity model proposed by the Geological Society of Korea (2019) to obtain the initial locations of the 19 earthquakes. We refined the earthquake hypocenters using the HypoDD method (Waldhauser and Ellsworth, 2000). Source parameters (earthquake location, time, and magnitude) of 6 out of 19 earthquakes were reported by the KMA (2018), which is responsible for routine earthquake monitoring and reporting in Korea. The magnitudes of the 13 earthquakes were determined using a simple relationship between the amplitudes of the known and unknown events:

where
The 18 earthquakes have local magnitudes ranging from −1.1 to 1.7 and focal depths ranging from 4.4 to 5.9 km, as illustrated in Figure 3a and b. The recorded ground motions have epicentral distances of approximately 3–16 km (Figure 3c), and the maximum values of the peak ground velocity (PGV) in the radial and vertical directions are smaller than 0.1 cm/s (Figure 3d). Figure 4a presents a histogram of the SNR for the 370 selected seismograms.
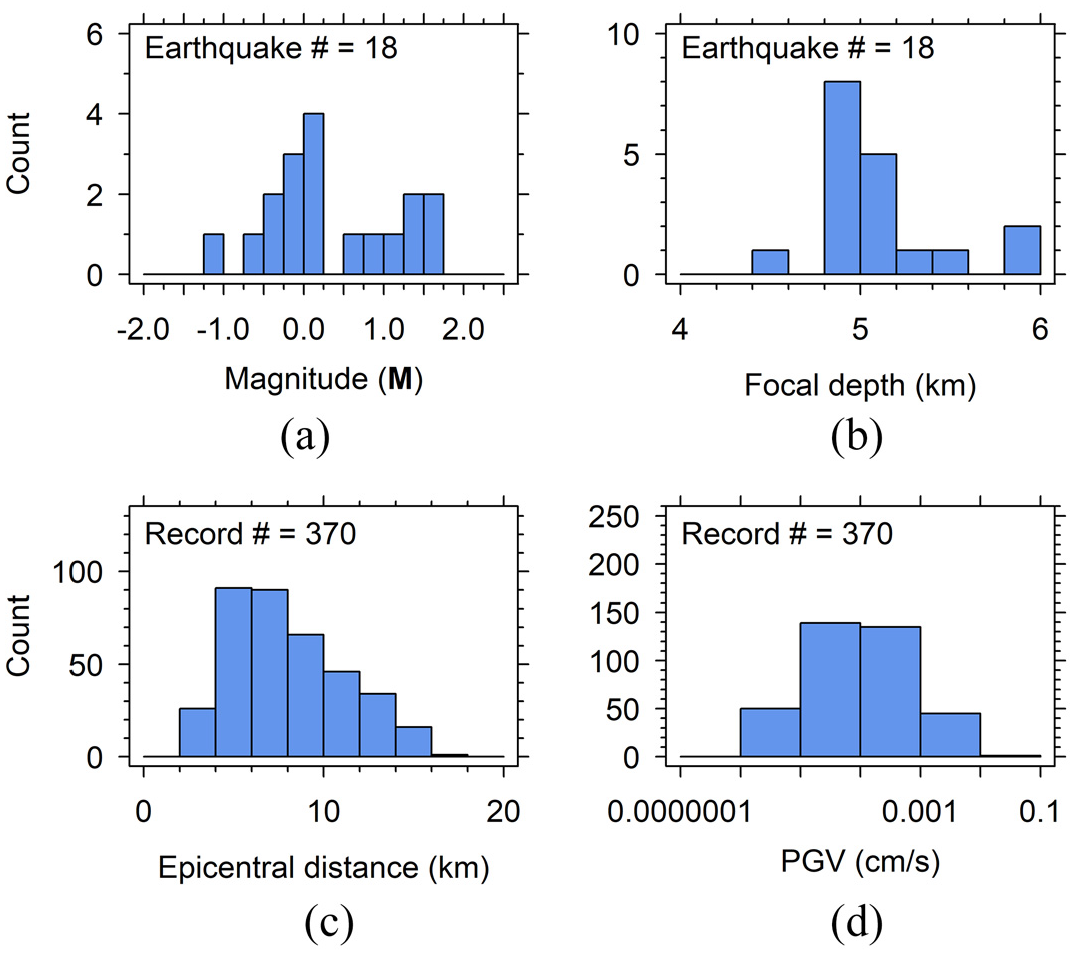
Histograms of (a) earthquake magnitudes, (b) focal depths, (c) epicentral distances, and (d) maximum PGV values of ground motions in the EW and NS directions used in this study.
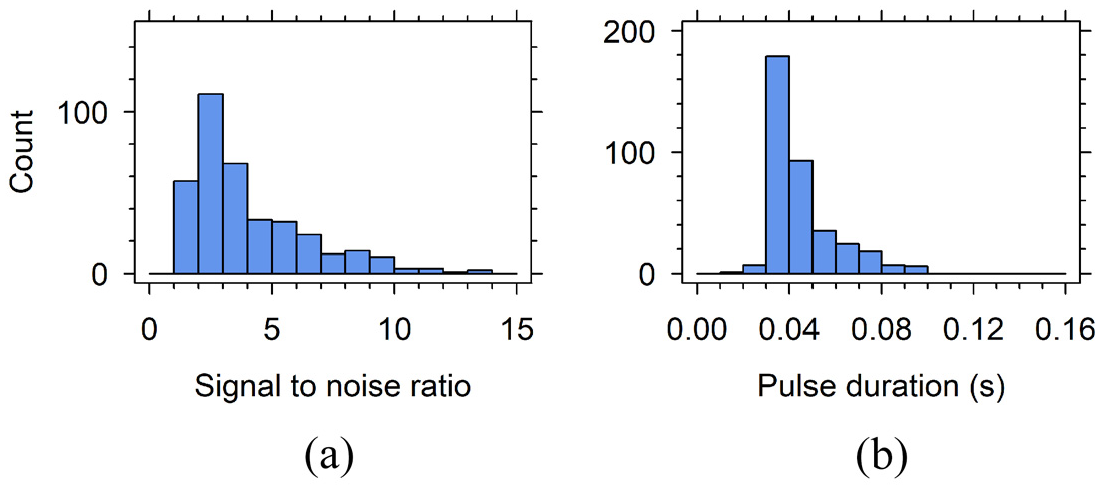
Histograms of (a) pulse durations and (b) signal-to-noise ratios of 370 recordings.
V S30 estimation
Examples
All 370 ground motions recorded at 103 stations were used to estimate the VS30. The estimation process is illustrated in the following figures: Figure 5a depicts the velocity time series in the vertical and radial directions recorded at B042 station (the location is presented in Figure 2b) during the earthquake that occurred at around 04:43 on 7 January 2019. Figure 5b depicts a blowup of the arrival time of the P-wave, which is approximately 2.665 s. We applied a local baseline correction within a time window
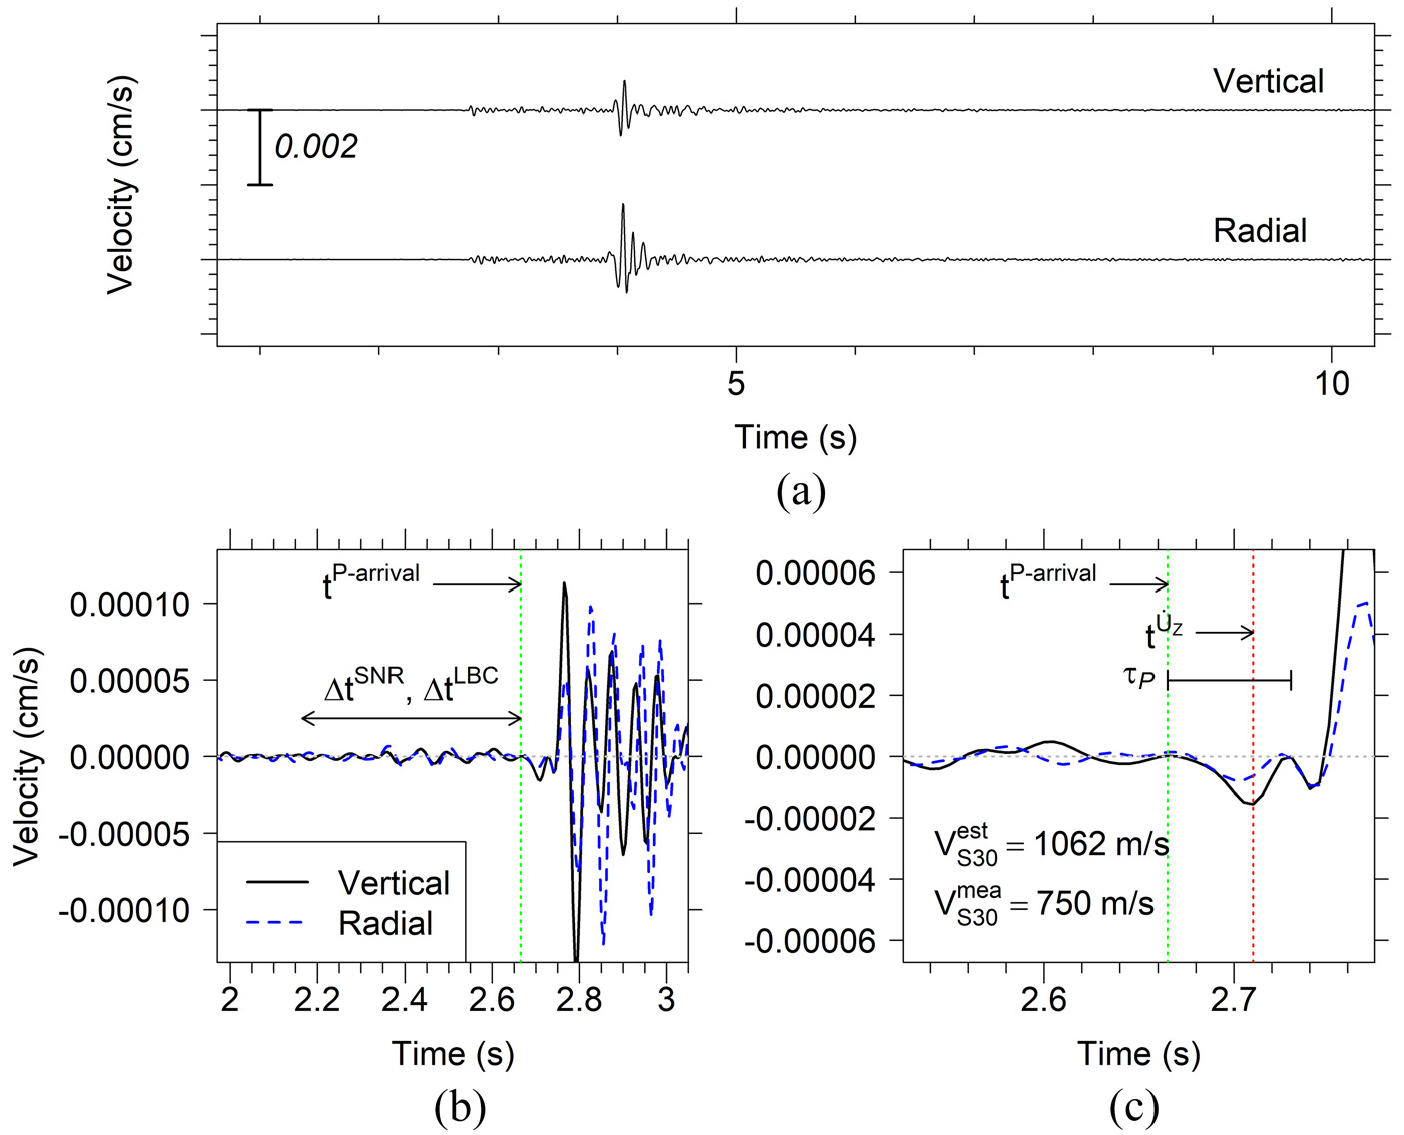
(a) Velocity time series recorded at B042 station on 7 January 2019, in the radial and vertical directions, and ((b) and (c)) velocity time series near the arrival time of the P-wave.
We measured the time width of one wavelength from the initial pulse of the P-wave
Figure 6a depicts the velocity time series in the vertical and radial directions recorded at the B091 station during the earthquake that occurred at 23:22 on 2 February 2019. Figure 6b presents a magnified view of the arrival time of the P-wave, which is approximately 3.16 s. We applied a baseline correction of a time window of 0.5 s to the velocity time series once again. We estimated the SNR to be 8.38 for this seismogram. Figure 6c illustrates the initial pulse of the P-wave. The
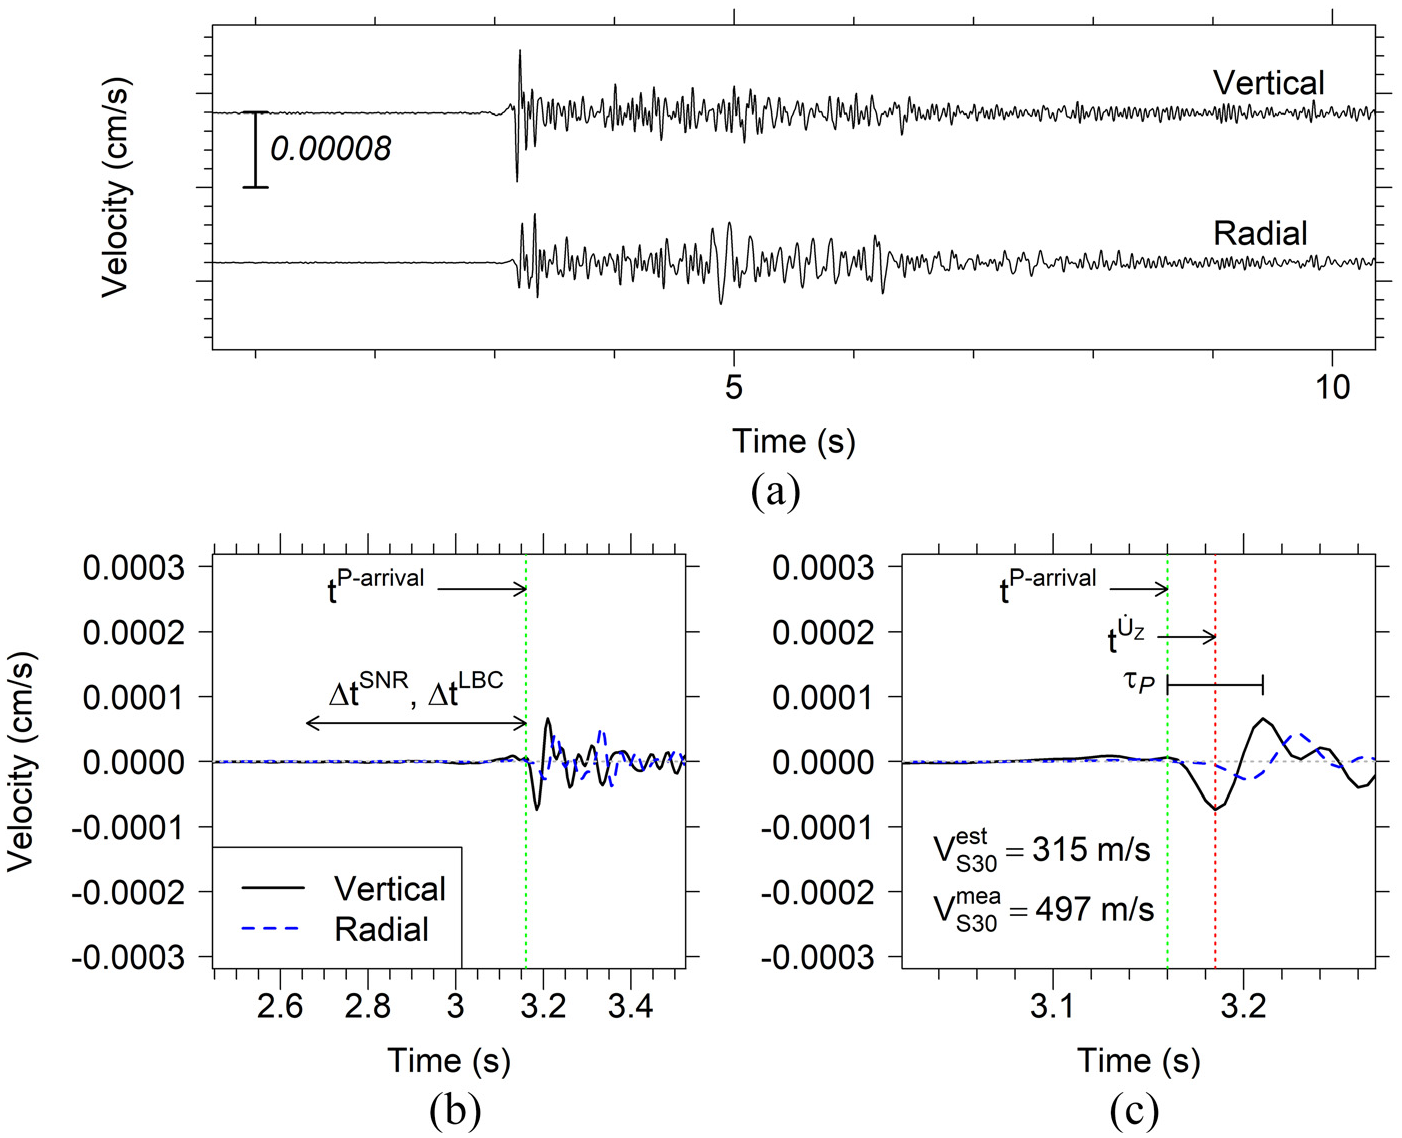
(a) Velocity time series recorded at B091 station on 2 February 2019, in the radial and vertical directions, and ((b) and (c)) velocity time series near the arrival time of the P-wave.
From these two examples, the differences between the measured and estimated VS30 are approximately 34.4% and 44.8%, respectively. These differences may be attributed to the various assumptions (such as VSZ-VS30 correlations and ray parameter estimation), epistemic uncertainty in recording seismograms, and aleatoric uncertainty of ground motions and subsurface soil layers. A systematic evaluation of the differences using all data is presented in the next section.
All estimates
The seismograms were recorded as velocity time series. However, we calculated the acceleration and displacement time series by differentiating and integrating the velocity time series, respectively, and used them to estimate the VS30 values. The VS30 values estimated from the acceleration, velocity, and displacement seismograms are denoted as
Figure 7a depicts the

VS
30 values estimated using velocity seismograms
As depicted in Equation 2, the values of


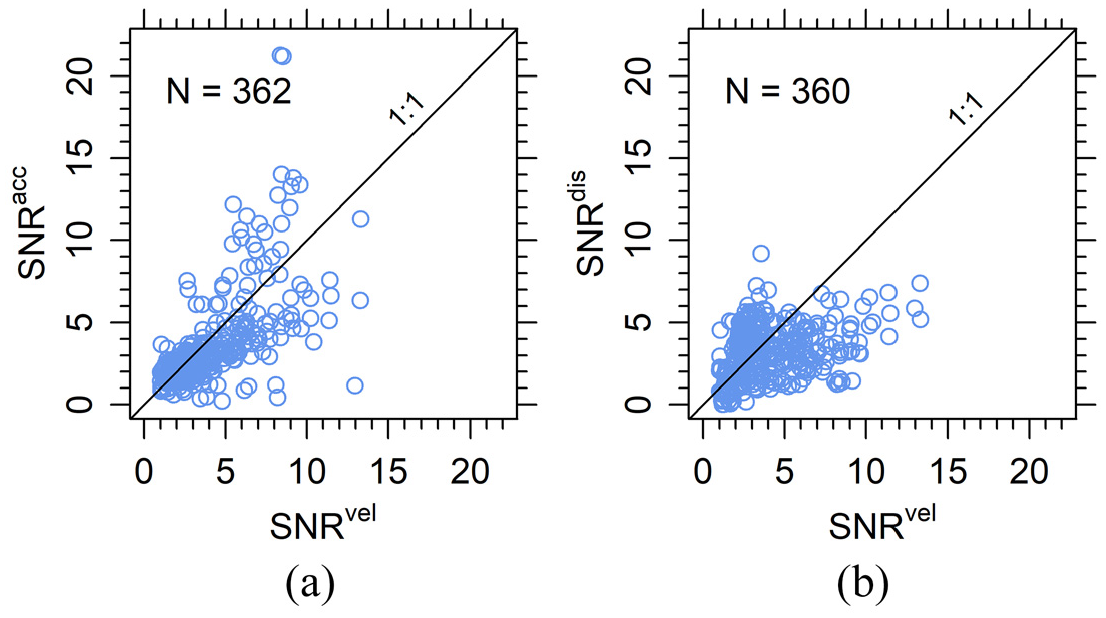
Signal-to-noise ratios of (a) acceleration seismograms (SNRacc) versus SNRvel, and (b) SNRdis versus SNRvel.
We investigated the correlations between these residuals and various other factors. The residuals are not affected by earthquake magnitude, epicentral distance, take-off angle, or geology. However, the absolute values of
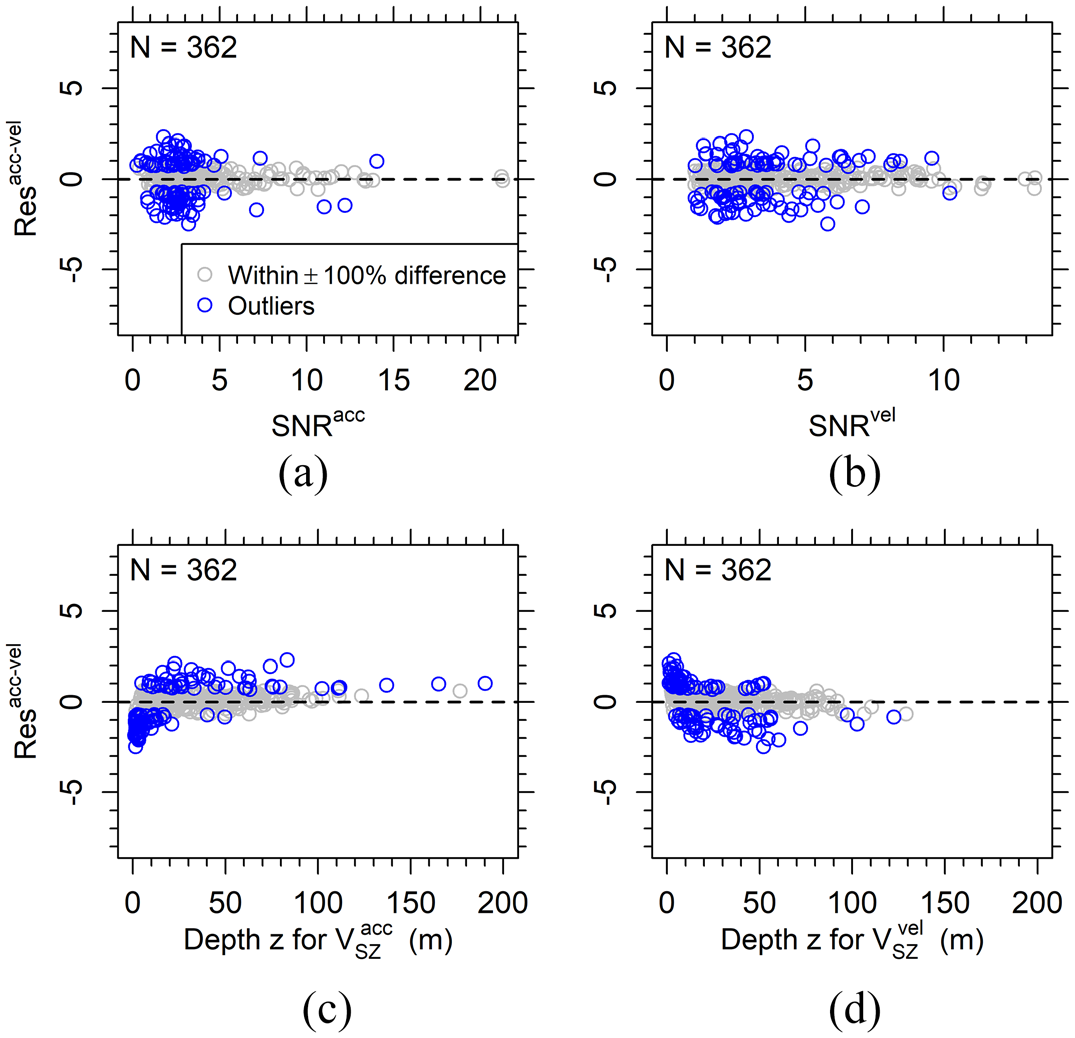
Residuals between
We used a simplified two-layer crustal velocity model for the ray parameter estimation. Using the original crustal model (Hong et al., 2017) decreased the ray parameter estimates for the 366 velocity seismograms by approximately 6.04% on average and increased the VS30 estimates by approximately 5.48% on average, which resulted in an increase in the bias for the VS30 estimates. Therefore, we maintained the use of a simplified crustal velocity model.
Validation of VS30 estimations
Vs measurements
We performed MASW at 32 sites to obtain VS profiles. We used 24 geophones with a natural frequency of 4.5 Hz, spaced at intervals of 1 or 2 m depending on the site conditions. We performed active tests using a hammer with an offset of 10 m on both sides of the array (with a total of ten stacks) and a passive test using ambient noise for each site. We used ParkSEIS v2.0 (ParkSEIS, 2016) which automatically creates a dispersion image from the recorded surface waves and determines the shear-wave velocity through the inversion process. We extracted the fundamental-mode dispersion curves by picking the phase velocities at the highest sum of amplitudes from the dispersion images and conducted inversion analyses using the algorithm proposed by Xia et al. (1999) to obtain the VS profiles. In addition, we collected the existing VS profile data: seven VS profiles measured by downhole tests, five VS profiles obtained by s-PS logging, and ten VS profiles obtained by MASW from various sources (i.e. the Geotechnical Information DB System (http://www.geoinfo.or.kr), Pohang Office of Education, National Disaster Management Research Institute (NDMI, 2018), and Korea Institute of Civil Engineering and Building Technology). The locations of all 54 VS measurements used in this study are presented in Figure 2b, and the measured values are summarized in Table 1. Among the 54 profiles, 17 VS profiles exceed a depth of 30 m. For those shallower than 30 m, the time-averaged shear-wave velocity values from the surface to the maximum possible depth were calculated and converted to VS30 values using the empirical correlation for non-glaciated regions proposed by Kim et al. (2016).
Measured VS30 values at the 54 sites, as well as the estimated VS30 values (i.e.
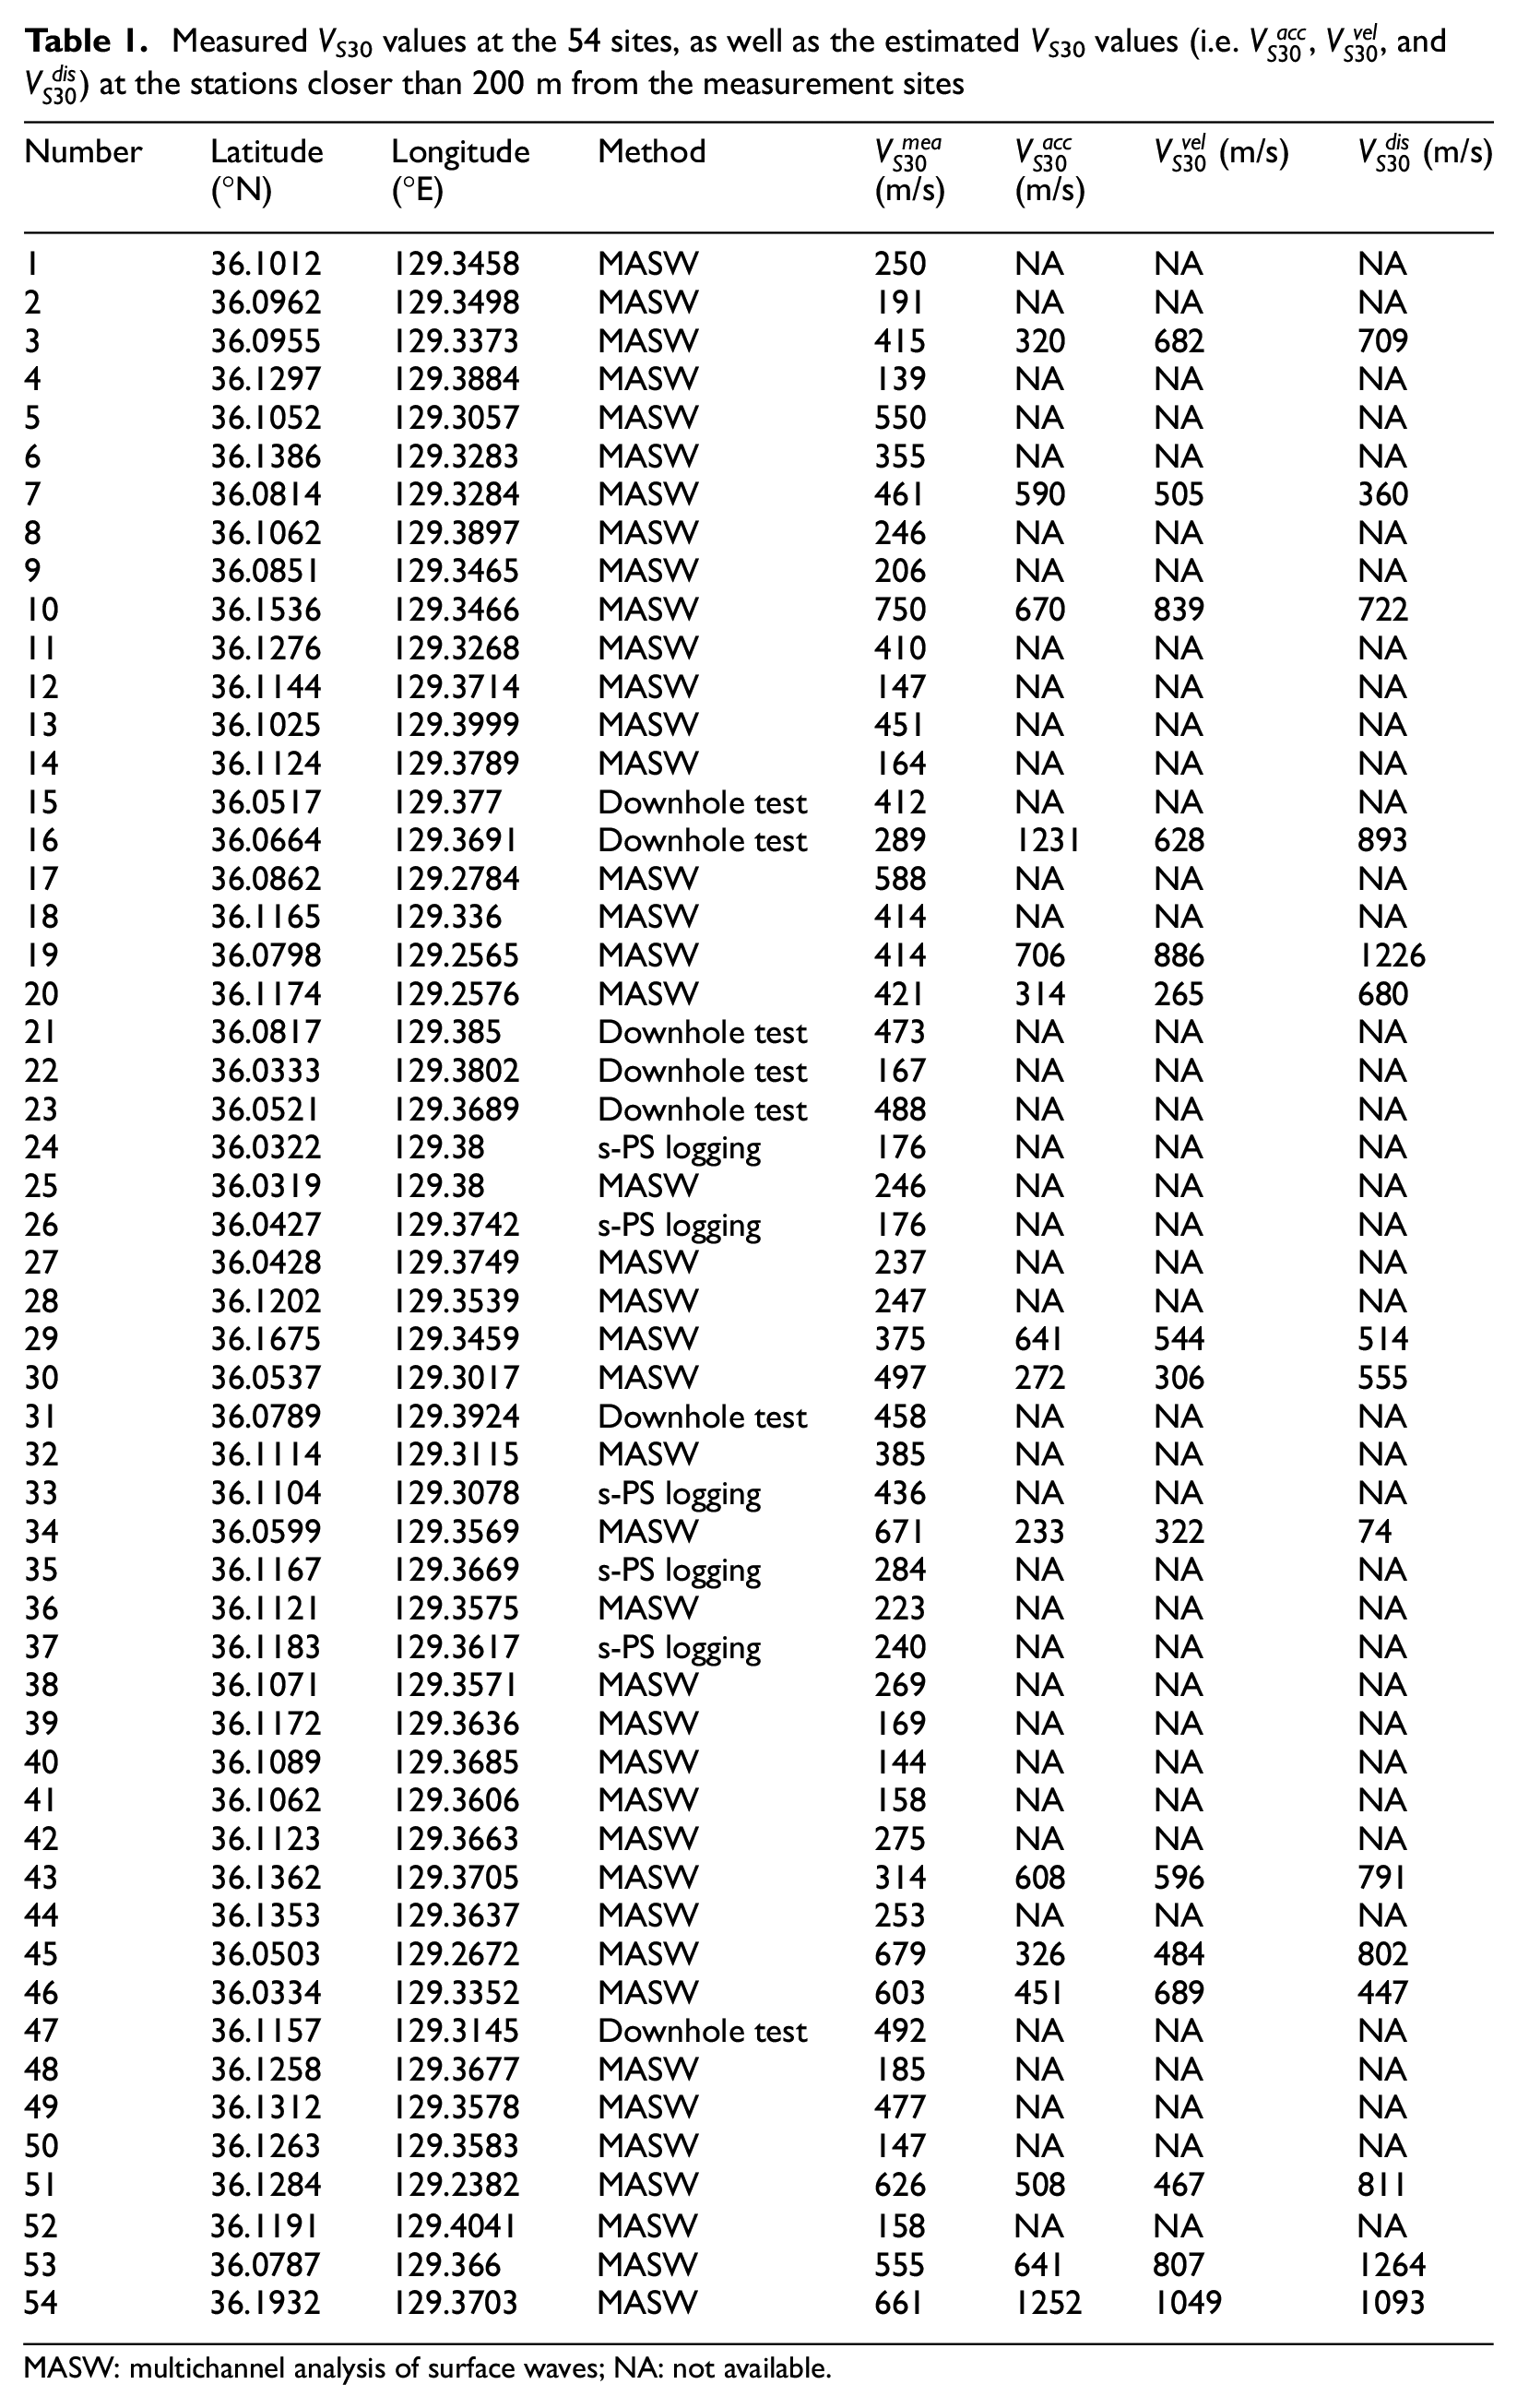
MASW: multichannel analysis of surface waves; NA: not available.
Comparison between measured and estimated VS30 values
We compared the estimated

A positive residual implies that VS30 is underestimated, and a negative residual implies that VS30 is overestimated. Figure 10a to c shows the residuals for
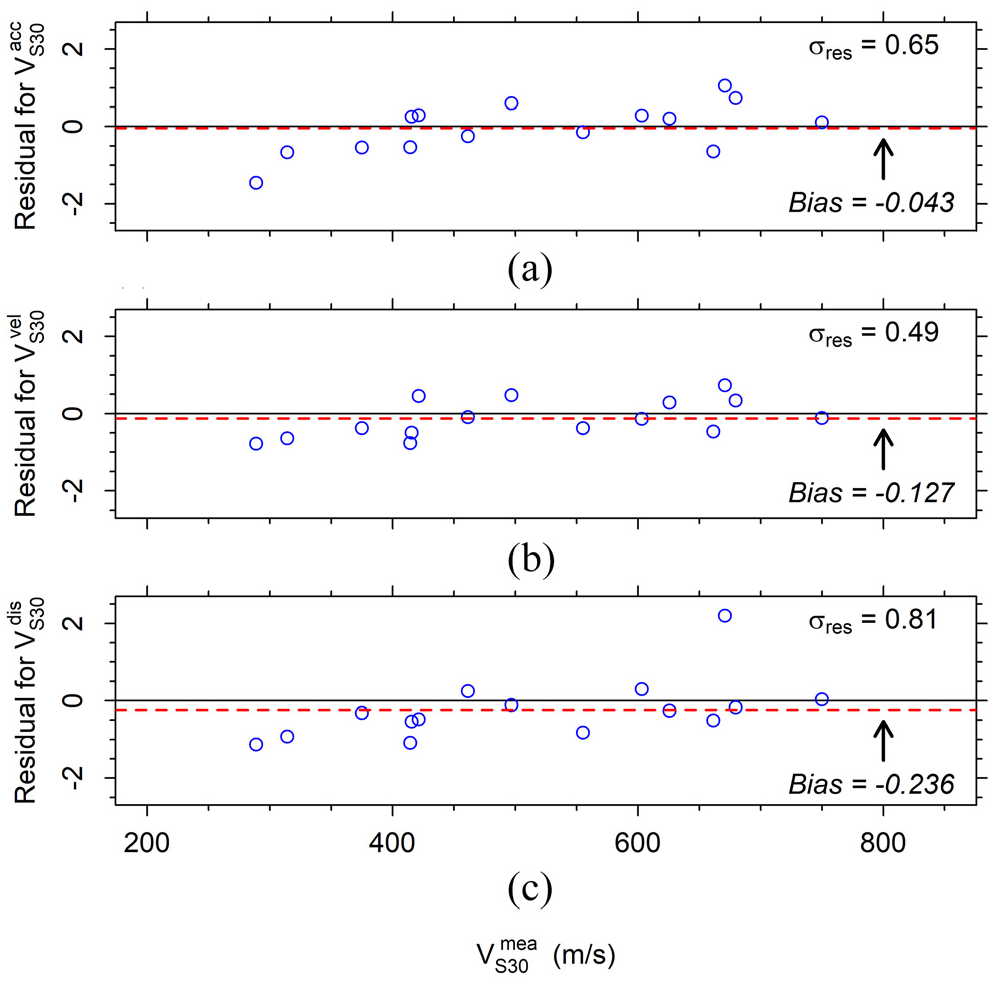
Residual for (a) acceleration
We investigated correlations of the residuals with various parameters such as magnitude, epicentral distance, take-off angle, geology, SNR, and depth z. We found that the residuals for acceleration, velocity, and displacement commonly did not show any trend with magnitude, epicentral distance, take-off angle, and geology, but exhibited specific trends with SNR and depth z. Kim et al. (2016), Kang et al. (2020), and Kim et al. (2020b) used seismograms with an SNR of 2 or higher, in addition, Kim et al. (2016) and Miao et al. (2018) used their own empirical correlations between VSZ and VS30. However, we used seismograms with an SNR of unity or higher to utilize as much data as possible, as well as the correlation between VSZ and VS30 derived from another region. Furthermore, the highly irregular basin structure in the study area might play a role in reducing precision. These factors resulted in the
We added the bias values to
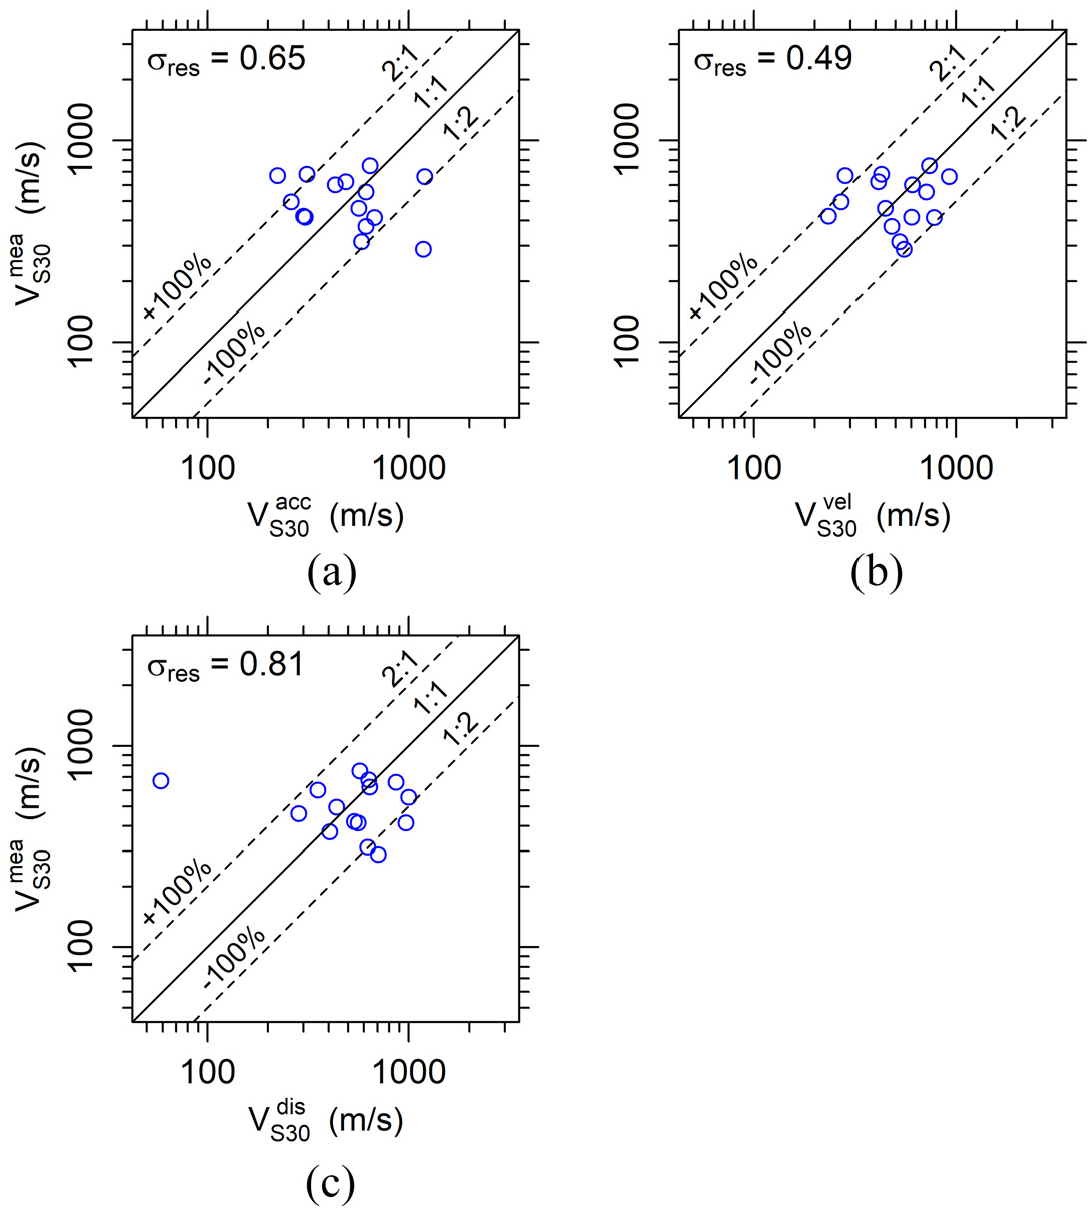
Measured VS30 versus estimated VS30 (bias-corrected) using (a) acceleration
Final VS30 map
We produced a final VS30 map by geospatially interpolating the 102 bias-corrected
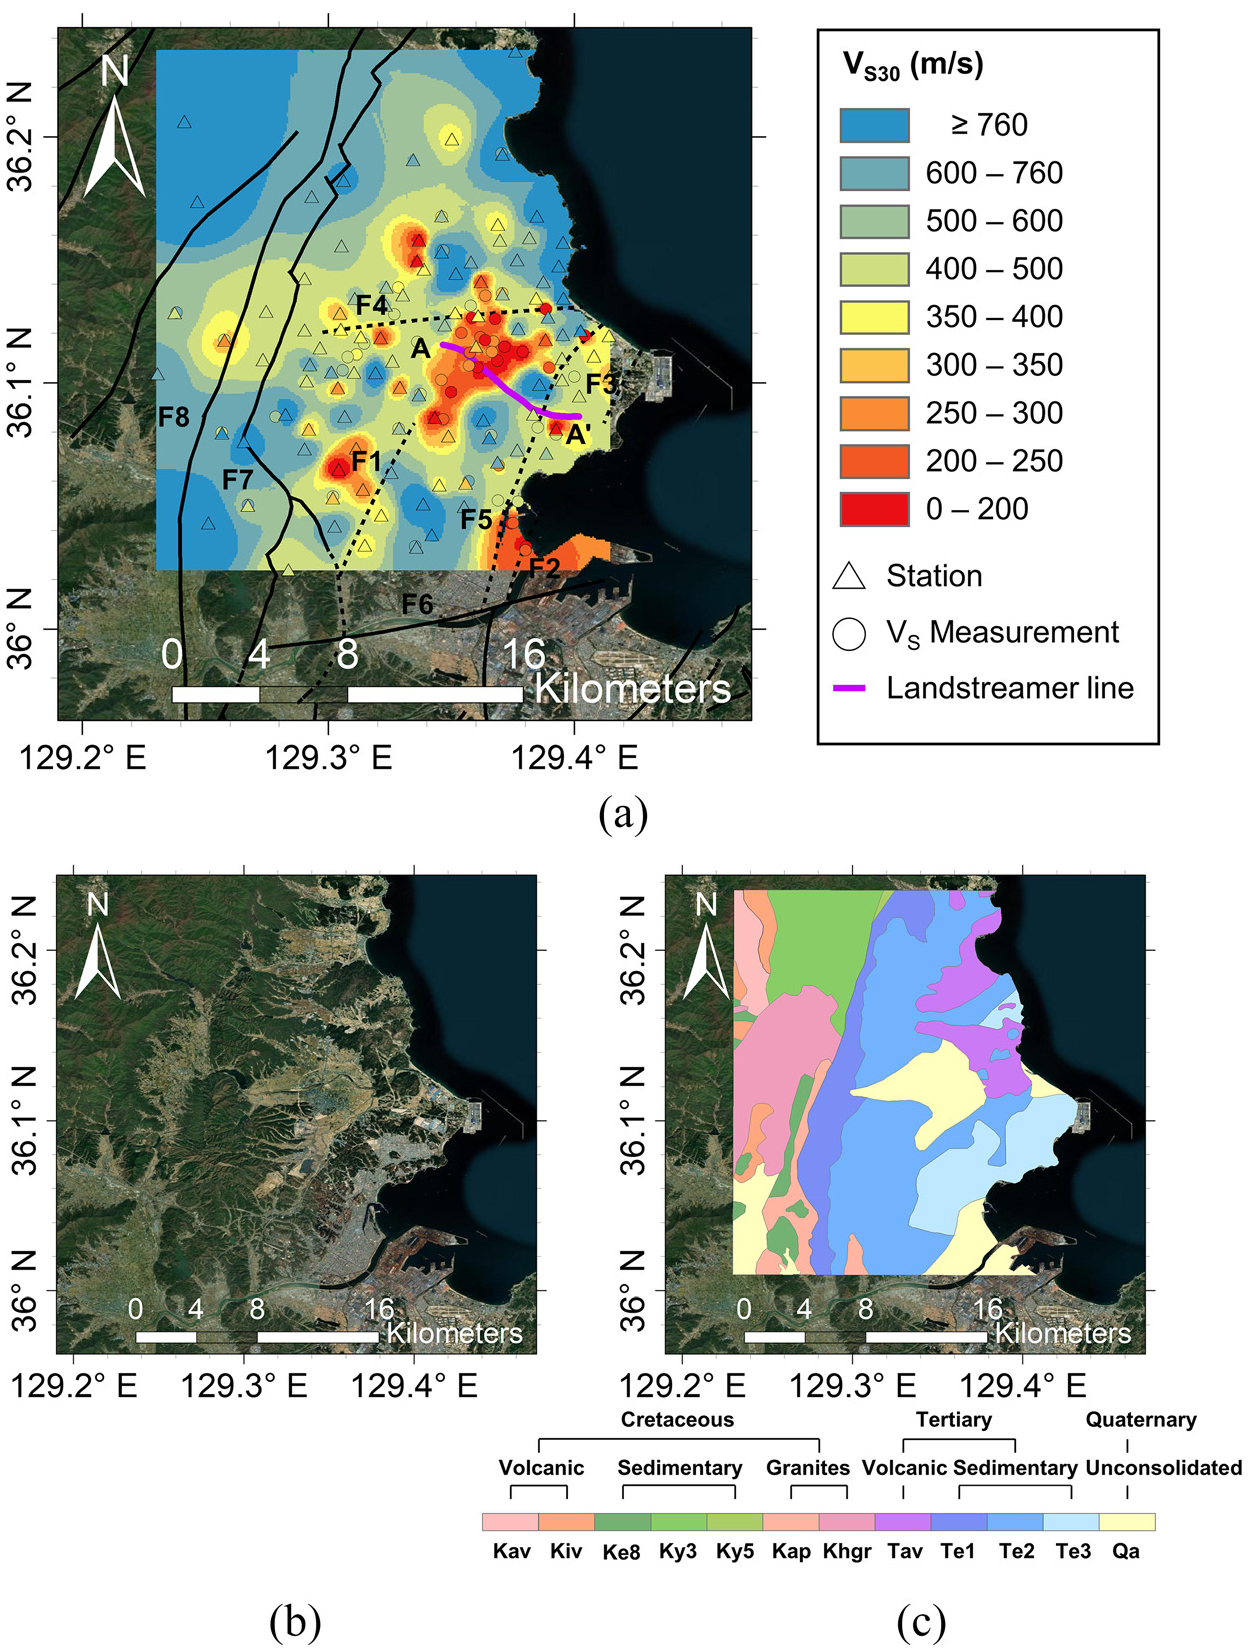
Maps of (a) the final VS30, (b) topography, and (c) geology produced by Sohn and Son (2004) in the study area. The faults identified (solid lines) and estimated (dashed lines) by Song et al. (2015) are presented in (a). The line for land streamer test (A-A’) is presented in (a).
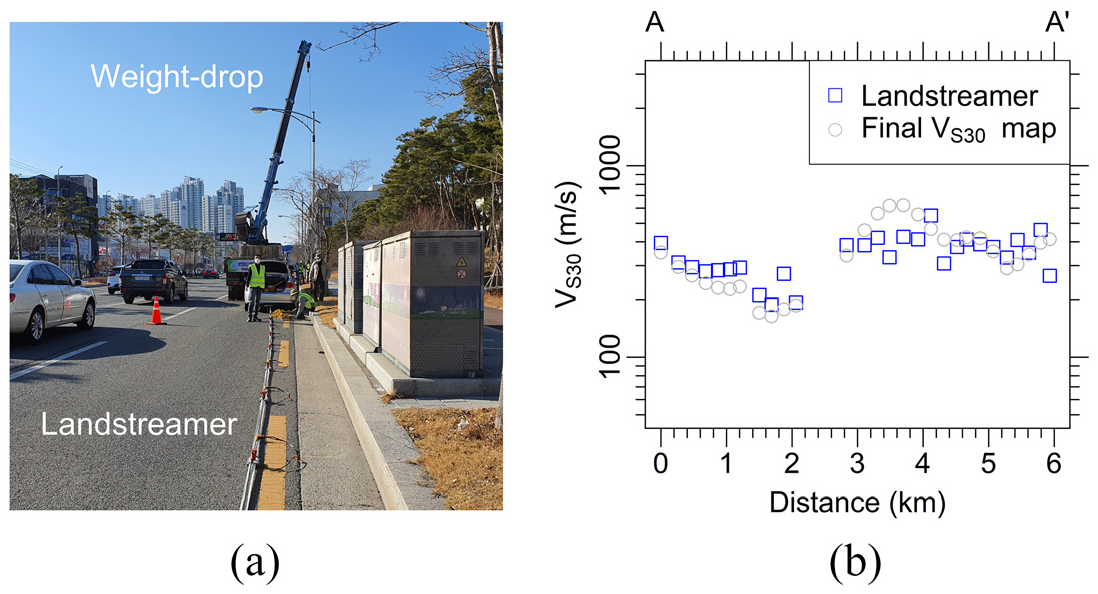
(a) Photograph of landstreamer test with a weight drop, and (b) VS30 values by the landstreamer test and the final VS30 map along the landstreamer test line (A-A’) presented in Figure 12a.
As an additional validation effort, we compared this VS30 map with the topography and geology maps produced by Sohn and Son (2004). It can be noted that VS30 values are smaller than 300 m/s in the center of the basin and flatlands, whereas they are greater than 500 m/s in the mountainous regions outside the basin (see Figure 12b). The center of the basin consists of Quaternary deposits, where the VS30 values are small, as illustrated in Figure 12c. It can be observed that the VS30 values are generally greater than 600 m/s in the Cretaceous and Tertiary volcanic rocks. The VS30 was estimated to be approximately 300–760 m/s in Cretaceous granites (Khgr). Tertiary sedimentary deposits (Te1, Te2, and Te3) generally have small VS30 values but also have values greater than 500 m/s. In particular, within the Te2 unit, zones with sharp VS30 contrasts can be observed. It is possible that these contrast zones are attributed to the existence of the estimated faults. Song et al. (2015) identified faults in and around the Miocene Pohang Basin, as depicted in Figure 12a. The zigzag-shaped western border fault (F7) of the basin was traced through fieldwork, while the intrabasinal faults (F1–F6) are buried faults that were estimated based on the depth distribution of the basin floor using deep drilling borehole data. The estimated faults (F1, F4, and F5) in Figure 12a roughly coincide with the VS30 contrast. Therefore, this VS30 map can be used to select trench locations for detailed fault investigations.
Conclusions
The 2017 ML 5.4 Pohang earthquake triggered by the enhanced geothermal system highlighted the importance of identifying faults and characterizing the Miocene Pohang Basin in Korea. The Geophysics Research Group, Pusan National University, deployed 122 temporary stations within the basin from 3 January to 14 February 2019, which can be considered a significantly dense array. We utilized 366 velocity seismograms recorded by these temporary stations as well as from one regular station during the 18 microearthquakes with ML ranging from −1.11 to 1.7 and estimated VS30 at the 102 stations in Pohang City based on the P-wave seismogram method. We only used seismogram data with an SNR > 1 and take-off angle > 40°.
Following the standardized procedure, we rotated the velocity seismograms recorded in the two horizontal directions to the radial direction, identified the maximum value of the initial pulse (
To validate the VS30 estimates, we acquired 22 existing VS profiles and performed MASW to obtain an additional 32 VS profiles within the study area. We averaged the VS30 estimates from multiple seismograms for each of the 102 stations and calculated the residuals between the measured and estimated VS30 values using the 15 VS profile data measured at locations closer than 200 m from the seismic stations. The
Through this study, we demonstrated that seismograms from microearthquakes can be used for the P-wave seismogram method to estimate VS. We also proposed a VS30 map for the basin using the seismograms recorded at densely deployed seismic stations. The findings of this study and the proposed VS30 map are expected to be useful for seismic hazard assessments and fault investigations in Korea and elsewhere.
Footnotes
Acknowledgements
The authors thank Hwanwoo Seo, Jaesung Kim, and Dr. Sinhang Kang for supporting the MASW landstreamer tests. The authors thank the two anonymous reviewers for their insightful feedback, which helped to significantly improve the manuscript.
Declaration of conflicting interests
The author(s) declared no potential conflicts of interest with respect to the research, authorship, and/or publication of this article.
Funding
The author(s) disclosed receipt of the following financial support for the research, authorship, and/or publication of this article: This study was supported by the KMA Research Development Program (KMI2018-02810-2).