
Abstract
Hatay Airport was shaken by the Mw 7.8 and Mw 7.5 Pazarcık and Ekinözü-Elbistan Kahramanmaraş earthquake sequence on February 6, 2023. Two weeks after these events, Mw 6.3 Yayladağı-Hatay earthquake shook the site again. This paper presents the results of the reconnaissance assessment of soil liquefaction at the site, focusing on mostly three aspects: (a) the seismic response of the Hatay Airport, particularly the surface manifestations of seismic soil liquefaction in the form of soil ejecta; (b) the findings of site investigation studies performed before and after the seismic events, and (c) assessments for soil liquefaction susceptibility. Among the soil ejecta samples collected, three out of five are classified as clayey sand and fall within or near the boundary of the “further studies required” region on the susceptibility charts. The remaining two ejecta samples, composed of low and high-plasticity clay soils with PI values of 31 and 36% fall within the “not susceptible” region. The deviation from the current state of knowledge might be attributed to liquefaction-induced seepage eroding clayey soils to the ground surface or limitations in the current liquefaction susceptibility assessment methods for fine-grained soils, which may not accurately delineate the boundaries between susceptible and not-susceptible zones. Determining the most likely explanation requires additional site investigation studies, including CPT soundings, extending beyond the scope of this reconnaissance study. The documented case history and assessment results are expected to enhance the understanding of seismic soil liquefaction in fine-grained soils and contribute to the development of predictive models based on case histories for assessing liquefaction susceptibility and triggering.
Introduction
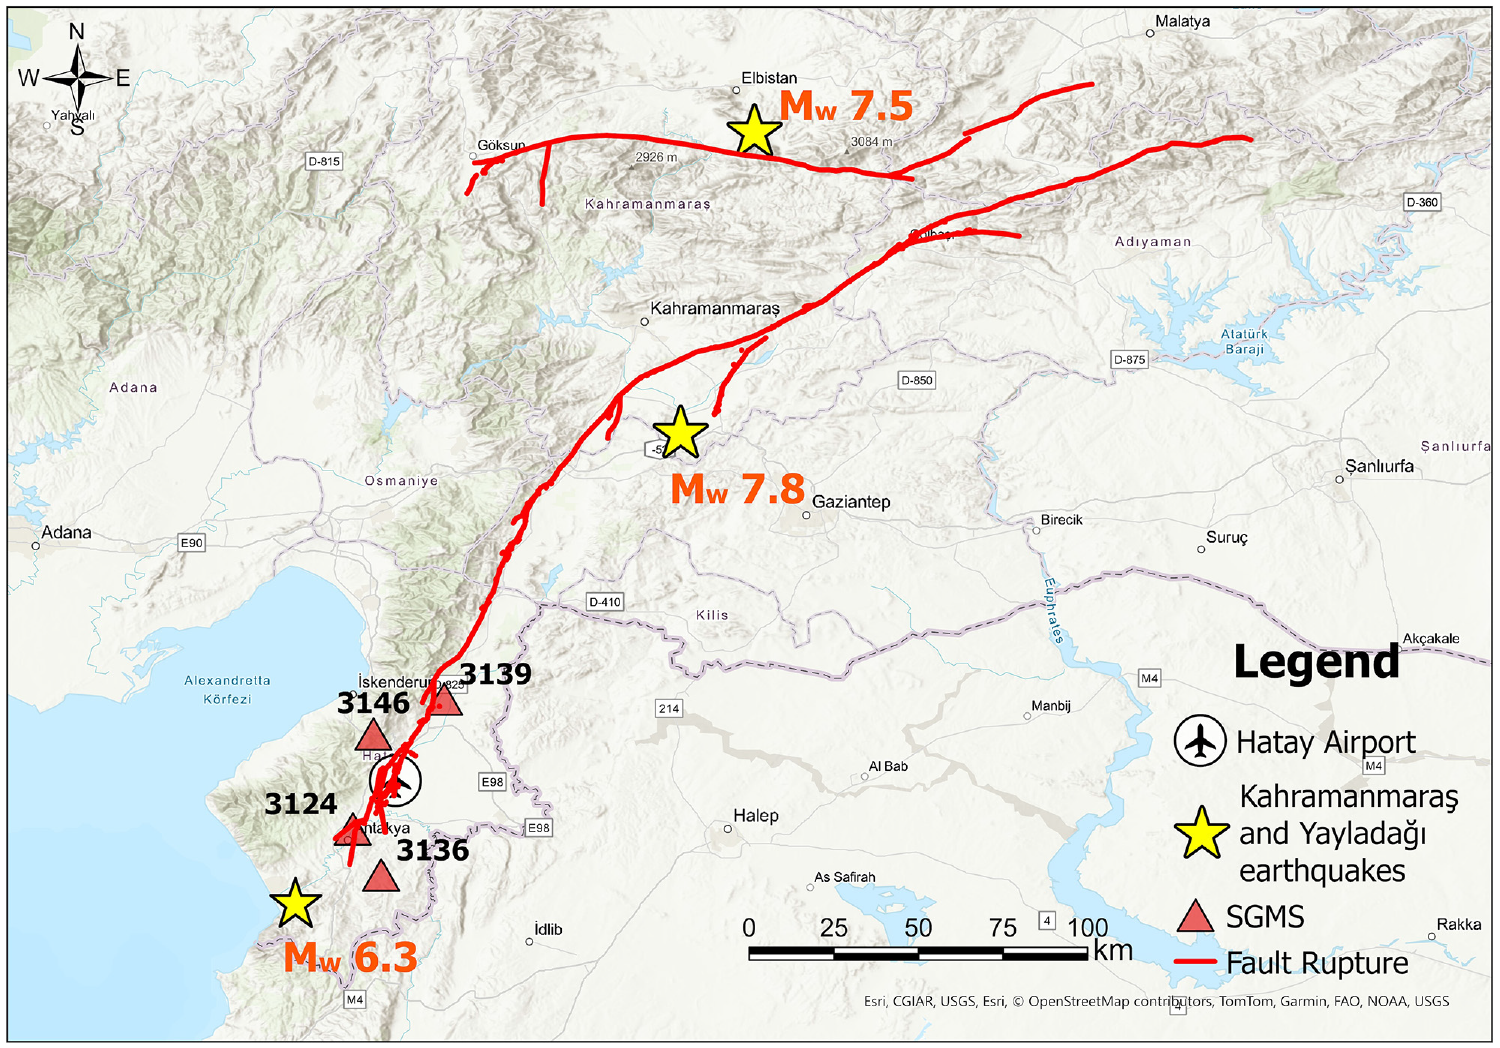
On February 6, 2023, two significant earthquakes, with moment magnitudes of Mw 7.8 and Mw 7.5 (USGS, United States Geological Survey), occurred in Kahramanmaraş-Türkiye along the East Anatolian Fault Zone (EAFZ). The first event struck at 04:17 local time, followed by a second earthquake at 13:24. Following these mainshocks, over ten thousand aftershocks were recorded between February 6 and March 1 within a 200 km radius of the epicenters. Figure 1 illustrates the spatial distribution of the mainshocks and aftershocks, depicting their induced fault rupture patterns and the locations of strong ground motion stations (SGMS). The epicenter of the first event, with a focal depth of 8.6 km, was located near Kahramanmaraş-Pazarcık, at coordinates 37.288°N and 37.043°E (AFAD, Disaster and Emergency Management Presidency). The second event, with a focal depth of 7.0 km, occurred in Kahramanmaraş-Elbistan-Ekinözü, located at 38.089°N, 37.239°E (AFAD). Subsequently, on February 20, the metropolitan city of Hatay was struck by the Mw 6.3 (USGS) Yayladağı earthquake. This earthquake occurred on the southern end of the Amanos segment, along the Antakya Fault Zone, with a focal depth of 21.7 km (AFAD). The epicenter was located at 36.037°N and 36.021°E (AFAD).
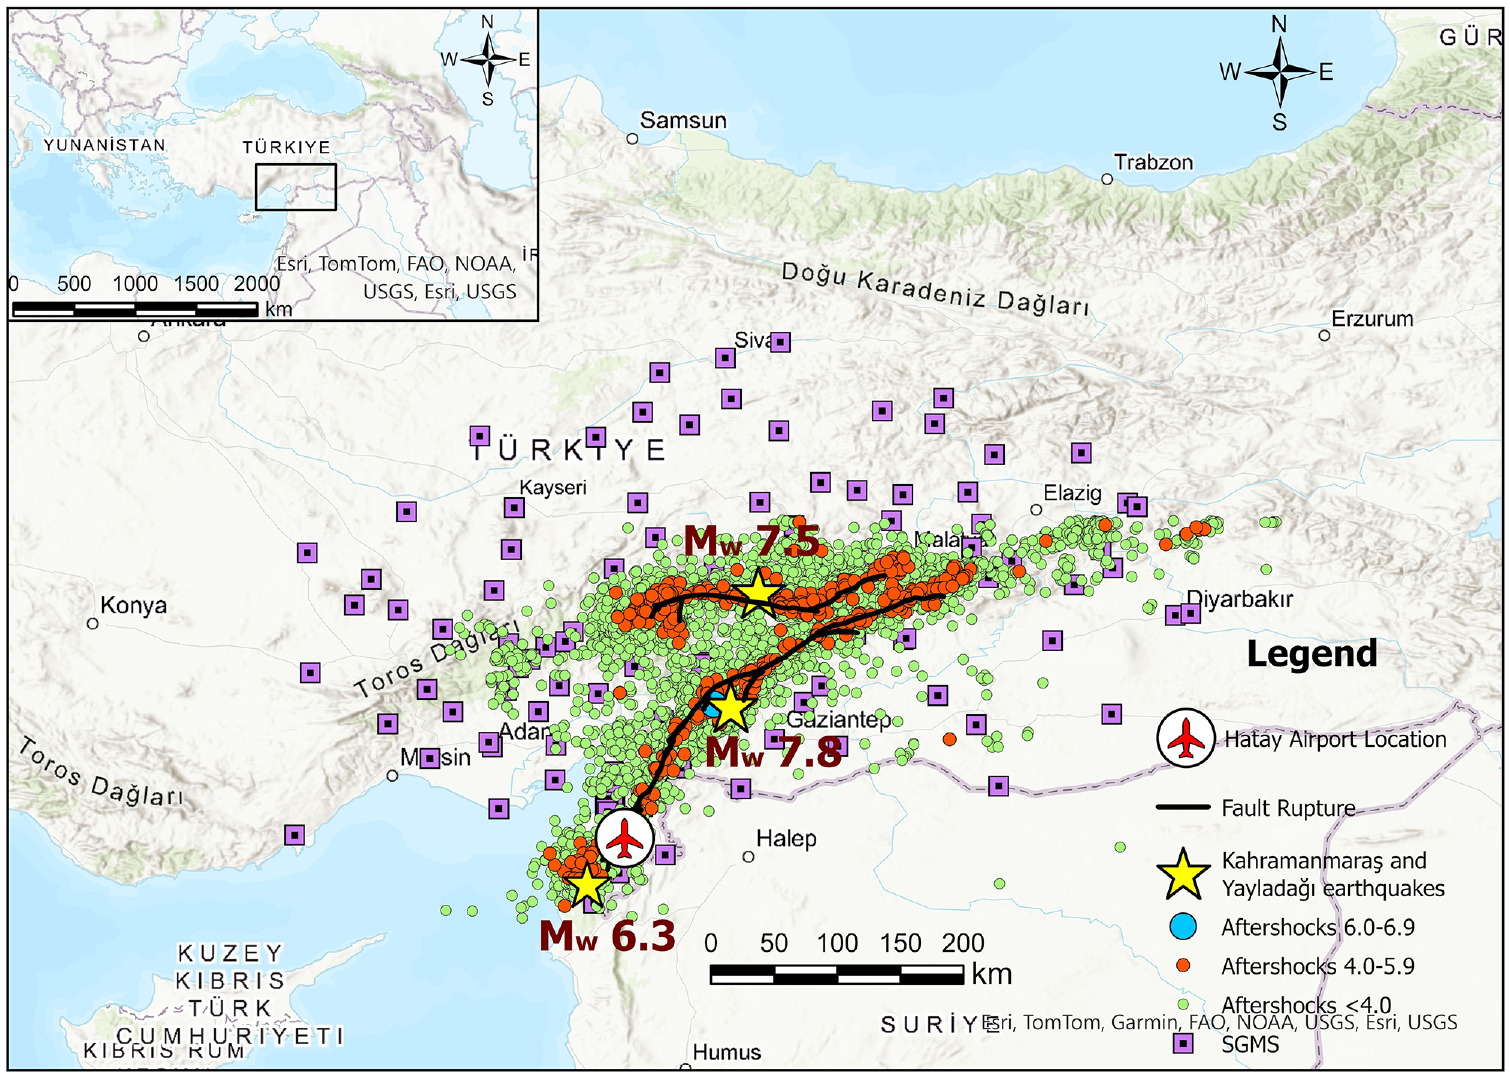
The spatial distribution of mainshocks and aftershocks (as of March 1, 2023), and the induced fault rupture resulting from the earthquake sequence in Kahramanmaraş-Pazarcık, Ekinözü-Elbistan, and Hatay-Yayladağı (base map adapted from ESRI, 2023).
During the Kahramanmaraş-Pazarcık and Elbistan-Ekinözü earthquakes, severe liquefaction events occurred along the plains and shorelines. One particularly impacted area is the Amik Plain, where Hatay Airport is located, as shown in Figure 1. The primary purpose of this paper is to evaluate the observed liquefaction surface manifestations at Hatay Airport in Antakya, Hatay. The study encompasses general reconnaissance findings, as well as results from site investigations and laboratory tests. These investigations and laboratory test results form the foundation for assessing soil liquefaction susceptibility.
Site description, geological and seismotectonic settings
Hatay Airport, operational since 2007, is located in the downtown district of Antakya within the metropolitan city of Hatay. It lies approximately 20 km north of Antakya and 25 km southeast of Iskenderun. The plan view of the airport is shown in Figure 2. The terminal area, serving both domestic and international flights, covers 46,826 m2 with an annual passenger capacity of 4,000,000. The airport was founded on the former Lake Amik, which underwent gradual transformation into a plain starting from the 1940s. This transformation occurred as the lake was drained into the Asi (Orontes) River, aiming to enhance agriculture production capacity (Kilic et al., 2006).
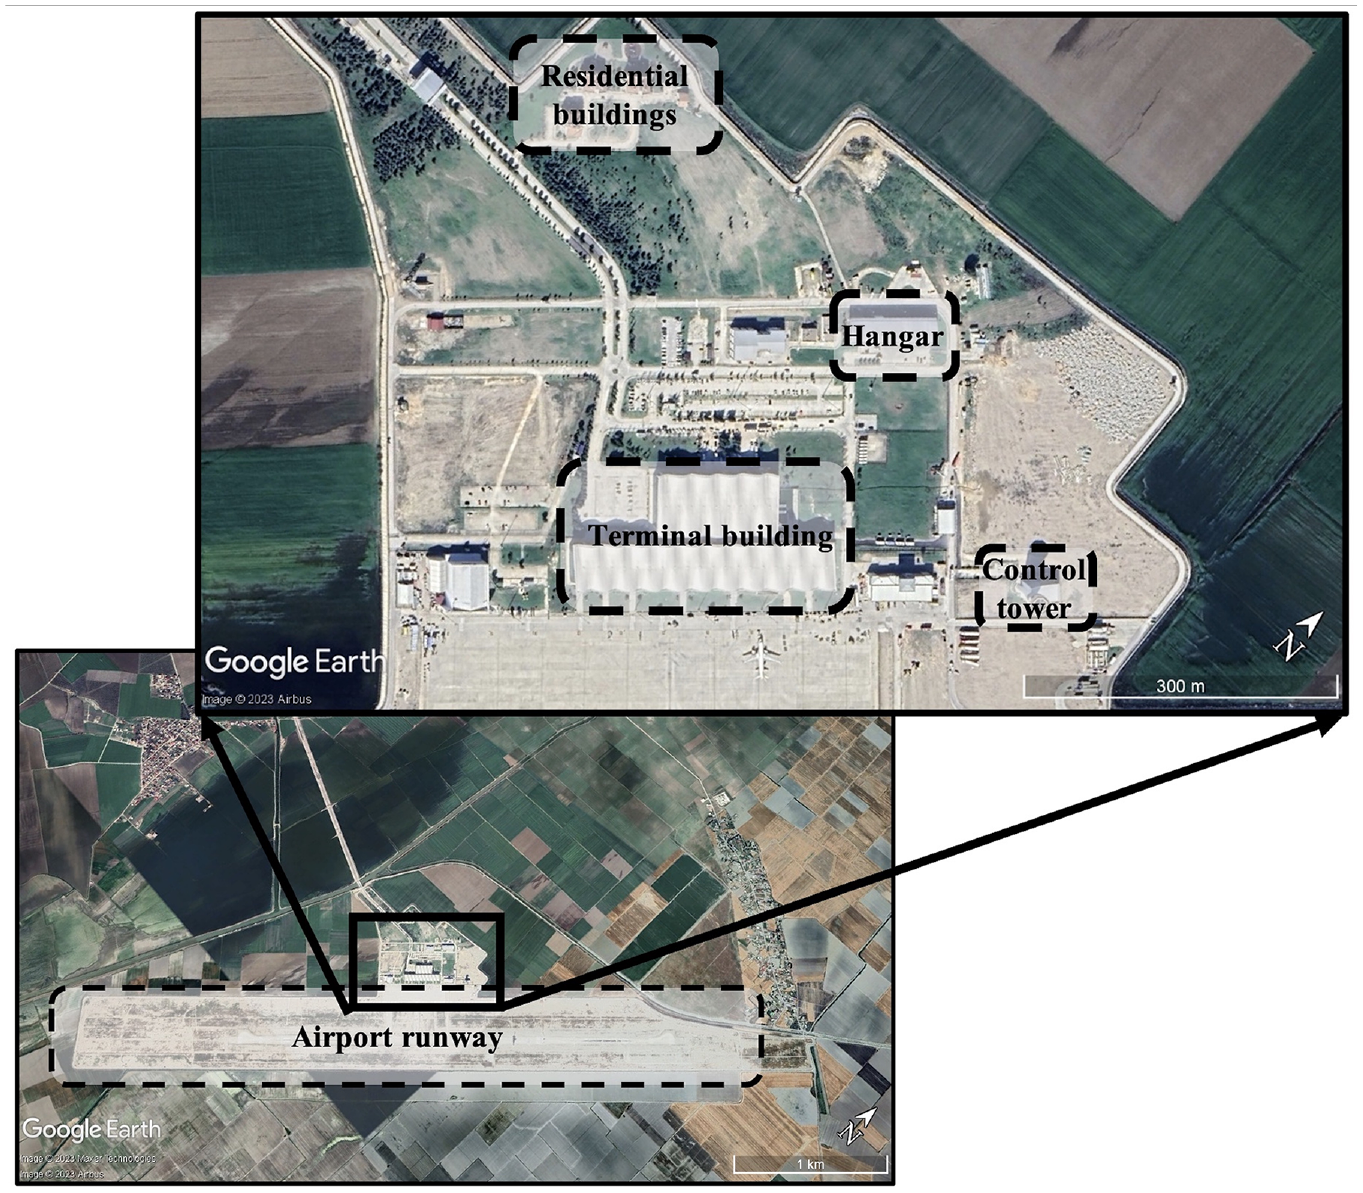
Plan view of Hatay Airport.
The Amik Plain has a history of recurrent floods, with notable occurrences in 2012 and 2019. These floods, often triggered by heavy rainfall and rapid snowmelt, have affected vast areas spanning tens of thousands of hectares across the plain. The inundation has impacted agricultural lands, roads, bridges, and settlements near the Hatay Airport runway and apron. To safeguard Hatay Airport from flooding, protective measures were implemented, including the construction of 10-meter-long slurry trench walls along the facility’s perimeter. Additionally, the facility employs deep water wells to control seepage-induced flows. Figure 3 provides an aerial picture taken in January 2019, following a recent flooding. In the aftermath of the 2023 earthquake sequence, there were observations of modest ponding induced by both flooding and liquefaction near the facility, notably along the edges of access road embankments.
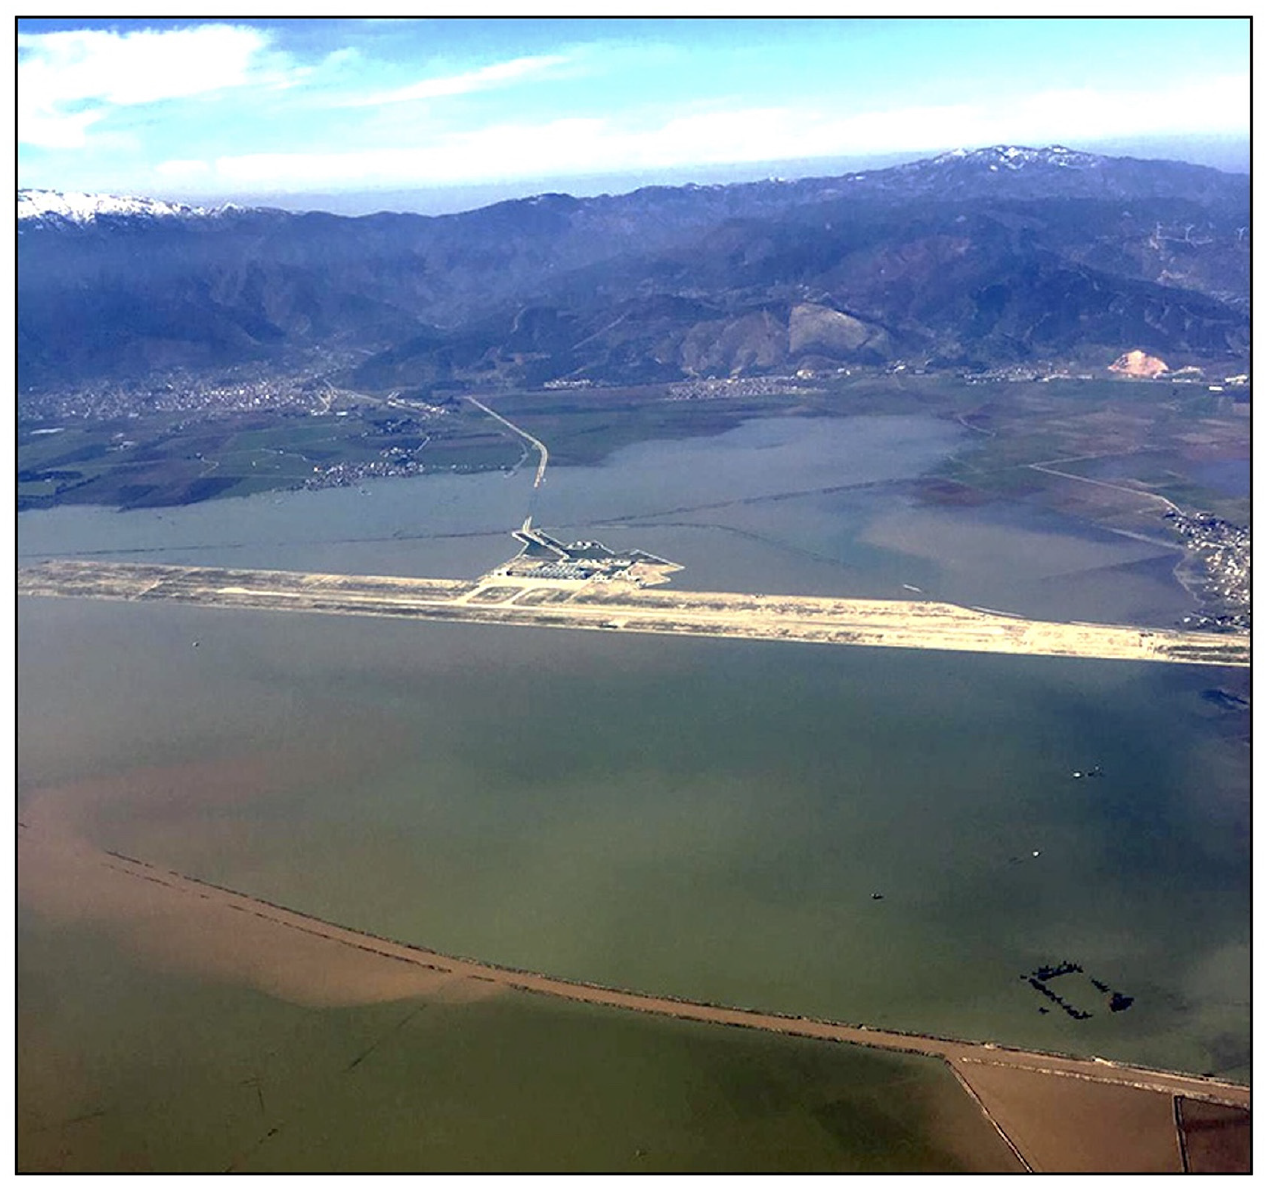
Aerial view of Hatay Airport in January 2019 after flooding (adapted from airporthaber.com).
Figure 4 shows the geological map of the region, sourced from the General Directorate of Mineral Research and Exploration (MTA, 2002). The oldest geological unit in the area is the Kızıldağ ophiolite, dating back to the Upper Cretaceous period. The allochthonous units of the Kızıldağ ophiolitic sequence overlap transgressively with younger autochthonous units, such as Upper Cretaceous to Eocene detritals. Additionally, there are neritic limestones from the Eocene period, situated in the northeastern part of the airport. These neritic limestones are unconformably overlain by Miocene neritic limestones, transitioning into Miocene detritals and carbonates, consisting of sandstone, clayey limestone, marl, and shale sequences, predominantly located in the northwest of the airport (Ateş et al., 2004; Selçuk, 1985). Above these formations, there are Pliocene-aged continental detritals consisting of conglomerate, sandstone, clayey limestone, gypsum, and interbedded sandstone-shale sequences occurring unconformably (Ateş et al., 2004). The youngest units in the area are alluvial deposits from the Quaternary era, which are extensively distributed throughout the study area, especially in the plains and valley bottoms.
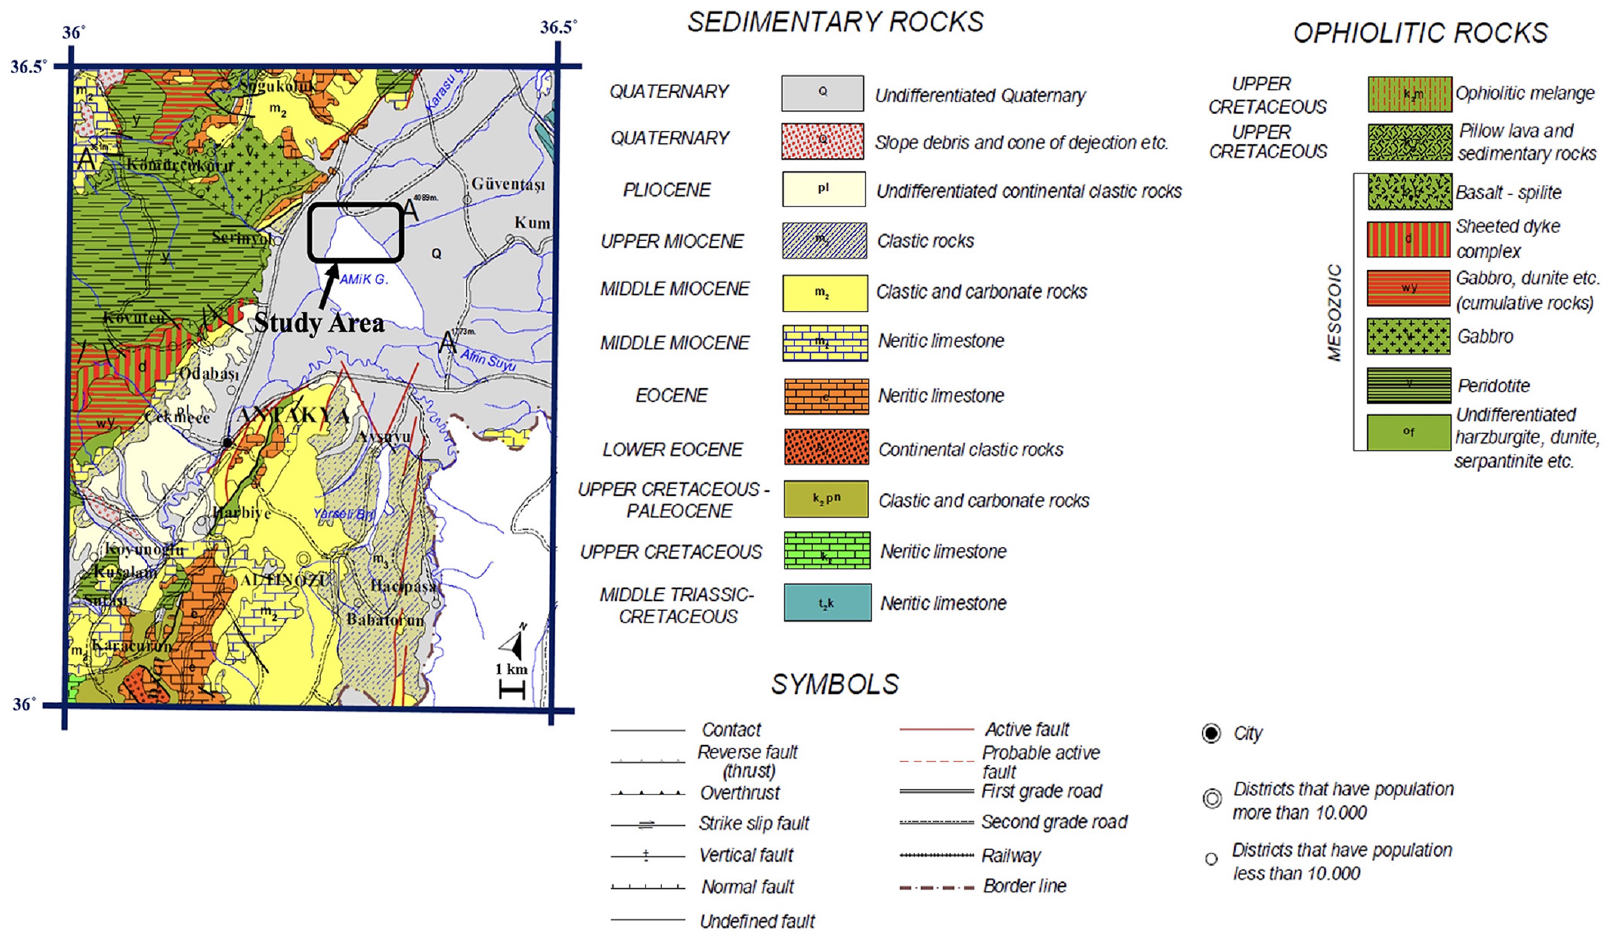
Geologic map of Hatay-Antakya (adapted from MTA, 2002).
Regarding the tectonic setting of the region, it is noteworthy that the ongoing collision between the Arabian and the Anatolian Plates continues to shape the geological landscape. This collusion has led to the shortening and thickening of the Anatolian block from the Late Miocene to the present day. Beginning in the Late Miocene and Pliocene, the Anatolian block, unable to accommodate the compression and deformation, started to laterally move westward under the influence of the strike-slip North and East Anatolian Faults (Kavuzlu, 2006). During the collisional events between the two plates, the Arabian Plate became separated from the African continent due to the northward movement of the Arabian Plate, which outpaced the remaining parts of the continent. This movement occurred through the left-lateral Dead Sea Transform Fault Zone (Gülen et al., 1987), extending between the Red Sea in the south and the East Anatolian Fault Zone in the north. It is one of the major active tectonic structures of the eastern Mediterranean region, oriented in a northeast-southwest direction (Karabacak and Altunel, 2013).
The Amik basin is located within the triple junction formed by the Anatolian Block and the Arabian and African plates. Within this region, three significant tectonic structures intersect: the north-trending Dead Sea Fault Zone (DSFZ), the northeast-trending East Anatolian Fault Zone (EAFZ), and the northeast-trending Cyprus Arc (CA) (Mahmoud et al., 2013; Yuce et al., 2014). The locations of the Hatay Airport and the DSFZ, EAFZ, and CA are presented in Figure 5. These active fault systems are closely situated to each other near the Amik Basin, forming what is known as the Antakya triple junction. This junction serves to accommodate deformations between Arabia/Anatolia, Africa/Arabia, and Anatolia/Africa (Over et al., 2004). Consequently, the region is characterized as one of the seismically most active areas in Türkiye.
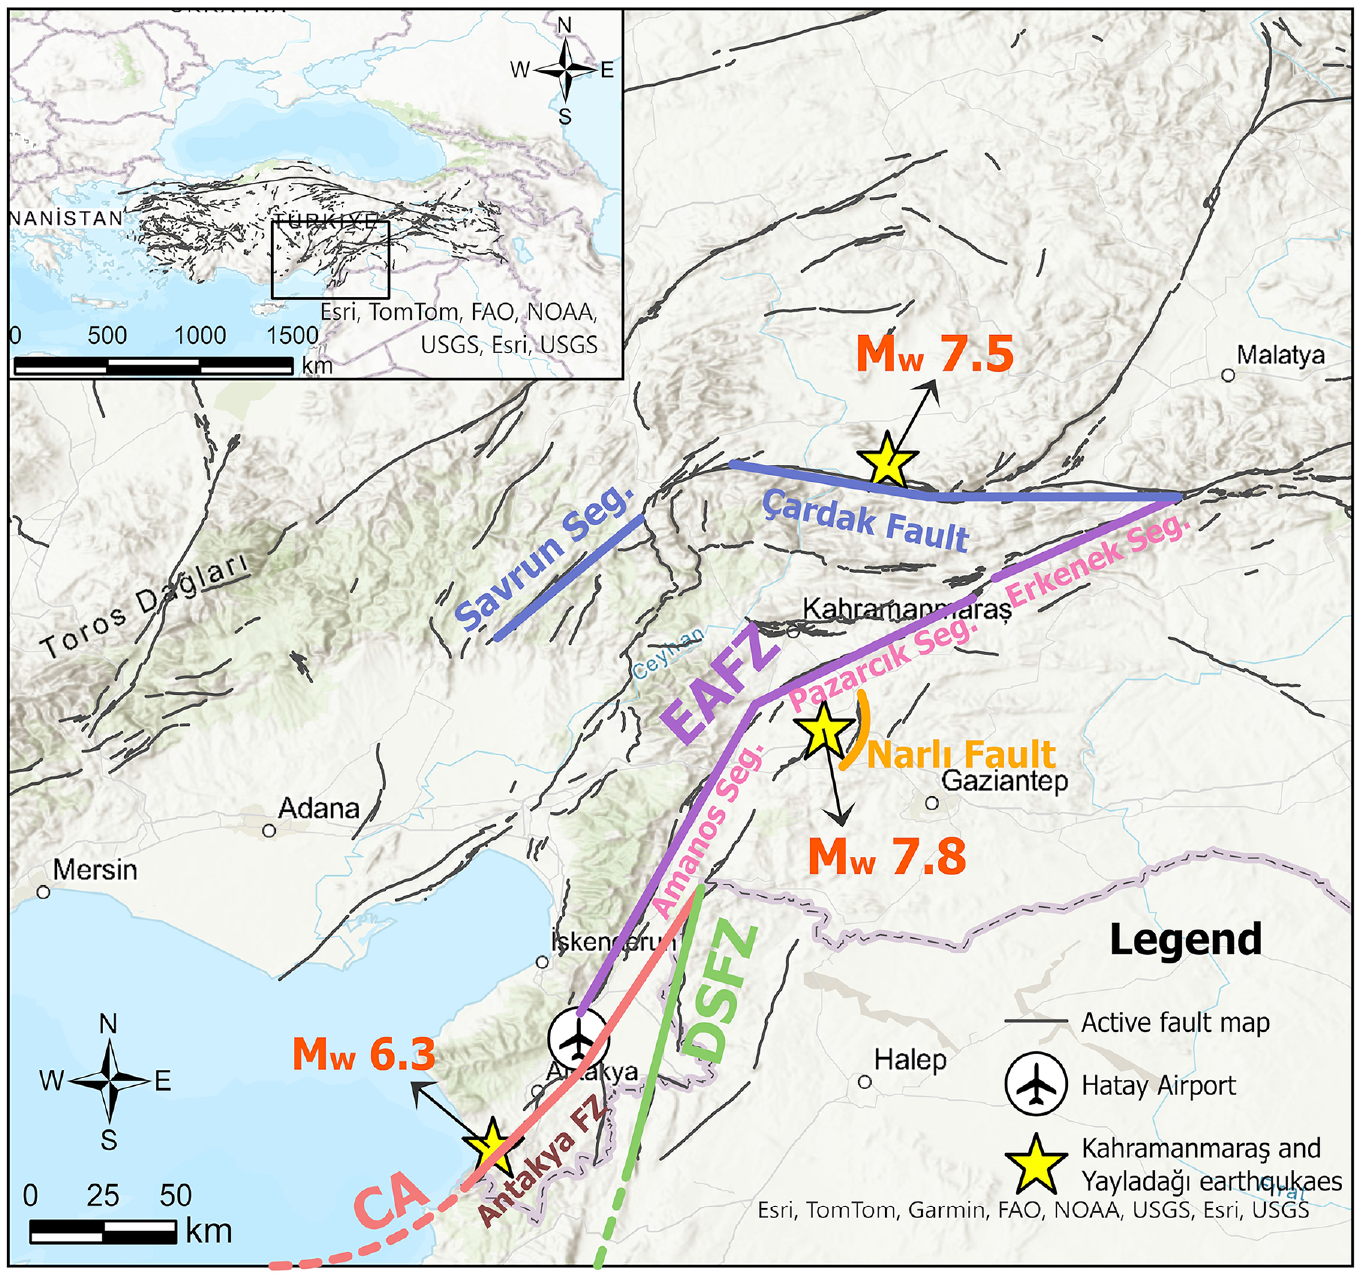
Tectonic map of the study region.
Strong ground motions recorded during the 2023 Kahramanmaraş earthquake sequence
The moment tensor solutions suggest purely left-lateral strike-slip movements for both the Kahramanmaraş-Pazarcık and -Ekinözü-Elbistan events. The fault rupture of the first event originated on the Narlı Fault, located at the northern end of the Dead Sea Fault Zone. It then propagated along the East Anatolian Fault Zone, specifically along the Pazarcık, Erkenek, and Amanos segments, with bilateral propagation in the northeast and southwest directions. The second event was initiated on the Çardak Segment and propagated along the segment of Doğanşehir. Regarding the Yayladağı event, the rupture was triggered on the Antakya Fault Zone (AFZ), characterized as a normal fault with a left-lateral strike-slip component spanning 45 km. Notably, no faulting-induced surface rupture deformations were observed after the Hatay-Yayladağı earthquake (MTA, 2023).
Figure 6 presents the attenuation of the recorded PGA intensities with Joyner and Boore (1981) distances, Rjb, for the events. Predicted PGA intensities estimated by Boore et al. (2014), referred to as BSSA14, are also included. Rjb values for the Yayladağı event were adopted from Sandikkaya et al. (2023). Hatay Airport is located approximately 0.3, 30, and 200 km away from the fault rupture of the Pazarcık, Yayladağı, and Ekinözü-Elbistan events, respectively. The boxes shown in Figure 6 denote the approximate range of distances for Hatay Airport and the recorded PGA intensities corresponding to these distances.
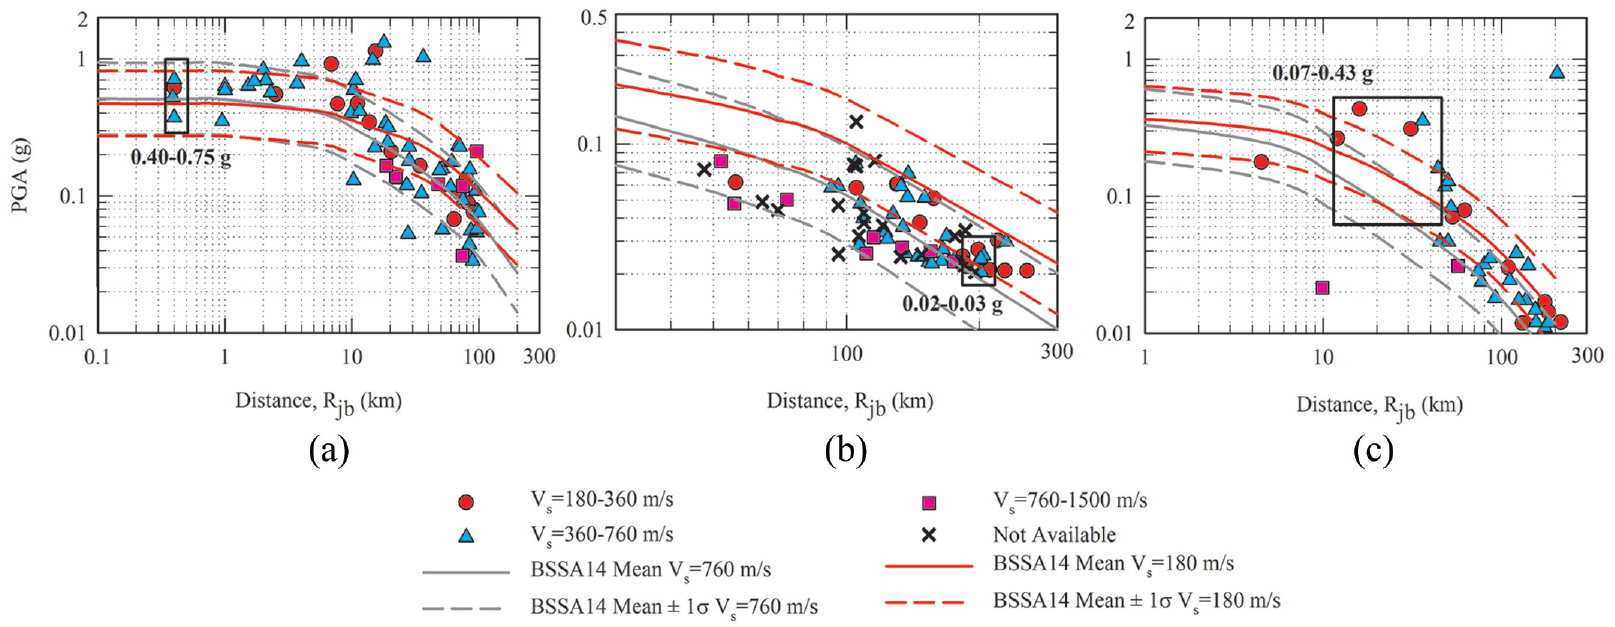
PGA’s recorded during (a) Pazarcık, (b) Ekinözü- Elbistan, and (c) Yayladağı events are plotted against Joyner and Boore (1981) distances.
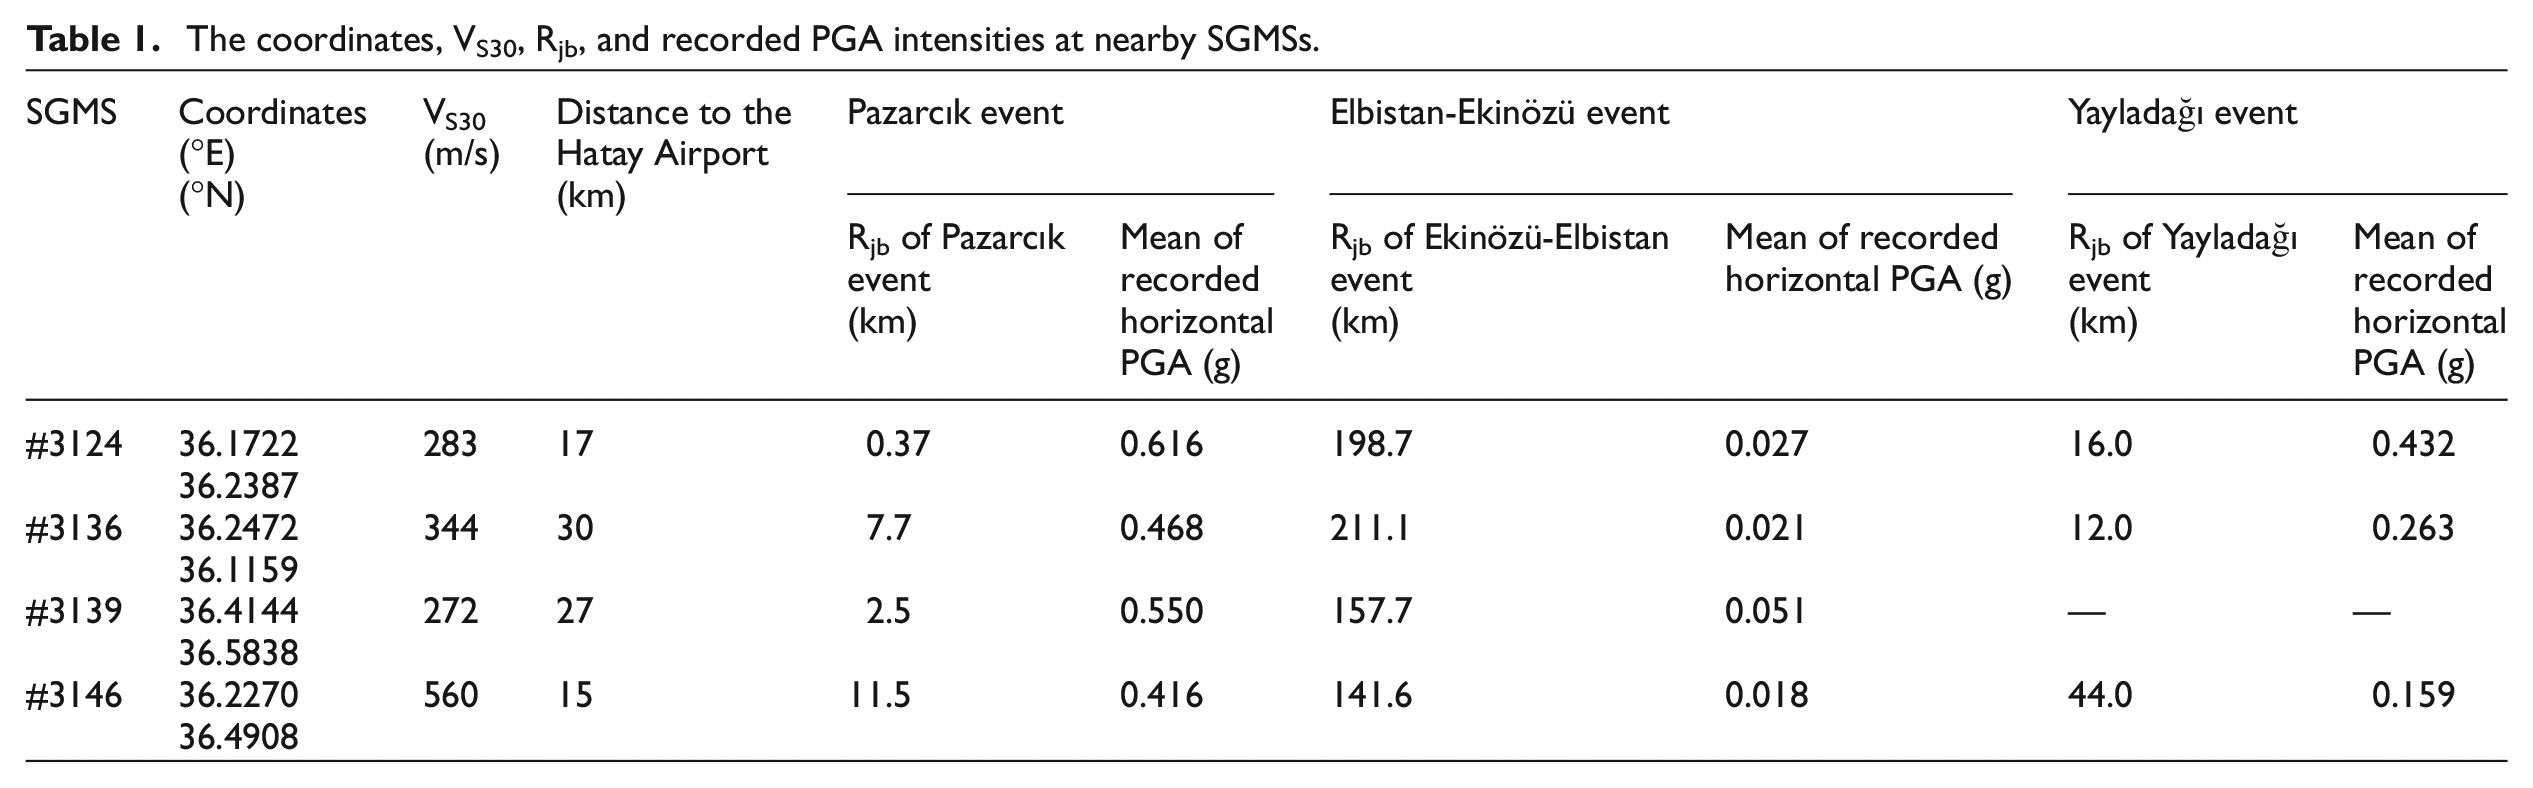
Figure 7 displays the locations of nearby strong ground motion stations (SGMSs) within approximately 30 km of the study area. Table 1 provides the corresponding VS30, Rjb, and geometric mean of the recorded PGA intensities at these SGMSs.
The locations of nearby SGMSs.
The coordinates, VS30, Rjb, and recorded PGA intensities at nearby SGMSs.
The data and evaluations regarding the site and event-specific PGA level estimation for the Pazarcık event follow:
SGMSs at comparable Rjb distances for a “rock” (VS30 360-760 m/s) site indicate that PGA levels vary between 0.40–0.75 g, respectively (refer to Figure 6a).
According to the site classification scheme proposed by Seed et al. (2001), the site falls into site category E. For a category E site, assuming that the PGA on a rock is in the range of 0.40–0.75 g, the PGA at a similar soil site is estimated to fall in the range of 0.40–0.50 g.
According to the ASCE 7-16, NEHRP, and Eurocode 8, the site is classified as F, F, and S2, respectively. For these site classes, no site amplification factors are recommended but site-specific evaluations are. If the amplification factors for site class D, E, and F are conservatively adopted as 1.0, 1.15, and 1.4, then the PGA intensities are estimated to be in the range of 0.40–0.75 g, 0.46–0.86 g, and 0.56–1.05 g for ASCE 7-16, NEHRP, and Eurocode 8, respectively.
At the strong ground motion station (#3124), with comparable site and location characteristics (VS30 =283 m/s), the geometric mean PGA level was recorded as 0.62 g.
Therefore, the site and event-specific PGA level at the Hatay Airport site is estimated as 0.55 g for the Pazarcık event.
Similarly, the PGA values estimated for comparable distances at similar soil sites (i.e., VS30 = 180–360 m/s) are 0.025 g for the Ekinözü-Elbistan. Consequently, it was concluded that the Ekinözü-Elbistan event did not generate significant shaking levels at the site.
Regarding the intensity assessments during the Yayladağı event, Hatay Airport is located approximately 30 km away from the fault rupture. The PGA vs Rjb relationship presented in Figure 6c suggests that the recorded PGA intensities corresponding to comparable distance were estimated to be in the range of 0.07–0.43 g for the Yayladağı event. Additionally, in Table 1, Rjb values and the geometric mean of the recorded PGA levels at the nearby stations are presented for the Yayladağı earthquake. Consistent with these recorded PGA levels, the PGA intensity at Hatay Airport is estimated to be 0.35 g during the Yayladağı earthquake.
Site investigations
A comprehensive series of site investigation studies were conducted as part of the engineering design of Hatay Airport (Akademi, 2010; Akya Proje, 2011a; Akya Proje, 2011b; Zemar, 2006), as well as in response to reconnaissance efforts following the earthquakes (Akademi, 2023; TÜBİTAK, 2023). These investigations involved various methods including borings, disturbed and undisturbed sampling, in-situ tests (pressuremeter and standard penetration test, SPT), and laboratory tests (soil classification and triaxial tests). The drilling operations were carried out using D-500 rotary type and TSM-750 mechanical rotary type drilling machines. The site investigations were conducted in accordance with several standards, including TS EN ISO 22476-3, TS1500, and TS 1900-1 site investigation standards. For instance, standard penetration tests (SPTs) were performed following TS EN ISO 22476-3 guidelines, with an automatic hammer used alongside AW drilling rods.
The locations of these borings, along with selected representative cross-sections, are presented in Figure 8. Blue and pink pins represent the locations of boreholes drilled before and after the earthquake sequence, respectively. The borehole labels are only provided for those used for developing relevant soil profiles and cross-sections. Additionally, on the same figure, regions with documented soil ejecta due to seismic liquefaction are shaded in red.
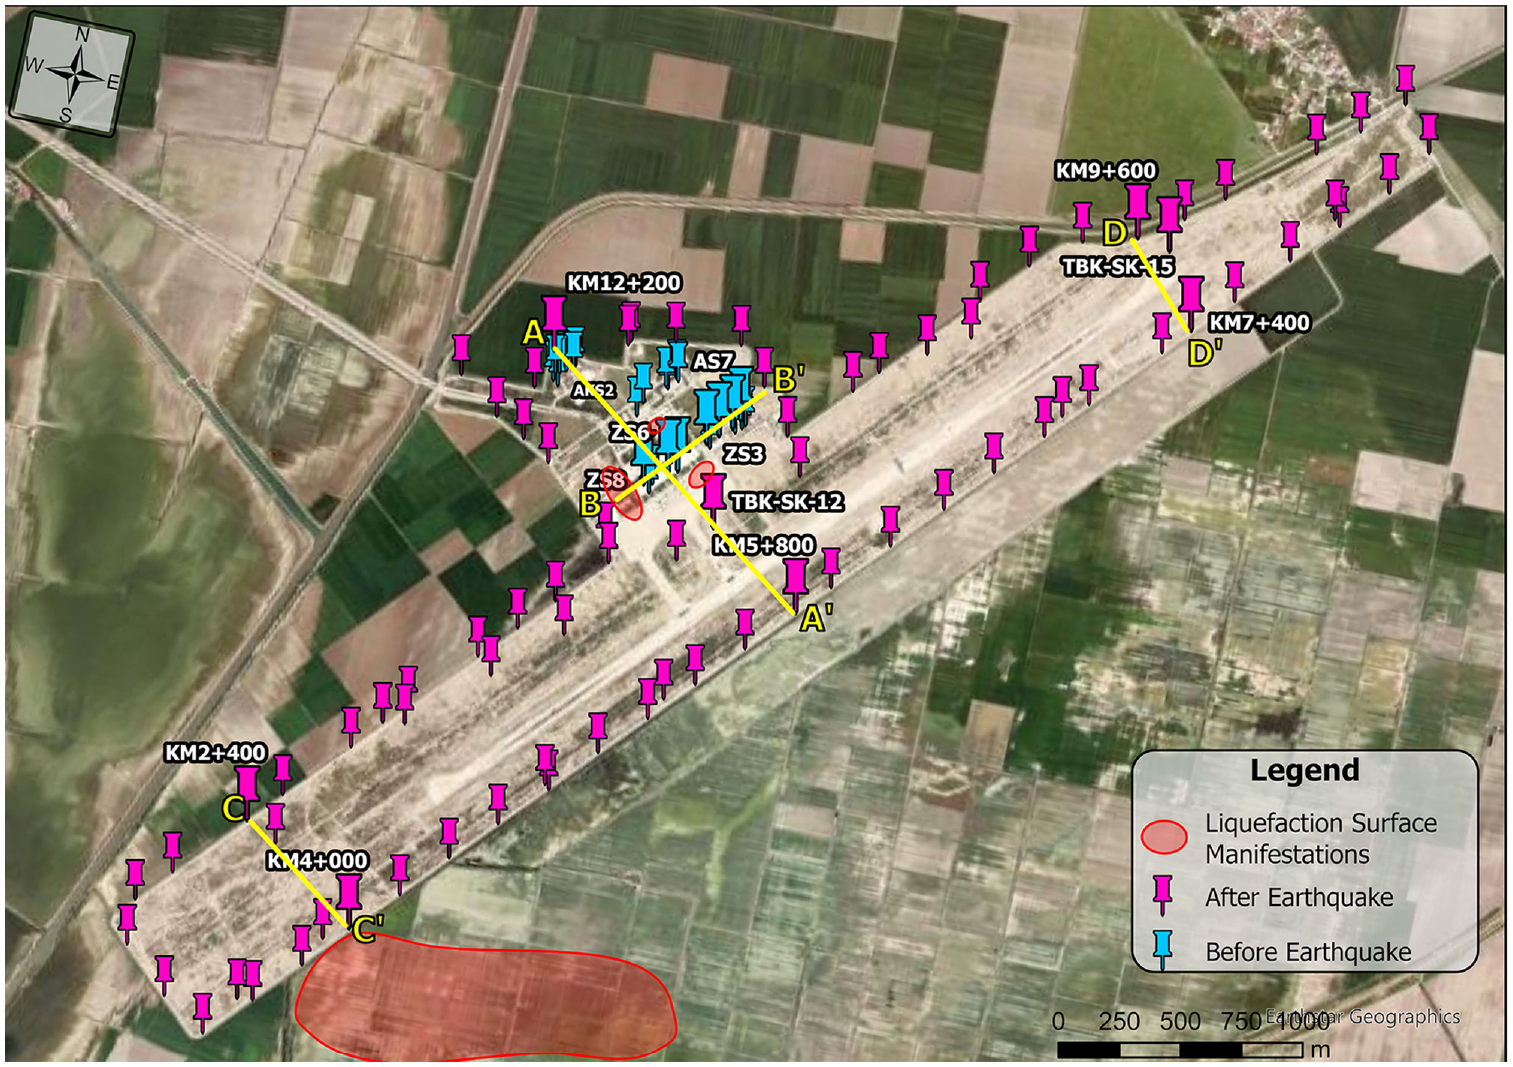
The locations of borings along with selected cross-sections.
The subsurface soil conditions across the site are depicted through four interpreted cross-sections, illustrated in Figures 9 through 12. These cross-sections were drawn by using distorted horizontal and vertical scales and were selected to represent the airport facility and areas where liquefaction-induced sand ejecta was mapped.
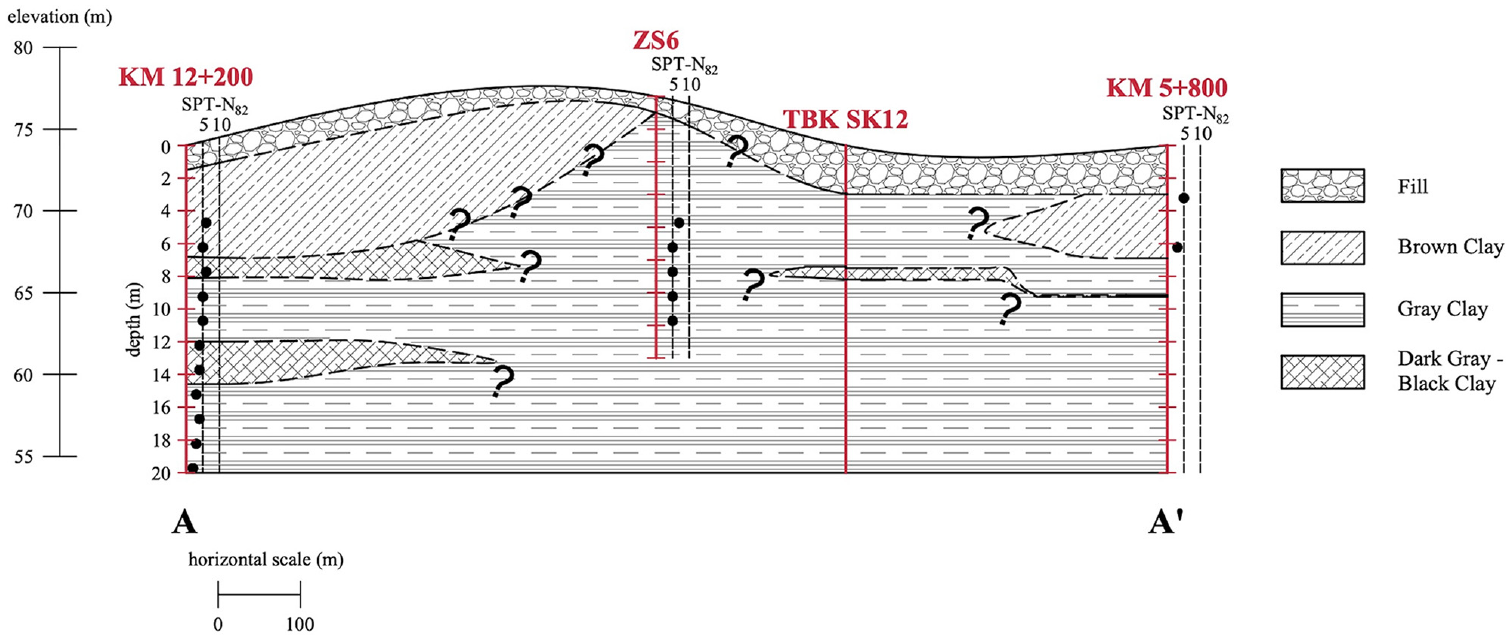
Cross-section A-A’.
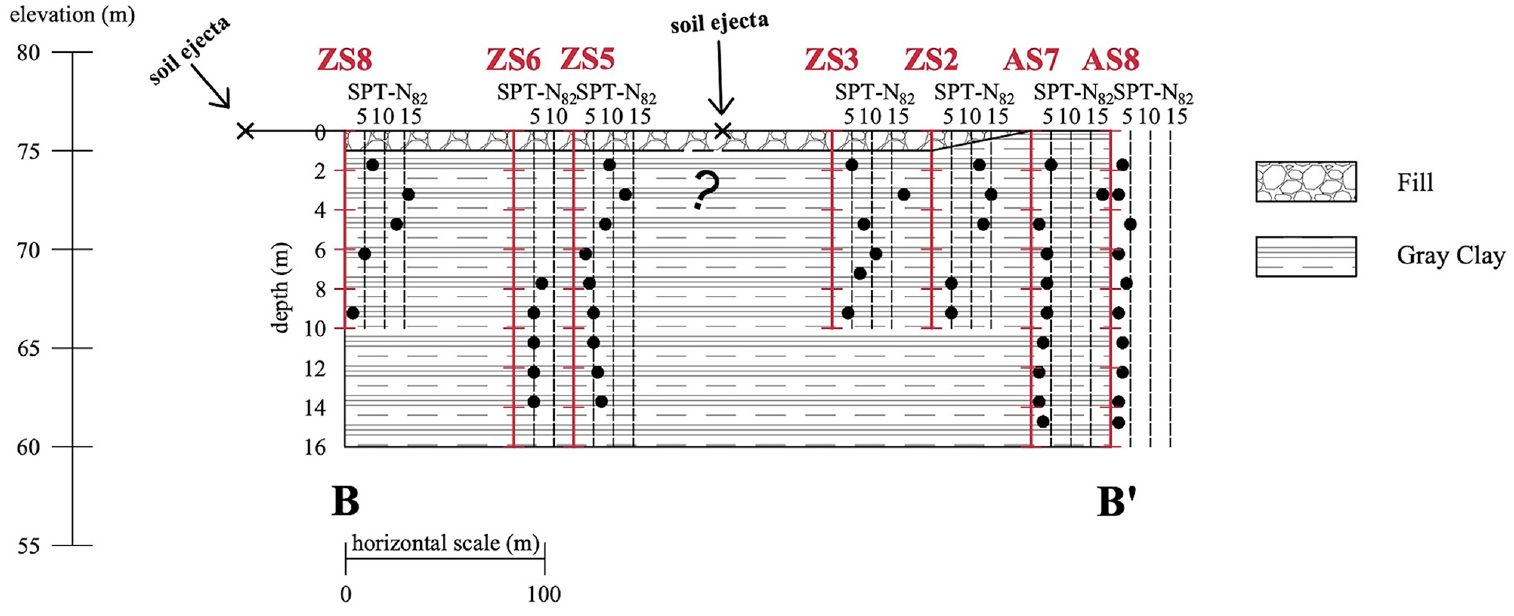
Cross-section B-B’.
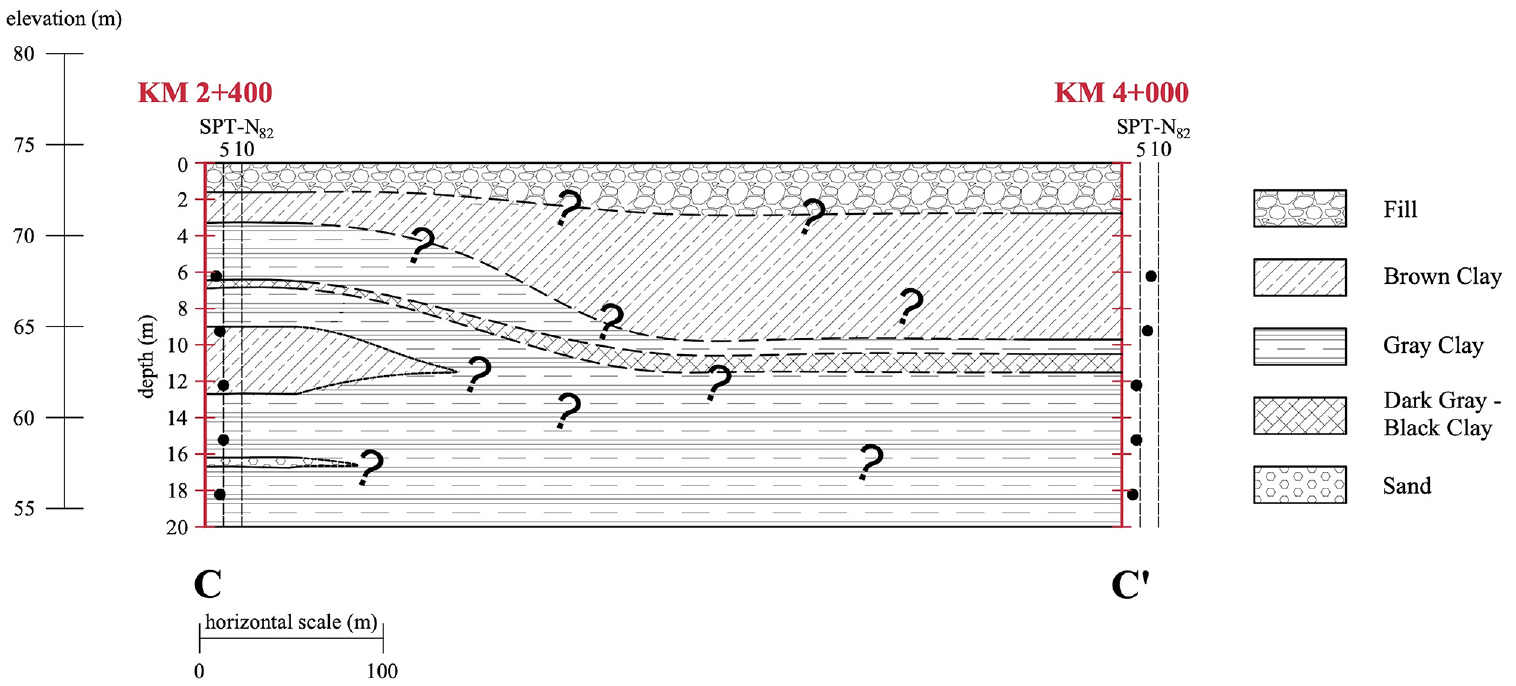
Cross-section C-C’.
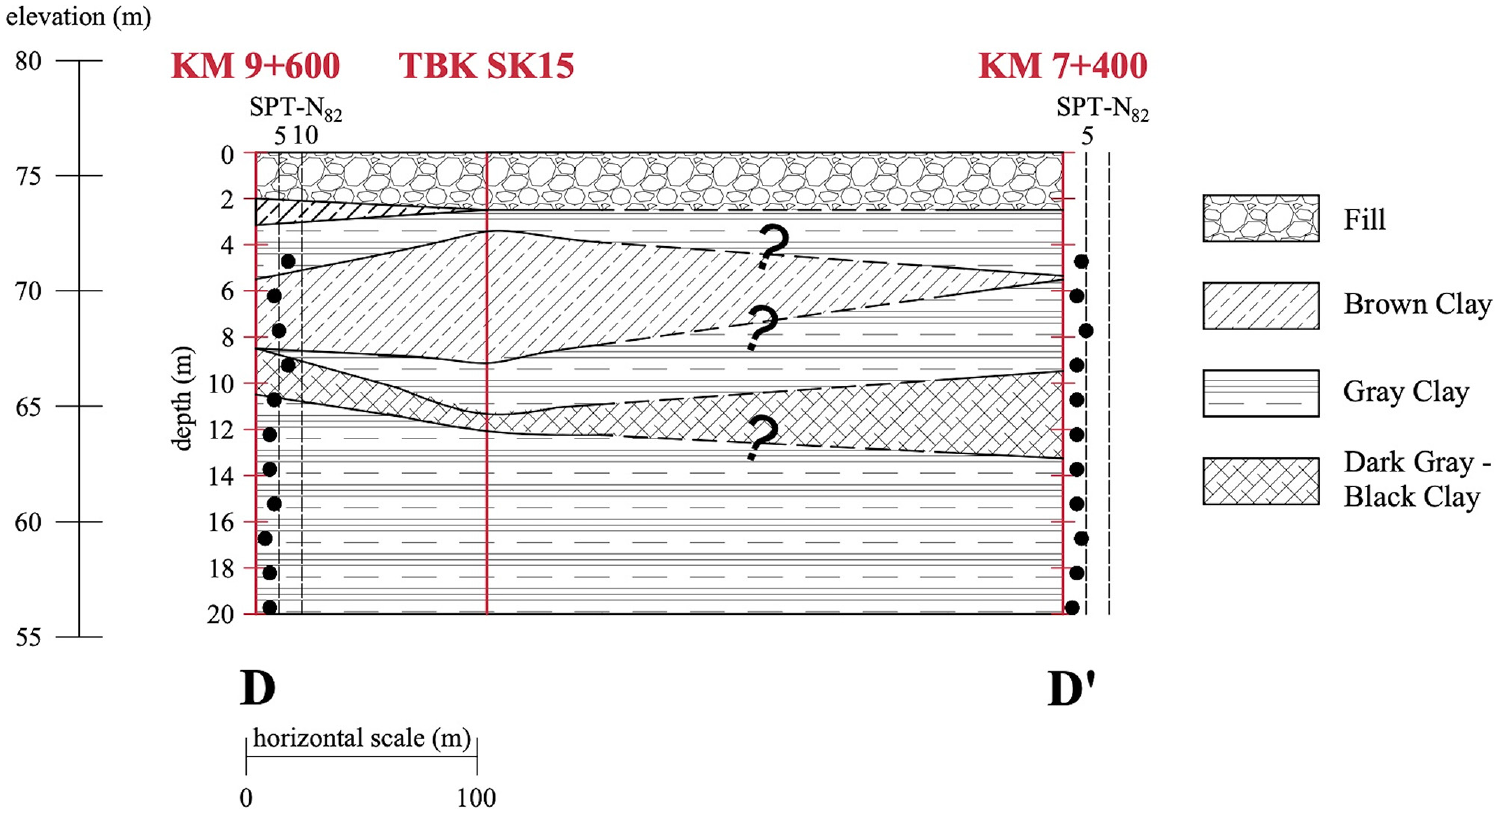
Cross-section D-D’.
The subsurface soil conditions along these cross-sections generally exhibit a relatively consistent lateral pattern. At the ground surface of the site, there exists a 1 to 3 m thick engineered well-compacted rock-granular fill layer with a significant percentage of fines. Figure 13 shows a test pit opened in the fill layer. Unfortunately, the gradation characteristics of this fill layer were not documented and will be investigated as part of future site investigations. However, visual inspections suggest it is a sandy gravelly rockfill with some fines.
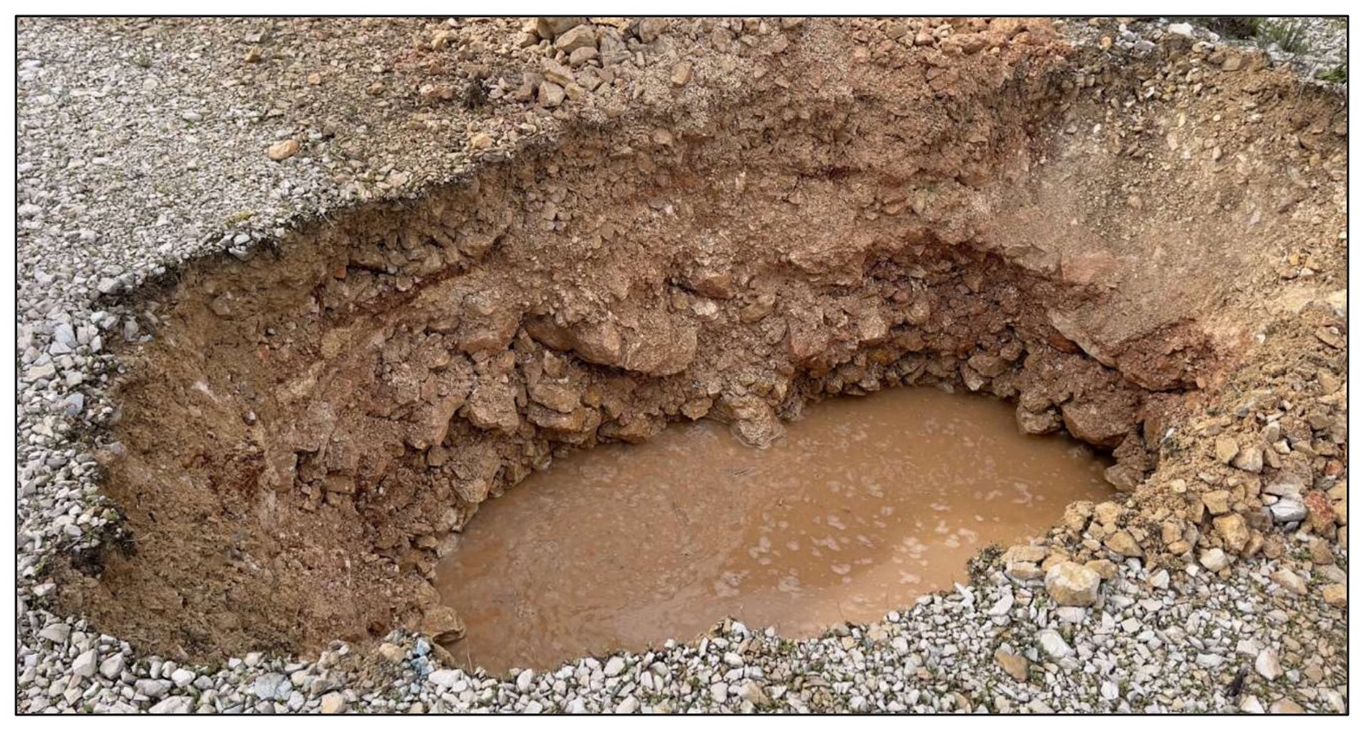
A picture from a test pit in fill (adopted from Dalgıç, 2024).
Apart from this engineered fill layer, the site comprises low to high-plasticity clays, with rare, thin, silty, and sandy lenses. Liquid limit (LL) values for the different clay types range from 46 to 66% for the brown clay, 30 to 100% for the gray clay, and 55 to 73% for the dark gray-black clay. Similarly, Plasticity Index (PI) values vary from 24 to 37% for the brown clay, 8 to 73% for the gray clay, and 22 to 36% for the dark gray-black clay. On the provided cross-sections, in-situ Standard Penetration Test blow counts (SPT-N) are also indicated. Note that an automatic-type hammer was utilized during the execution of the SPTs. Consistent with Cetin et al. (2023), an energy efficiency of 82% was assumed for the automatic hammer, anvil, rod, and sampler system, resulting in field N values reported as N82. In the brown clay layer, SPT-N82 values vary in the range of 3–8 blows per foot (i.e., per 30 cm). In the gray clay layer and the dark gray-black clay layer, the SPT-N82 values range from 2 to 18 and 3 to 7 blows per foot, respectively.
Surface manifestations of soil liquefaction
The site was accessed 3 days after the earthquake sequence, on February 9, 2023. Surface manifestations of soil liquefaction in the form of soil ejecta were observed. Additionally, ground deformations induced by fault rupture and liquefaction were evident on the airport runway. Notably, a sewage manhole was observed to be floated and uplifted by more than 30 cm. Figures 14 through 18 present sample pictures illustrating the observed surface liquefaction manifestations and ground deformations. The terminal building was designed and constructed on piled foundations, thus avoided liquefaction-triggering and induced bearing capacity problems, and/or displacements and deformations. Liquefaction manifestations were predominantly observed in the free field away from the structures where ground improvement or reinforcement had not been performed.
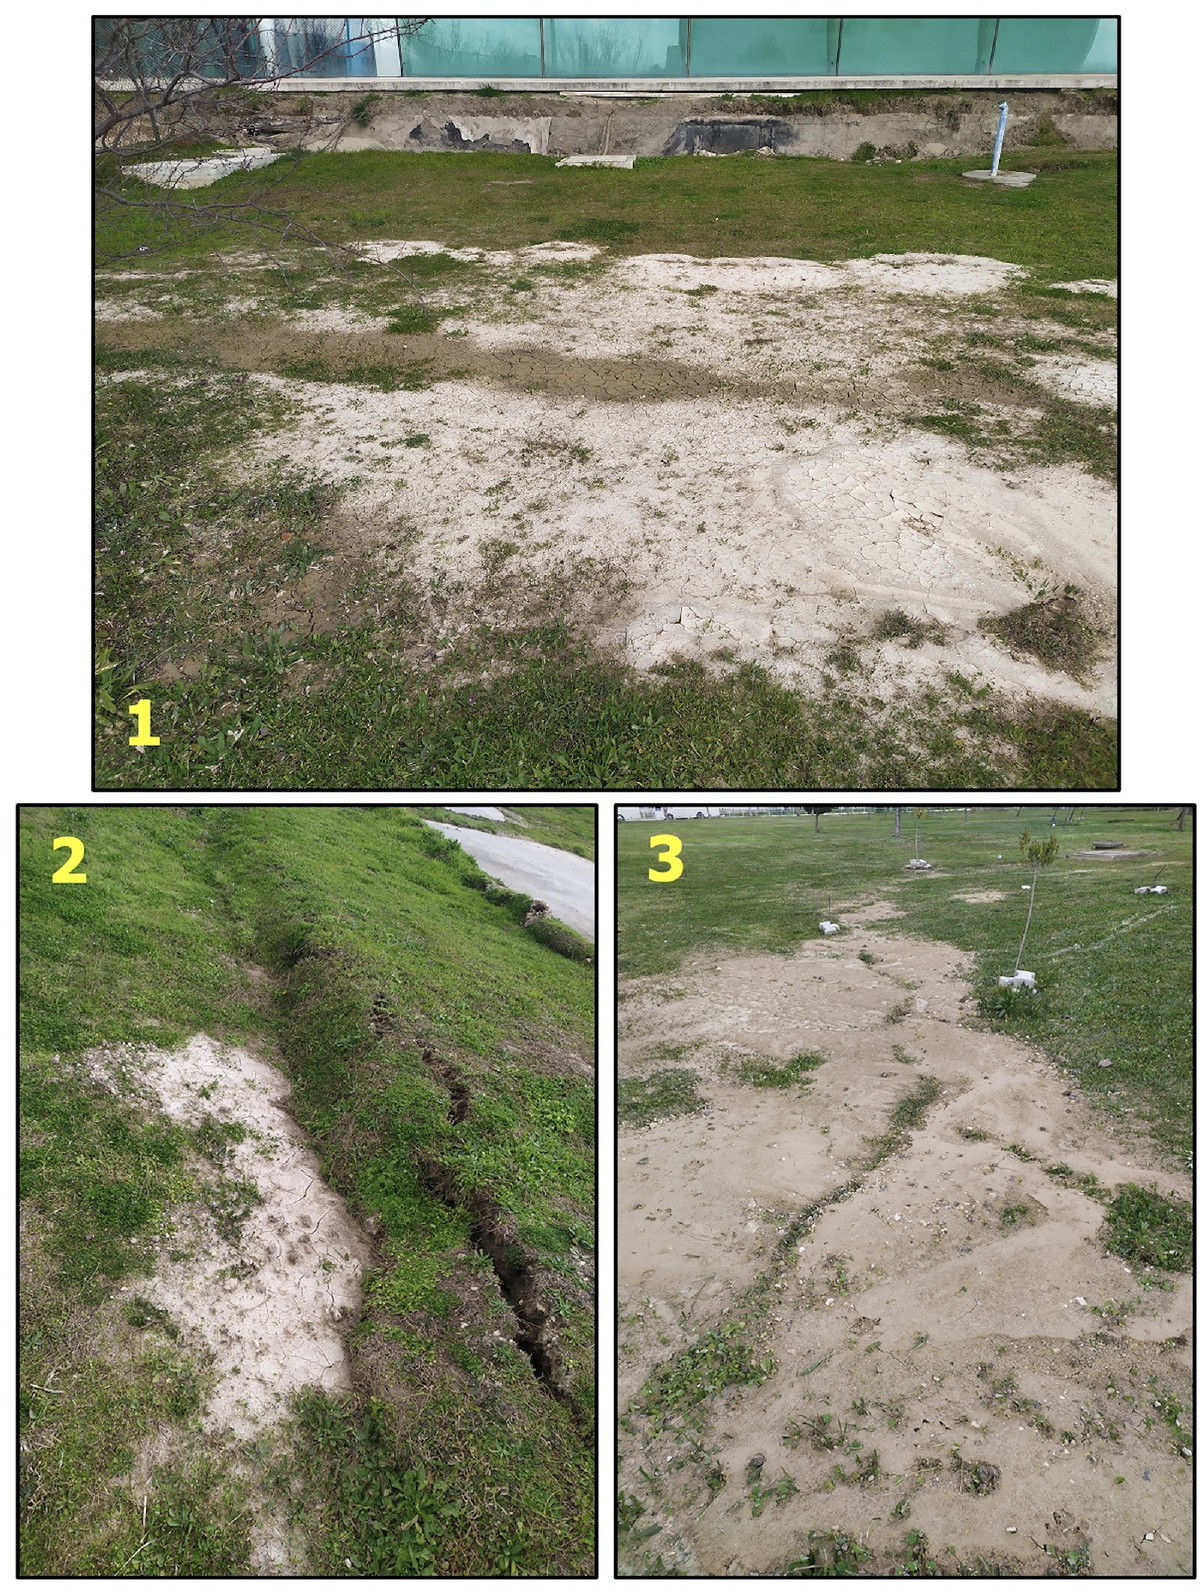
Seismic soil-liquefaction-induced soil ejecta observed at the site (coordinates: (1) 36.28093°E, 36.36251°N; (2) 36.28107° E, 36.36248° N; (3) 36.28148°E, 36.36449°N).
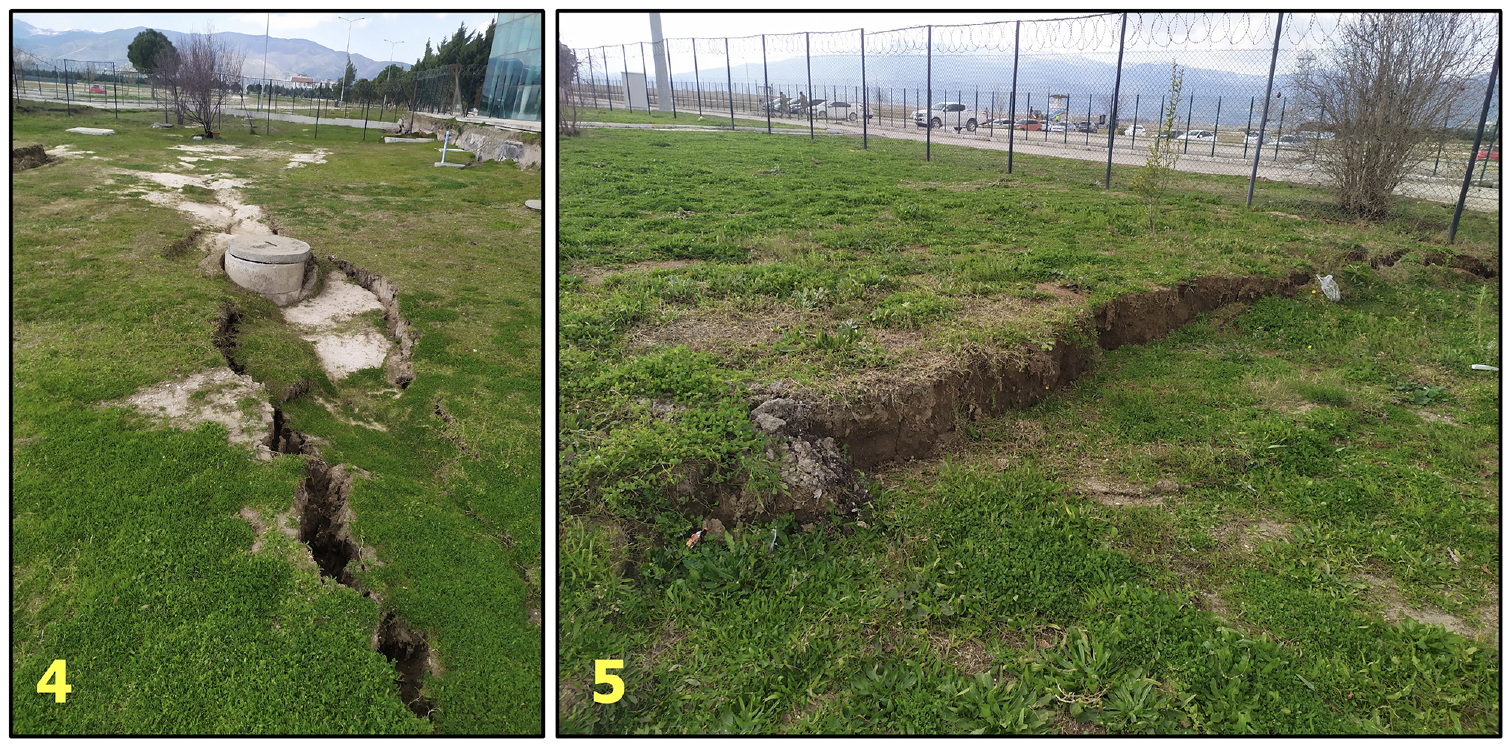
Seismic soil-liquefaction-induced ground deformations and displacements mapped at the site (coordinates: (4) 36.27071°E, 36.42005°N; (5) 36.28094°E, 36.36251°N).
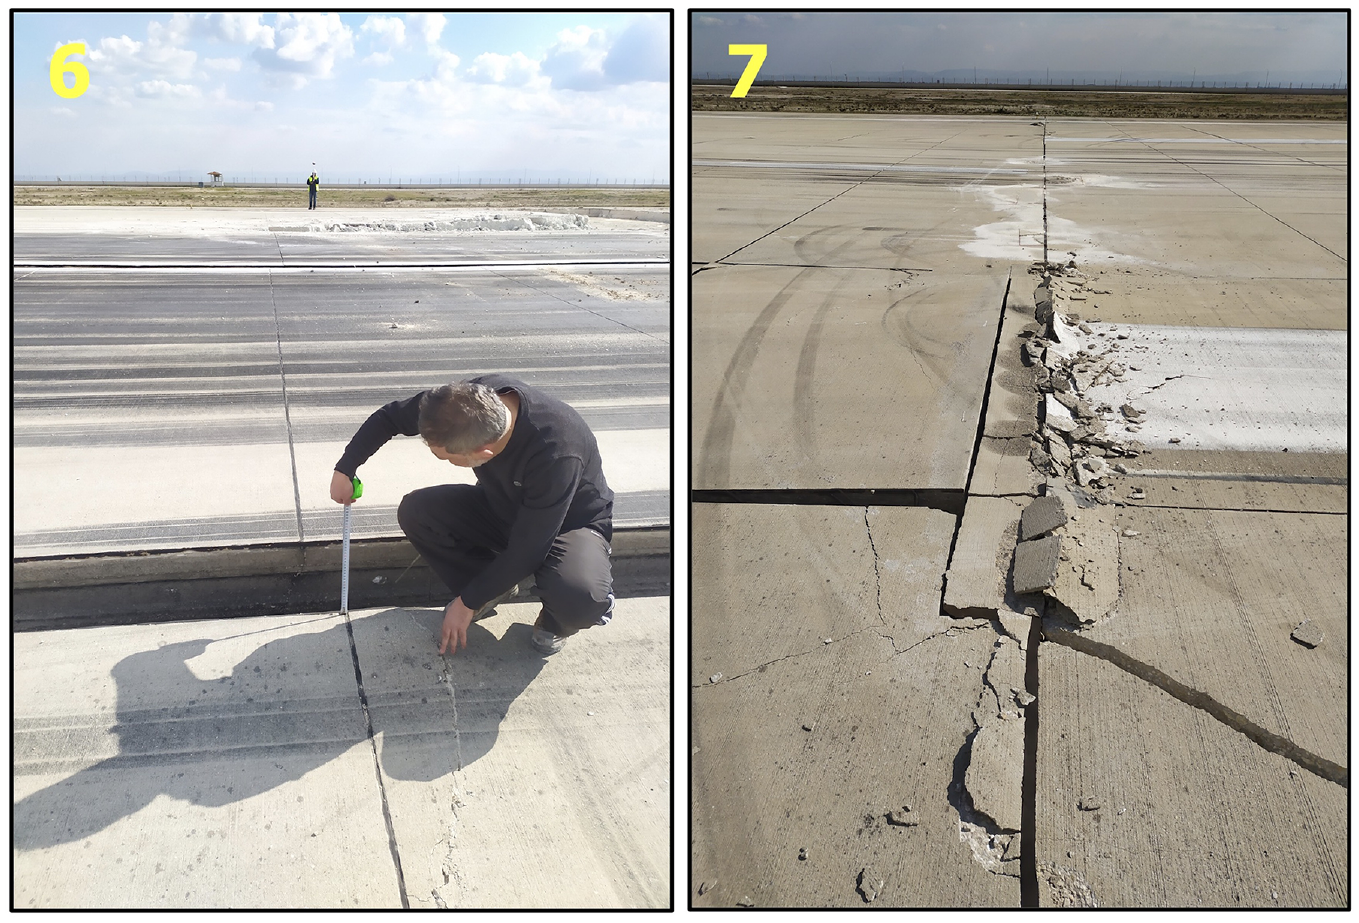
Airport runway cracks, displacements, and deformations (coordinates: (6) 36.36913°N, 36.29508°E; (7) 36.29178°E, 36.36648°N).
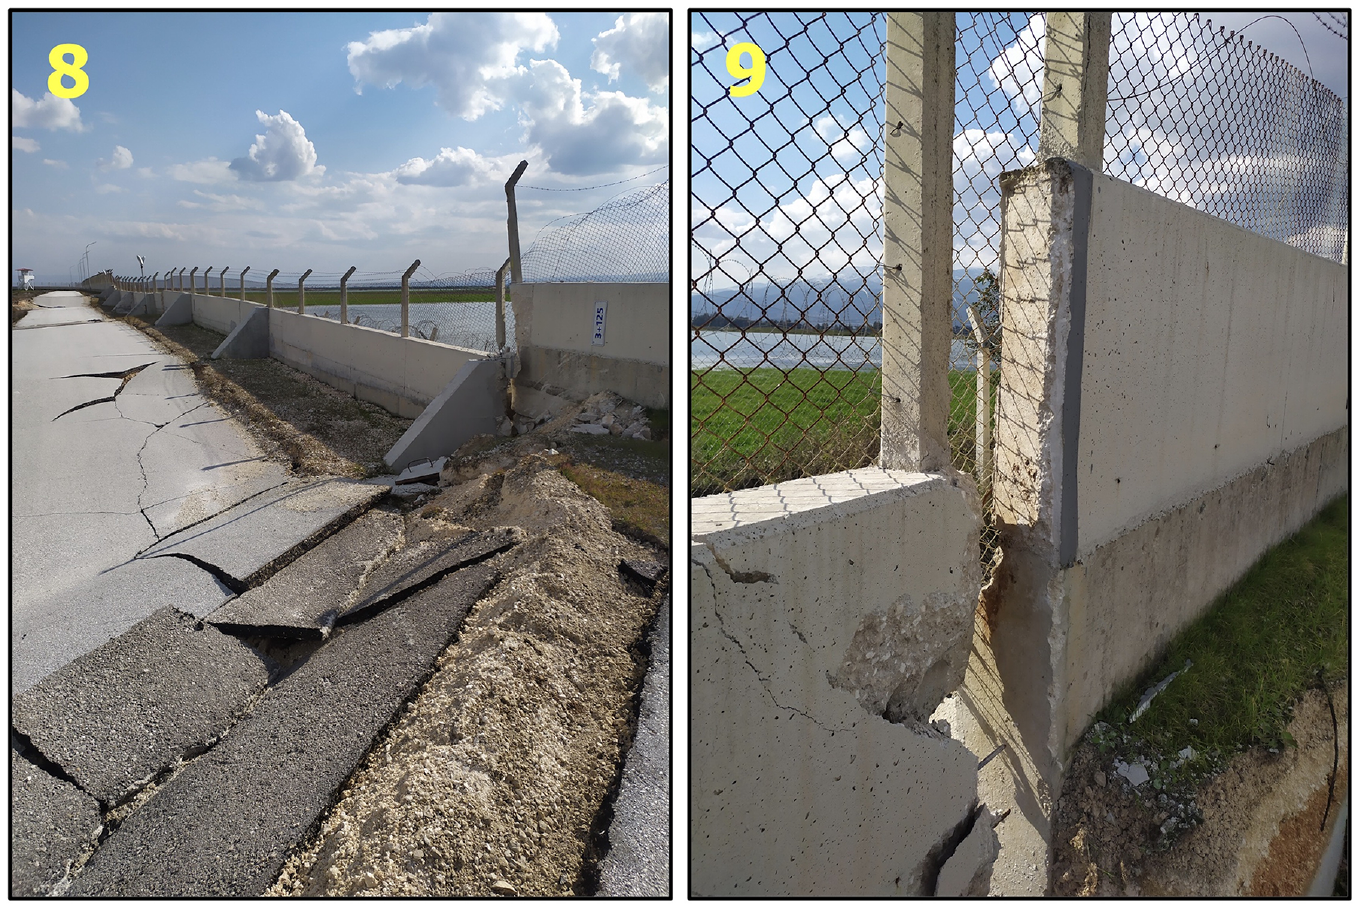
Ground deformations and undulations (coordinates: (8) 36.34562°N, 36.26732°E; (9) 36.26716°E, 36.34568°N).
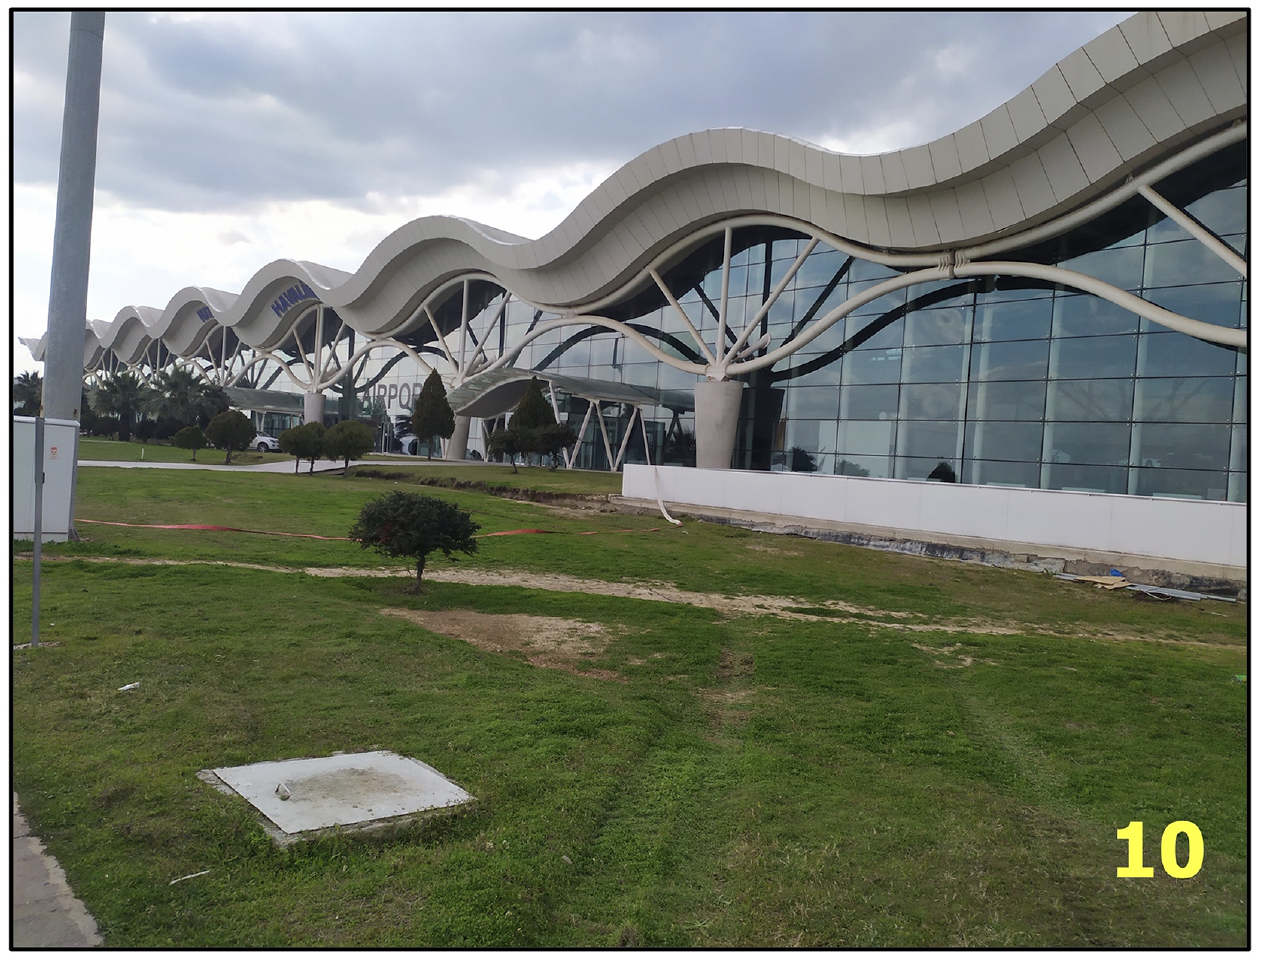
A general view of the terminal building after the earthquakes (coordinates: (10) 36.28294°E, 36.36371°N).
During the reconnaissance inspections, soil ejecta was documented by the terminal building, situated in the northwest part of the airport area. In addition to field reconnaissance studies, the surface liquefaction manifestations in the form of soil ejecta were also identified using remote-sensing methods (Guo et al., 2023). The Maxar satellite data from February 7 to 9 and GF-2 satellite data from February 16 were employed for this purpose. Consistently, soil ejecta was detected on the southeast part of the Hatay Airport, as depicted in Figure 19.
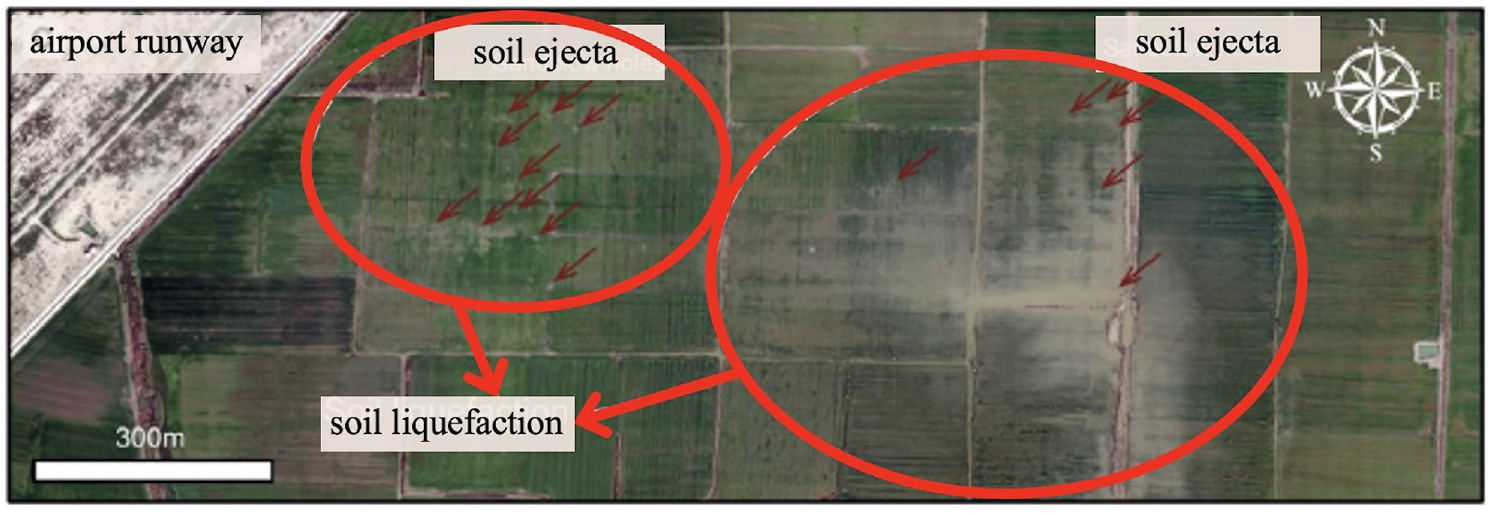
Soil ejecta detected by remote sensing tools (adapted from Guo et al., 2023).
Figure 20 presents the plan view of the site, delineating the locations of photographs taken, ejecta samples, and nearby boreholes. Liquefied areas are divided into four regions: Region 1 (R1), Region 2 (R2), Region 3 (R3), and Region 4 (R4). These regions will be discussed separately as part of the following seismic soil liquefaction engineering assessments.
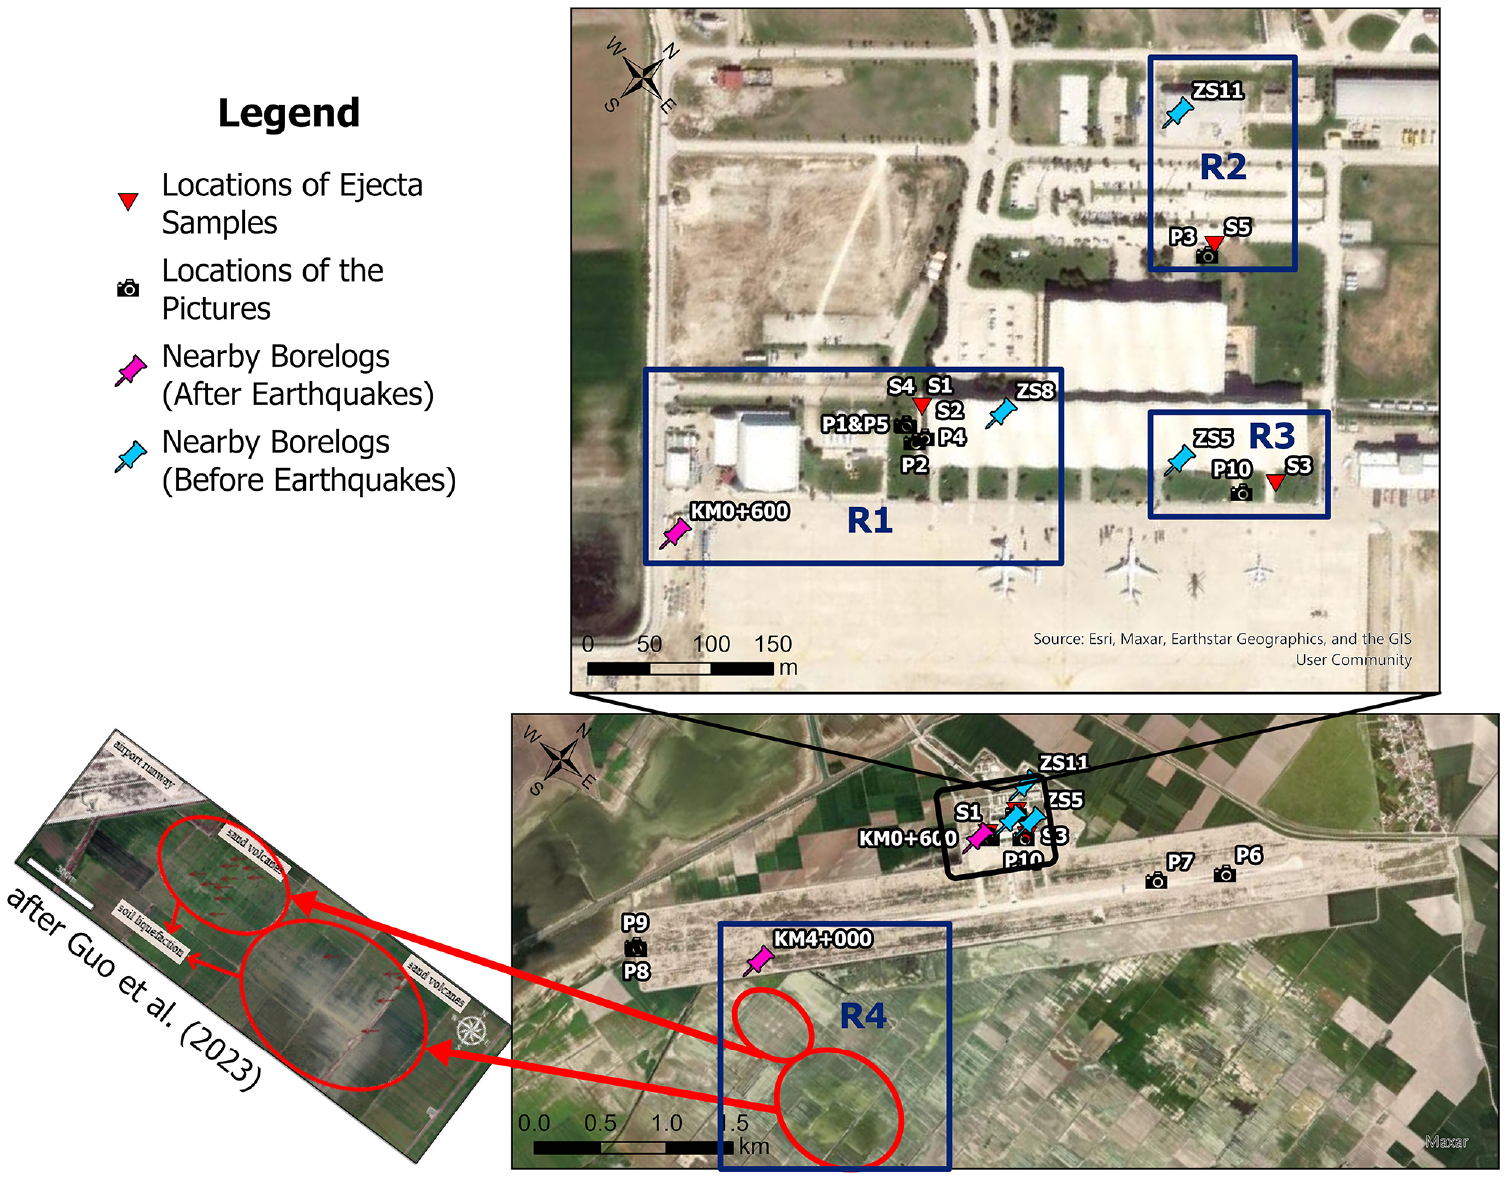
The locations of photographs taken, ejecta samples, and nearby boreholes.
Seismic soil liquefaction engineering assessments
As part of soil liquefaction engineering evaluations, analyses for susceptibility were performed, focusing on the regions where liquefaction surface manifestations were observed. These liquefied areas were categorized into four regions: Region 1, Region 2, Region 3, and Region 4. Region 1 will be represented by borehole at KM 0+600 and borehole ZS8, along with soil ejecta samples S1, S2, and S4. For Region 2, borehole ZS11 and soil ejecta sample S5 are used. Region 3 will be represented by borehole ZS5 and soil ejecta sample S3. Lastly, borehole at KM 4+000 will be used for assessing the performance at Region 4. Figure 20 illustrates the locations of these regions, boreholes, and ejecta samples.
Ejecta sampling and testing procedures
The liquefaction ejecta samples were collected from five locations, indicated by red triangles in Figure 20. During the retrieval of surface soil ejecta, particular emphasis was placed on collecting representative soil samples. To achieve a continuous sample, a 0.5 m long, 75 mm outer diameter PVC pipe was pushed vertically into the soil ejecta. This method was chosen to mitigate any concerns regarding potential segregation or layering within the ejecta material.
All ejecta soil samples were tested in conformance with ASTM D7928-17 and ASTM D6913/D6319M-17 standards to evaluate their grain size characteristics. Similarly, the ASTM D4318-10e1 standard was utilized to determine their consistency limits. The soil ejecta samples were classified based on the Unified Soil Classification System (USCS) (ASTM D2487-17e1). The grain size distribution characteristics, including the percentages of gravel, sand, and fines, as well as particle sizes at which 10, 30, 50, and 60% finer, denoted as D10, D30, D50, and D60 are summarized in Table 2. Additionally, the liquid and plastic limit (LL and PL) values, along with the Plasticity Index (PI), are provided.
Grain size distribution characteristics, consistency limits, and USCS soil class of ejecta samples.
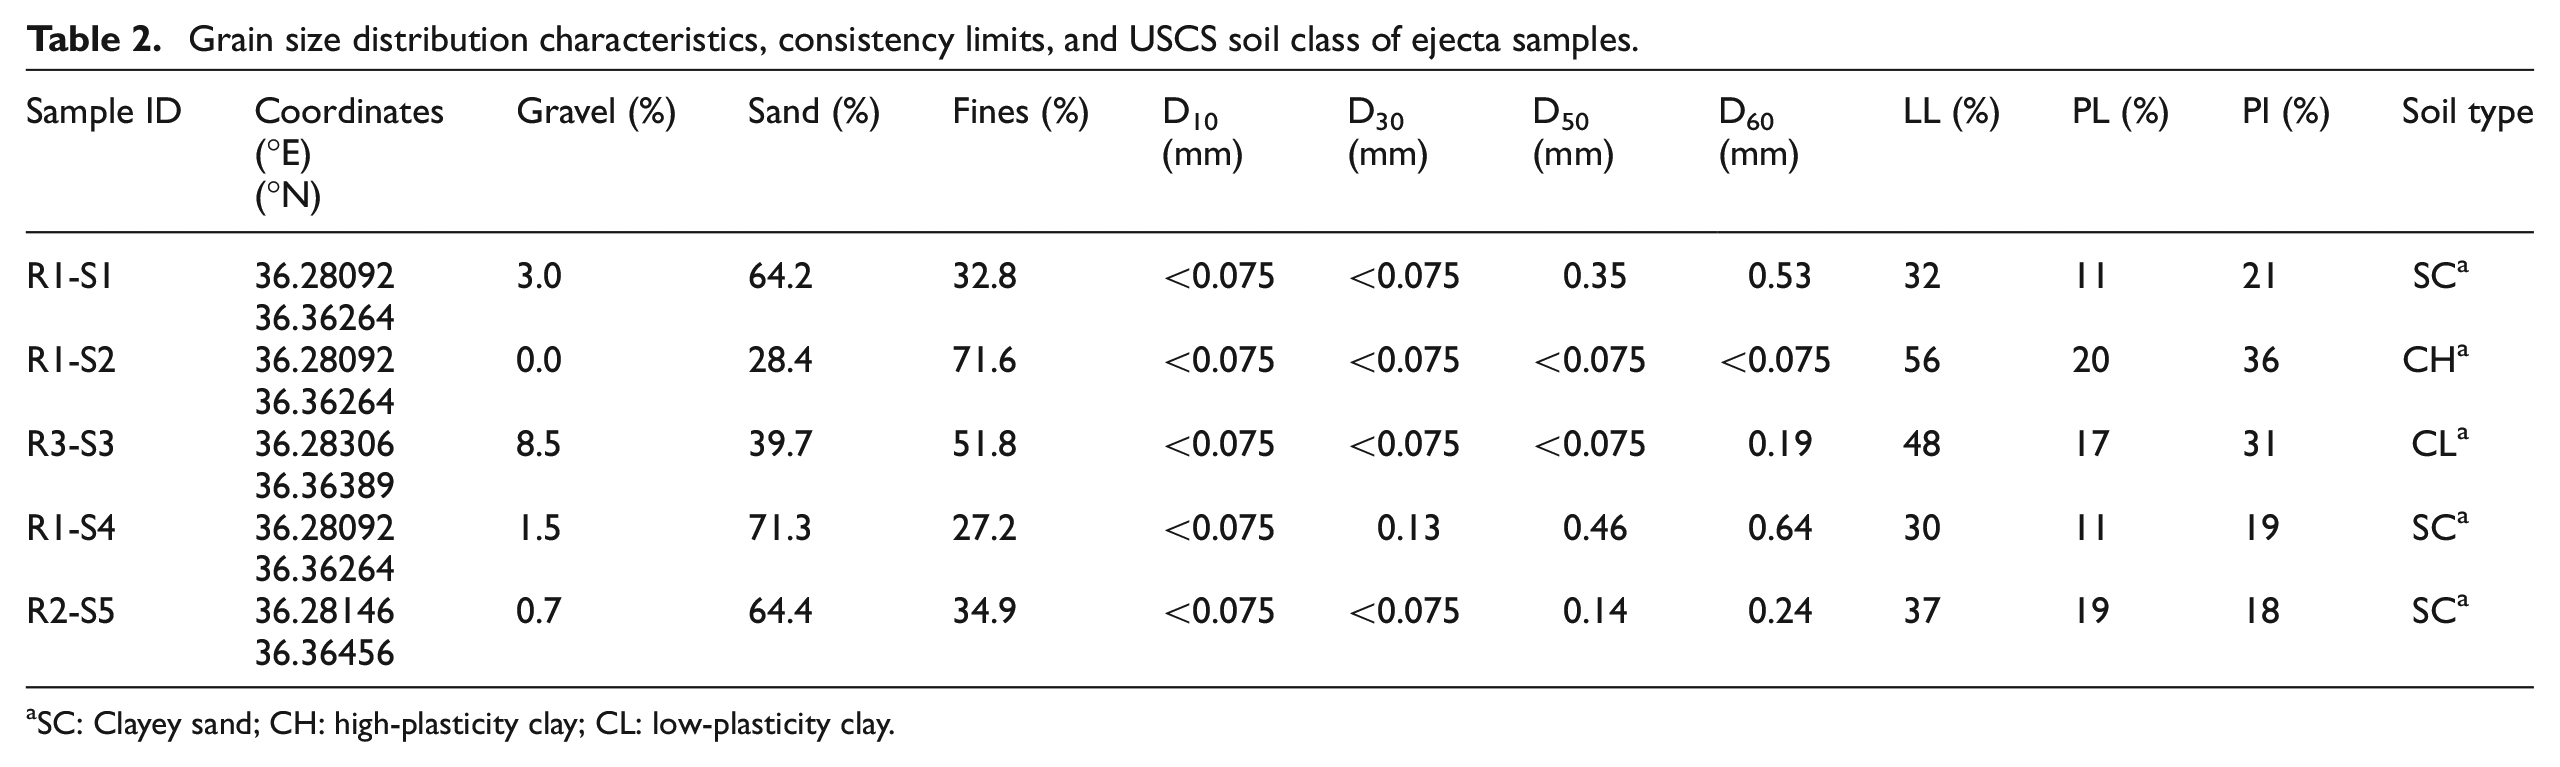
SC: Clayey sand; CH: high-plasticity clay; CL: low-plasticity clay.
Liquefaction susceptibility assessments and discussions
Liquefaction susceptibility assessments were performed for the boreholes in Regions 1 through 3. In Region 1, the characteristics of soil ejecta samples S1, S2, and S4 were compared with the grain size and consistency characteristics of soil samples retrieved at various depths in the boreholes from the same region (i.e., ZS8 and borehole at KM 0+600). This comparative approach facilitated the identification of the natural soil depths exhibiting characteristics similar to those of the ejecta soil. Similarly, in Region 2, the characteristics of sample S5 were compared with those of borehole ZS11, while in Region 3, sample S3 was compared with borehole ZS5. Unfortunately, due to the lack of samples from Region 4 (soil ejecta identified from satellite images), no cross-comparison with borehole data at KM 4+000 is possible, and the susceptibility discussion has been eliminated.
In the subsequent sections, the grain size distribution curves of the ejecta samples and samples from boreholes will be comparatively presented, alongside the grain size range of liquefaction susceptible soils recommended by Tsuchida (1970). Additionally, SPT-N values, fines contents (FC), liquid limit (LL), plasticity limit (PL), and plasticity index (PI) data from borehole soil samples are plotted against depth. The soil ejecta characteristics are shown with continuous lines on the same figures to enable direct comparisons with the characteristics of natural soils. The results of these cross-comparisons are presented and discussed regionally next, aiming to aid in identifying the origin of the soil ejecta observed at the ground surface.
Region 1
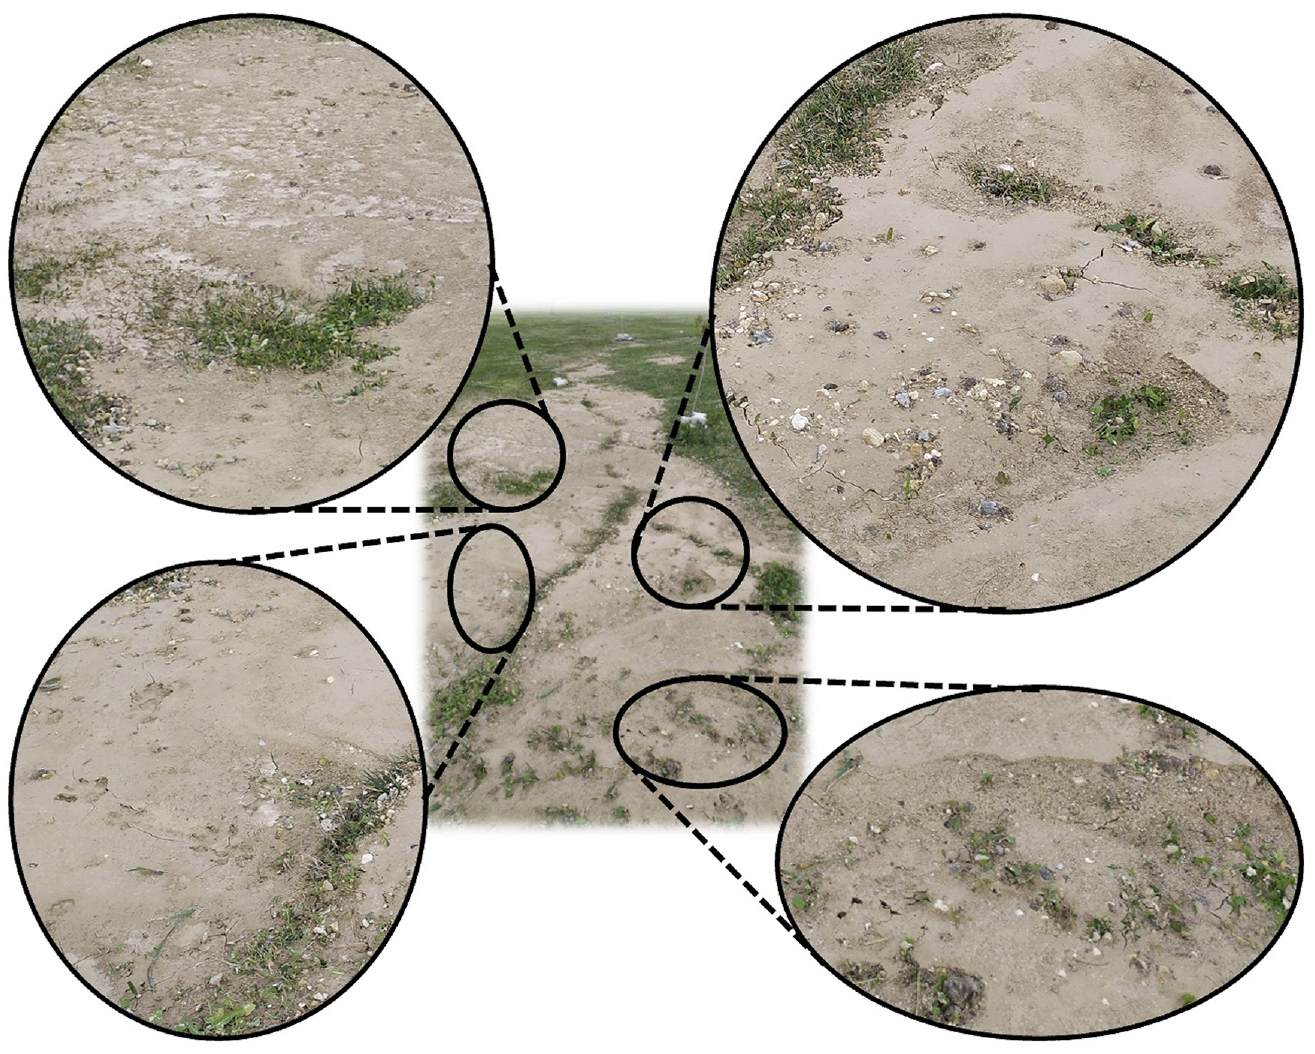
The ejecta samples S1, S2, and S4 were classified as SC, CH, and SC, respectively. The clayey nature of the ejecta became apparent also upon closer examination of high-resolution field pictures, shown in Figure 21. Their grain size distribution curves are shown in Figure 22, along with those of samples retrieved from various depths in nearby boreholes for comparison. Additionally, the grain size range of liquefaction susceptible soils recommended by Tsuchida (1970) is also shown on the same figure.
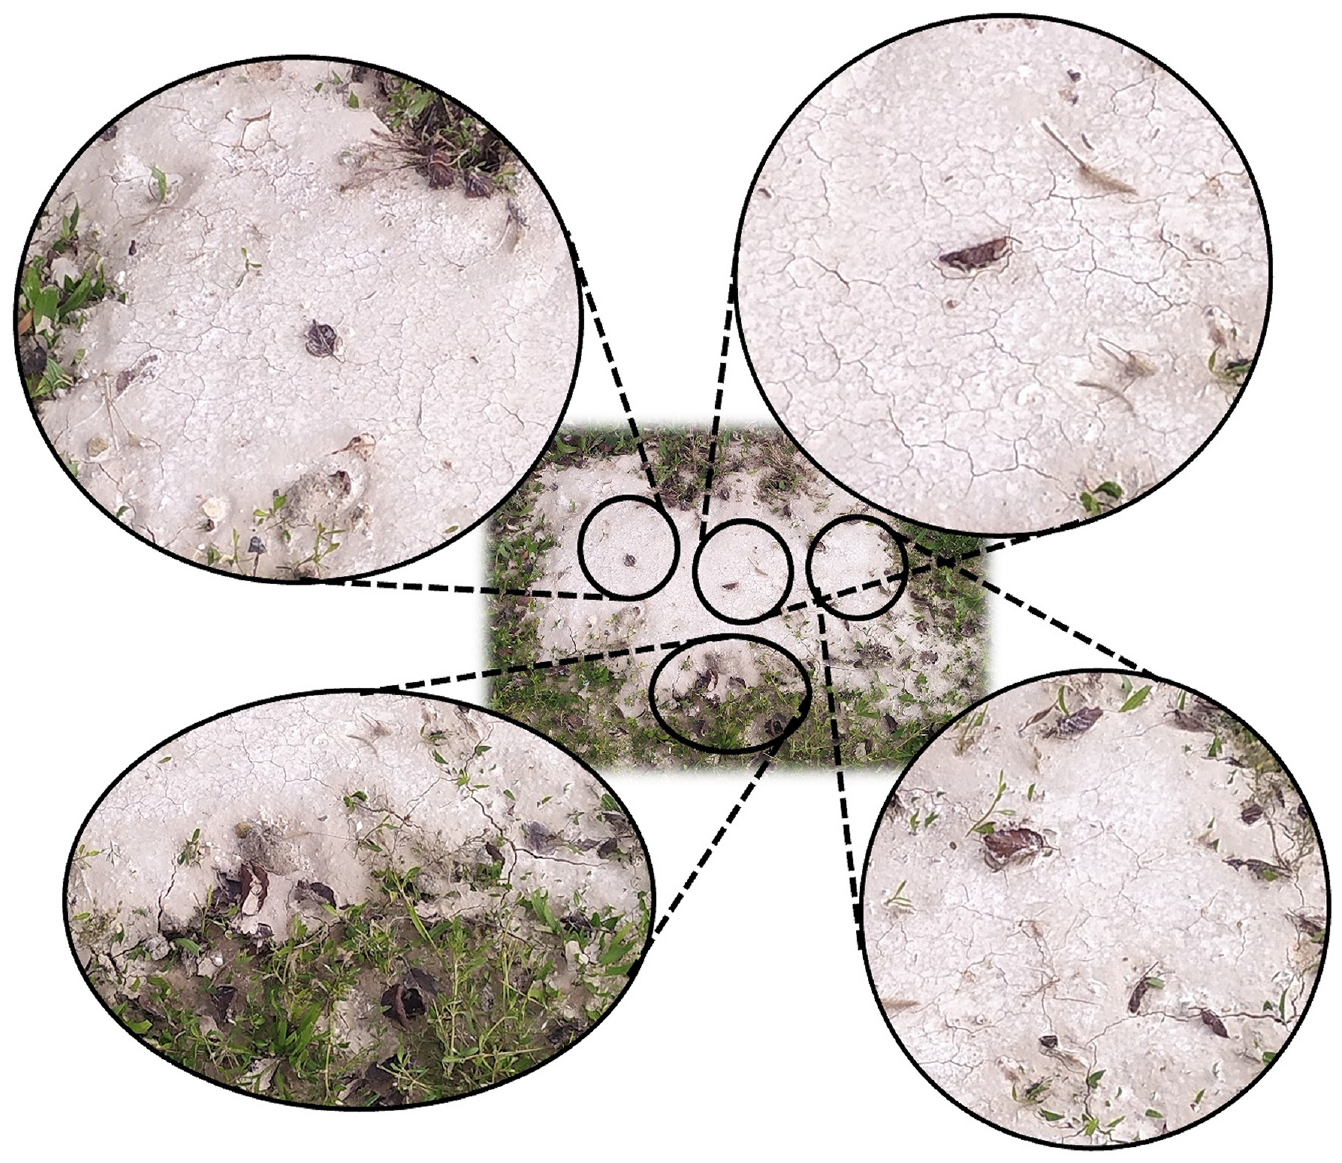
High-resolution field pictures of soil ejecta.
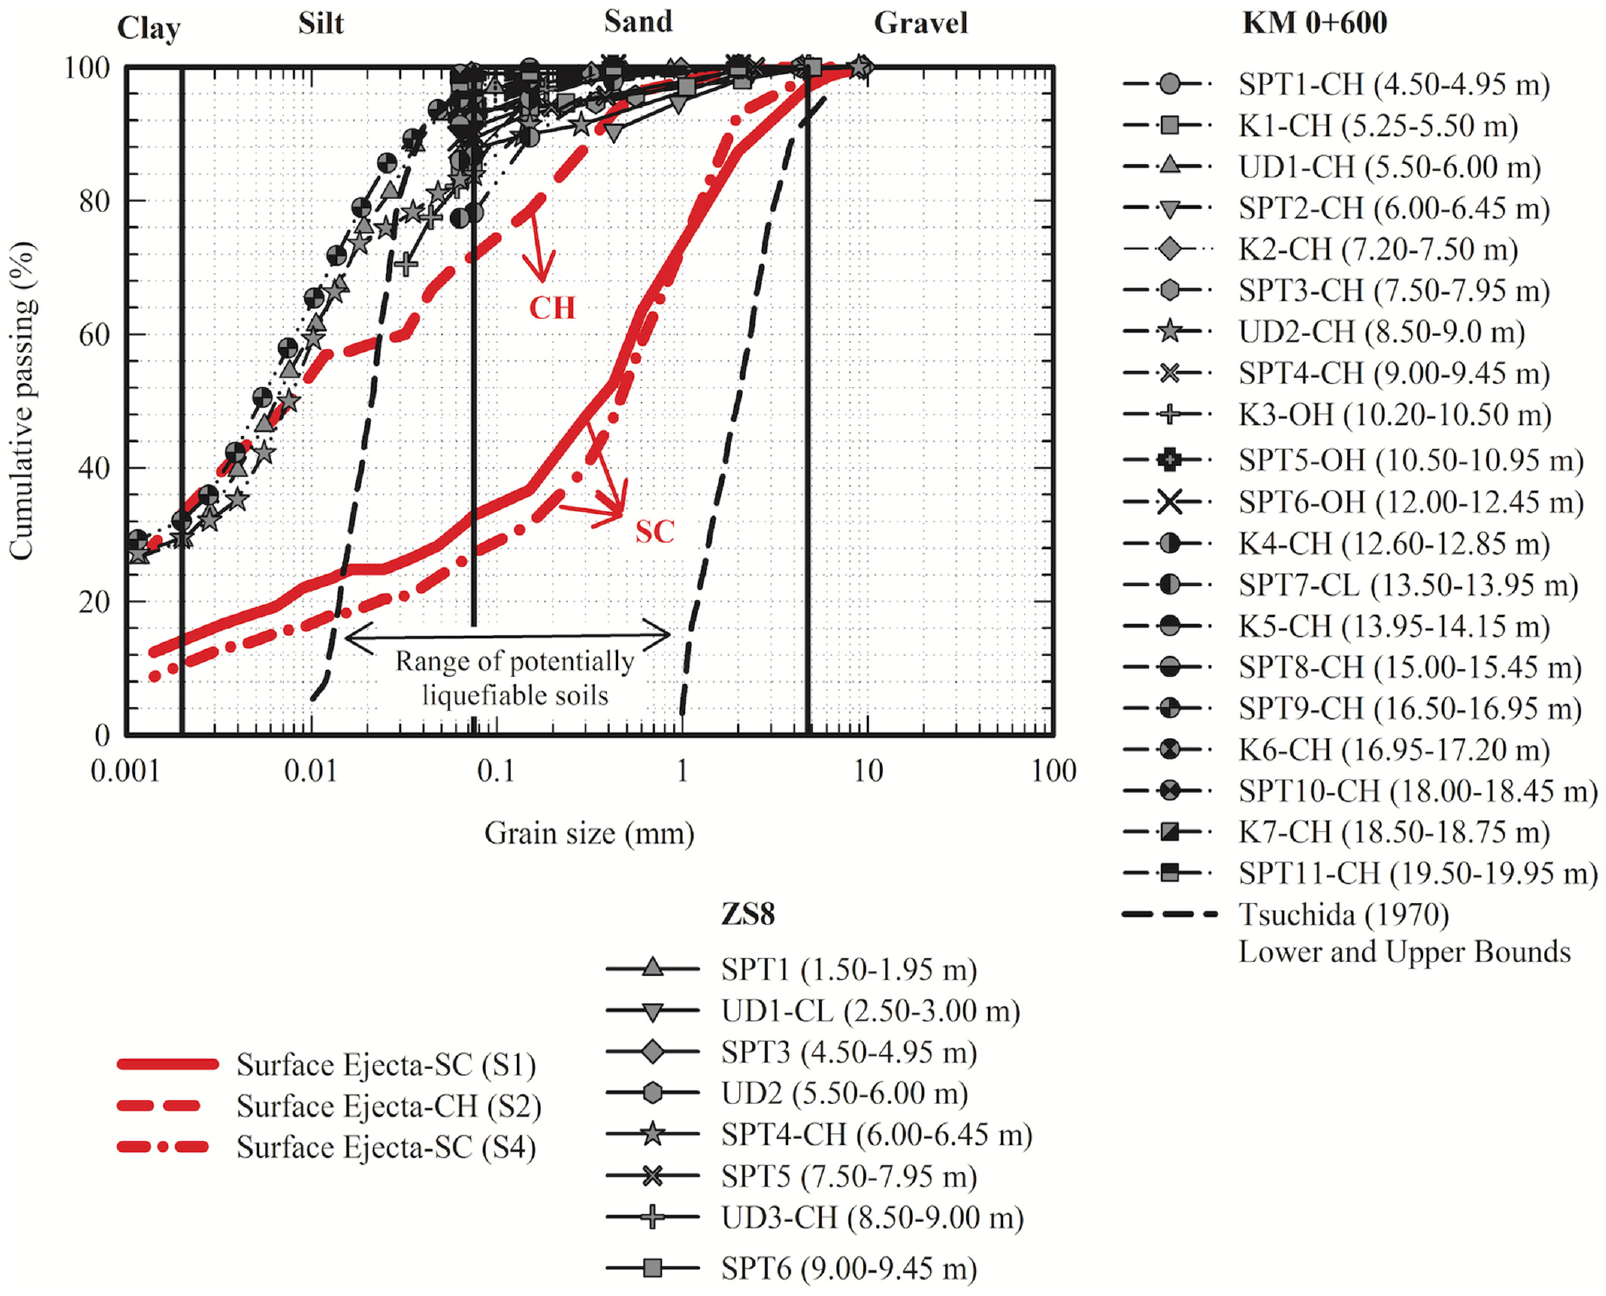
Grain size distribution curves of the soil ejecta, disturbed and undisturbed samples retrieved from boreholes in the region.
The grain size distribution characteristics of high-plasticity clay ejecta S2 closely match those of the natural soil samples retrieved from ZS8 and borehole at KM 0+600, particularly at depths of 5.5–6.0 m and 8.5–9.0 m (both undisturbed Shelby tube samples), as well as 16.5–16.95 m (SPT disturbed sample). To further illustrate this alignment, Figures 23 and 24 present the variation of SPT N82, fines content (FC), and consistency limits (LL, PL, PI) with depth for the same boreholes. On these figures, the variation of consistency limits—specifically, PL, PI, and LL values of the ejecta—are represented by continuous blue, red, and black lines. The close agreement of the natural soil consistency limits with the ejecta characteristic (i.e., blue triangles are scattered around the blue line, red circles around the red line, and black diamonds around the black line) suggests that the high-plasticity soil ejecta originate from natural clayey soils underlying the surficial fill layer.
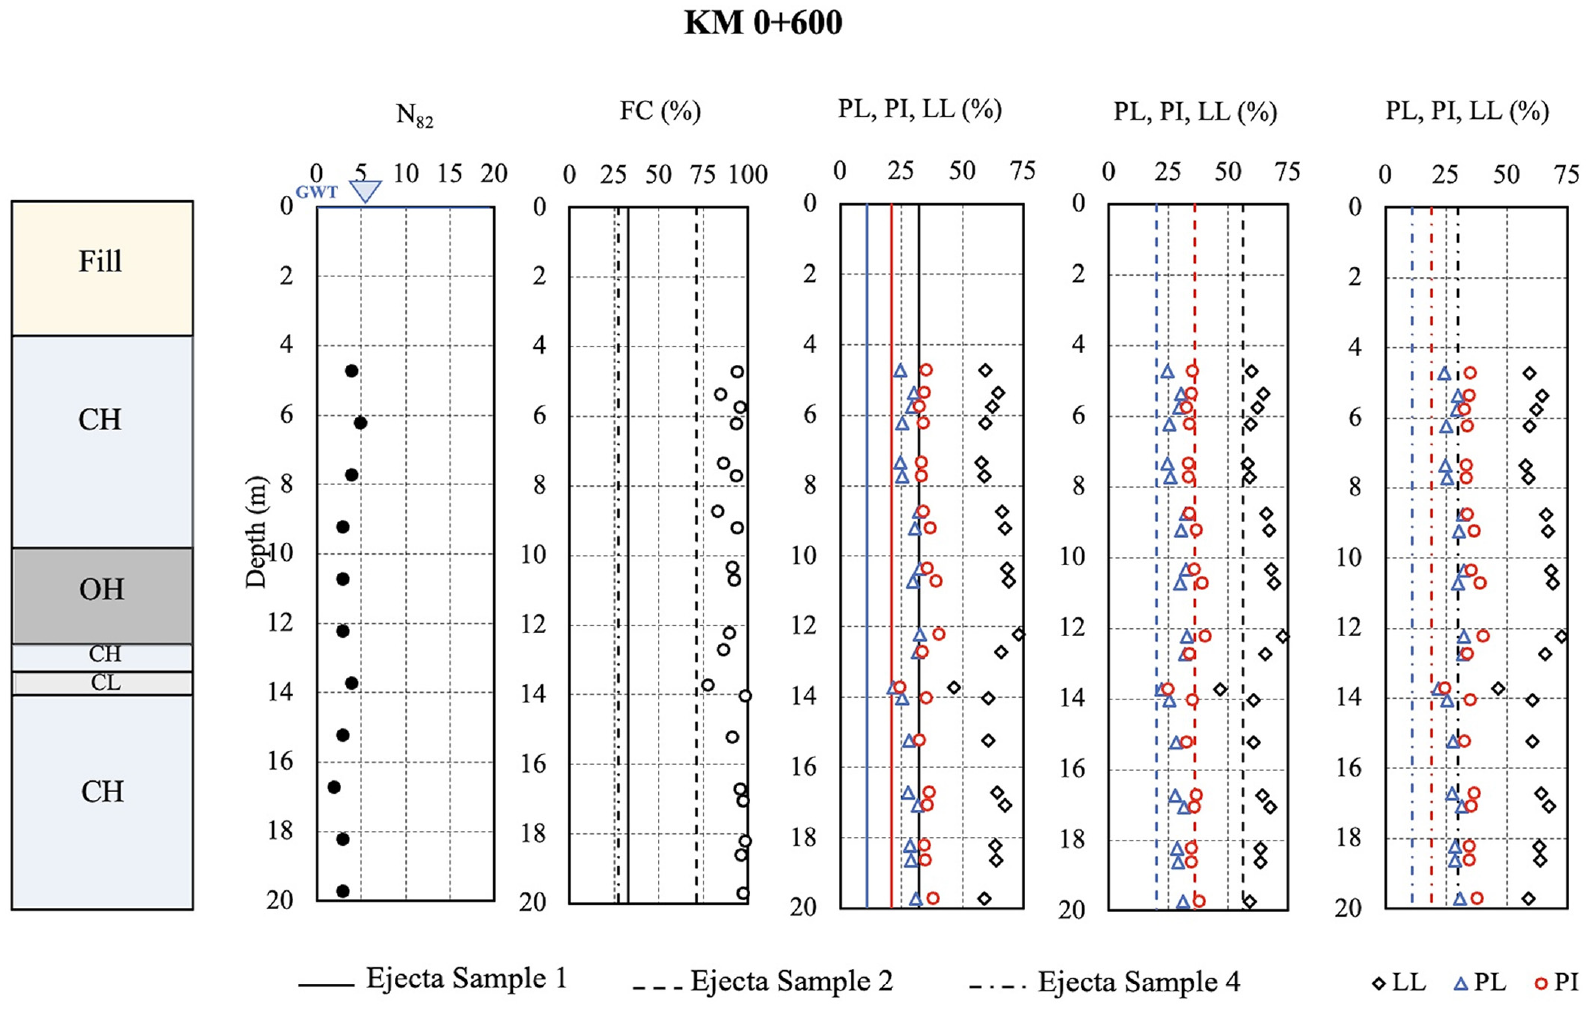
Idealized soil profile at borehole KM 0+600 along with the ejecta sample S1, S2, and S4’s FC, LL, PL, and PI values.
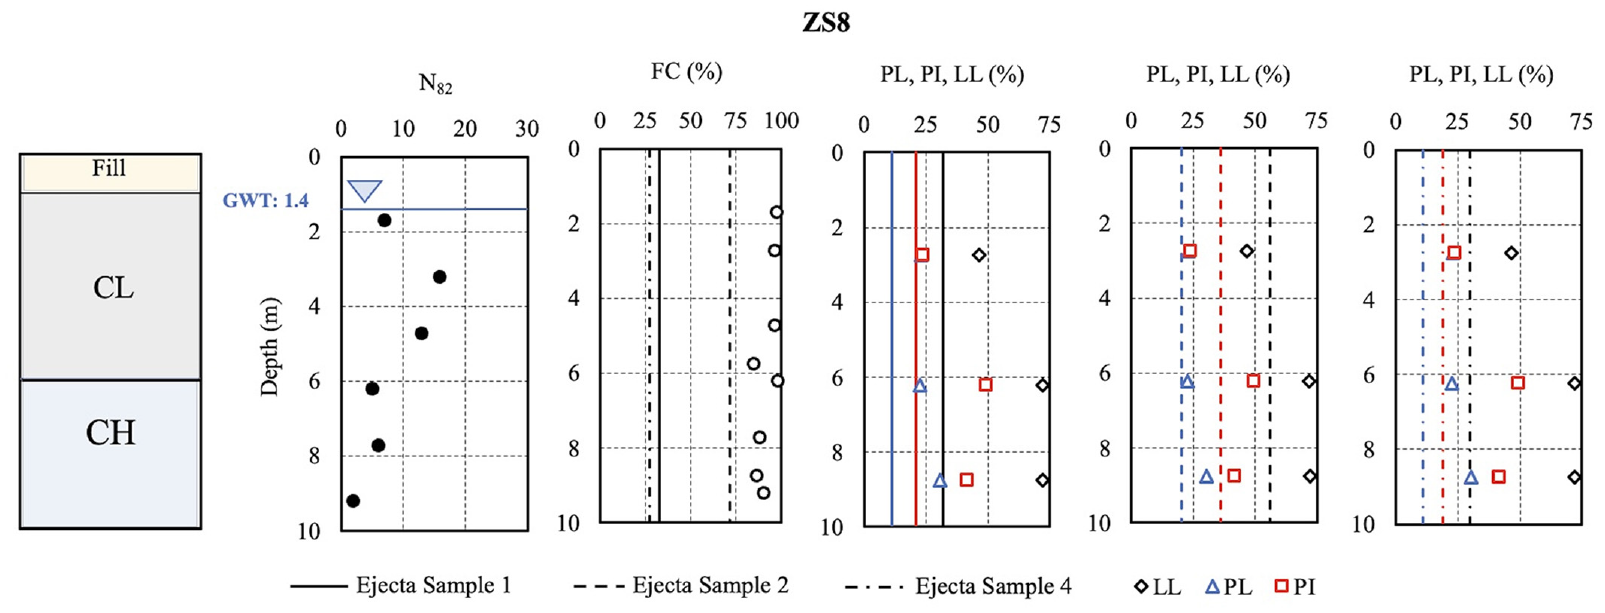
Idealized soil profile at borehole ZS8 along with the ejecta sample S1, S2, and S4’s FC, LL, PL, and PI values.
The grain size characteristics of the clayey sand ejecta samples (S1 and S4) appear coarser than those of the natural low to high-plasticity clayey deposits. This difference may stem from the intermixing of the clayey ejecta with surficial coarser-grained engineered fill located in the upper 1 to 3 meters of the soil profile. This intermixing could account for the sandy component in the clayey sand (SC) ejecta. Alternatively, there may be relatively thin sandy soil layers not identified in the boreholes that liquefied and eroded the low-plasticity to high-plasticity natural clayey layers as they seeped toward the ground surface. Another possibility is the existence of unidentified SC layers that liquefied. Determining the most likely scenario will require additional site investigation studies, including CPT soundings. While these studies have commenced, progress is slow due to the operational status of Hatay Airport. Once their results become available, they will be incorporated into the scope of a future study.
The ejecta samples from this region consist of fines greater than 25% and therefore do not fall within the region defined by Tsuchida (1970), which only classifies clean sands as susceptible to liquefaction. Due to fine-grained or fines-containing nature of ejecta and natural soils, their liquefaction susceptibility was evaluated using susceptibility charts developed by Seed et al. (2003), Bray and Sancio (2006), and Boulanger and Idriss (2006). Figure 25 presents these assessment results. The natural water contents of the ejecta samples were not evaluated due to their disturbed nature; therefore, the sample’s PI values are shaded for all possible wc/LL values in Bray and Sancio’s (2006) susceptibility chart.
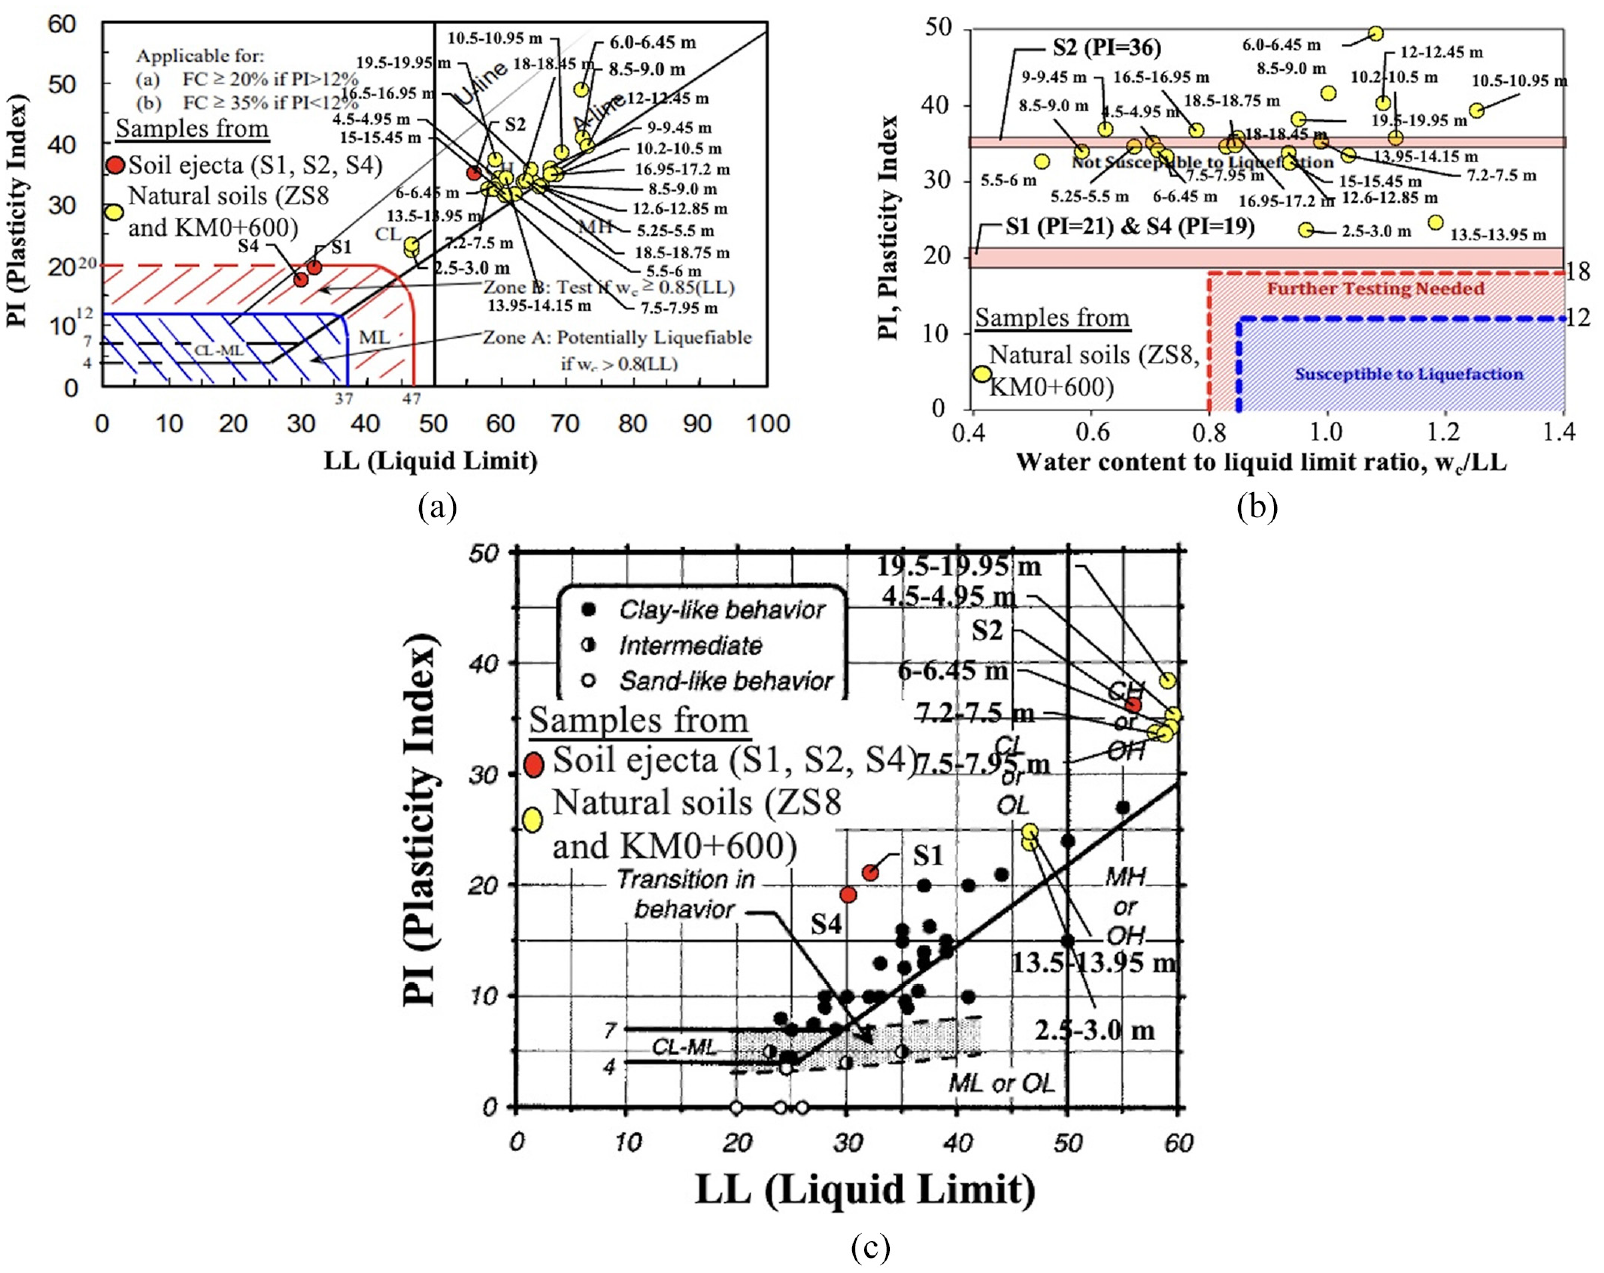
Liquefaction susceptibility assessment results of fine-grained soil samples in Region 1 shown on the (a) Seed et al. (2003), (b) Bray and Sancio (2006), and (c) Boulanger and Idriss (2006) susceptibility charts.
As presented in Figure 25, ejecta samples of clayey sands (i.e., S1 and S4) fall within the “further studies required” region defined by Seed et al. (2003), while they slightly exceed the border of the “not susceptible to liquefaction” zone defined by Bray and Sancio’s (2006) study. However, they are in the not susceptible zone in the Boulanger and Idriss (2006) study. Hence, the observations of clayey sand (SC) ejecta are consistent with the current state of knowledge regarding the first two studies. However, the high-plasticity clayey ejecta sample S2 falls into the “not susceptible” zone defined by all three studies, suggesting further in-depth assessments to resolve this inconsistency, including better identification of the origin and travel path of the ejecta material.
Region 2
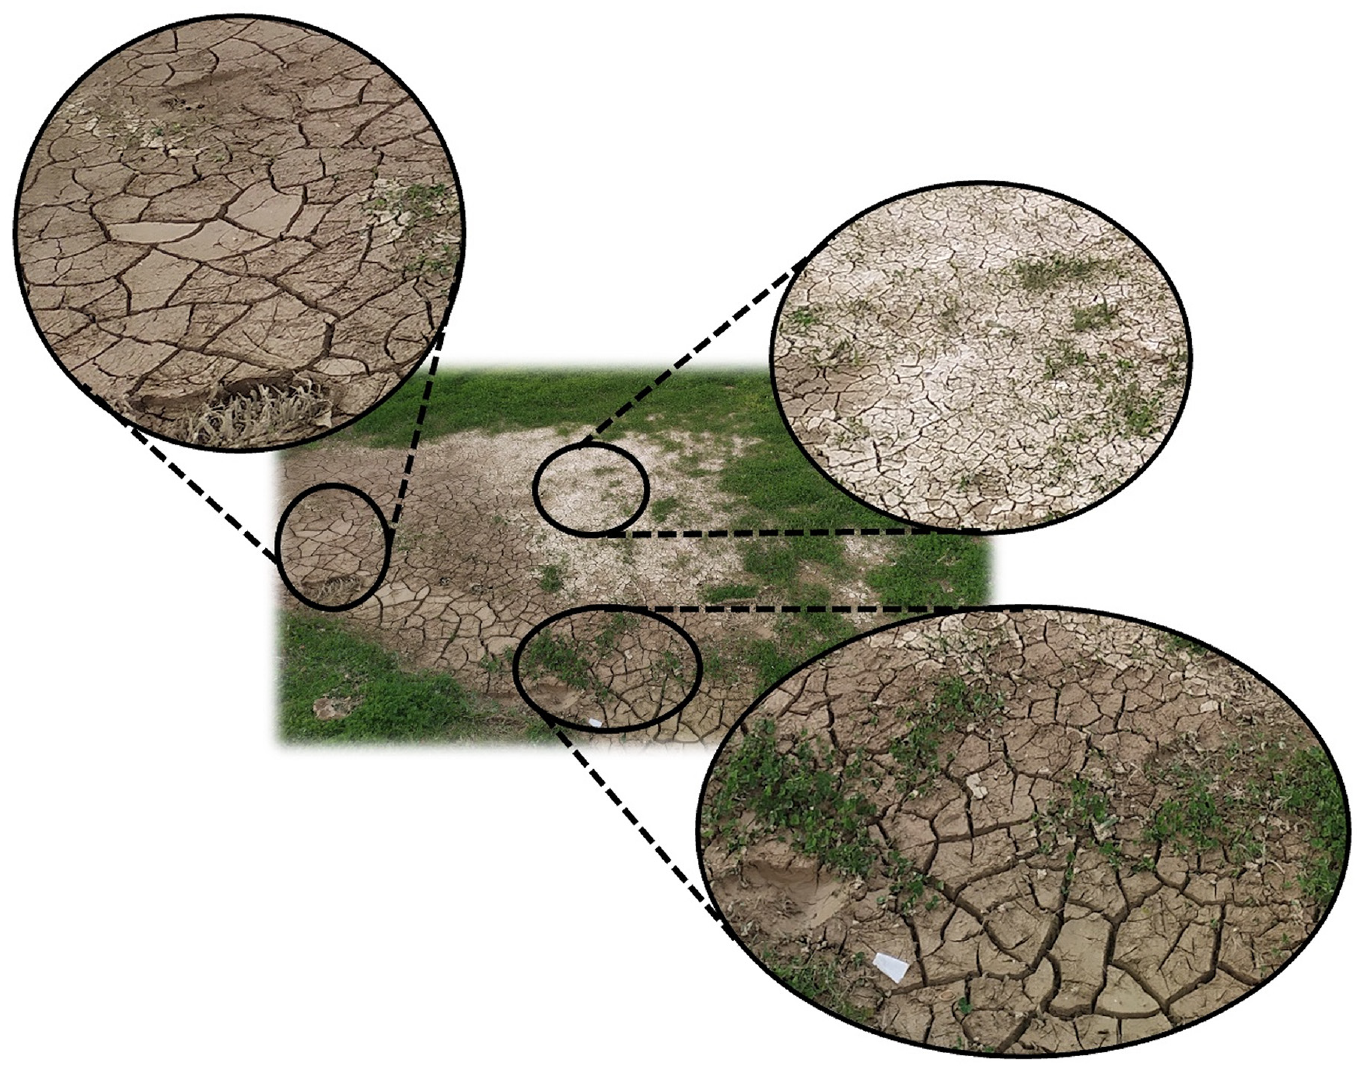
The ejecta sample located in this region, S5, was classified as clayey sand (SC). The sandy texture of the ejecta became apparent upon closer examination of high-resolution field pictures, shown in Figure 26. The ejecta sample’s grain size distribution curve is shown in Figure 27, along with those of samples retrieved from various depths in nearby boreholes for comparison.
High-resolution field pictures of soil ejecta.
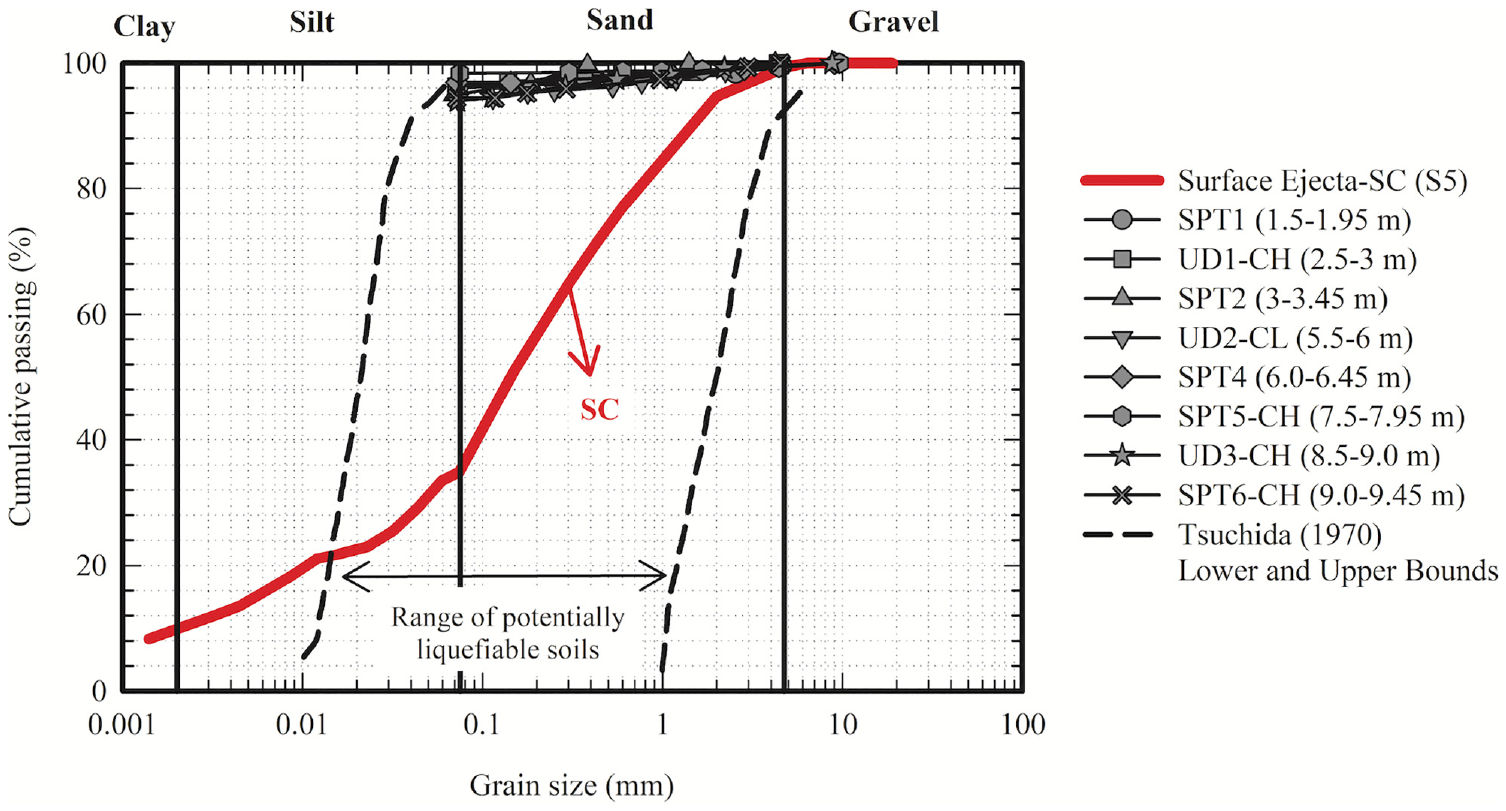
Grain size distribution curves of the soil ejecta, and disturbed and undisturbed samples retrieved from borehole in the region.
The grain size distribution characteristics of ejecta S5 do not exhibit similar characteristics of natural soil samples retrieved from borehole ZS11. Figure 28 presents the variation of SPT N82, fines content (FC), and consistency limits (LL, PL, PI) with depth for the same borehole. The variation of consistency limits values of the ejecta are represented by continuous blue, red, and black lines in this figure.
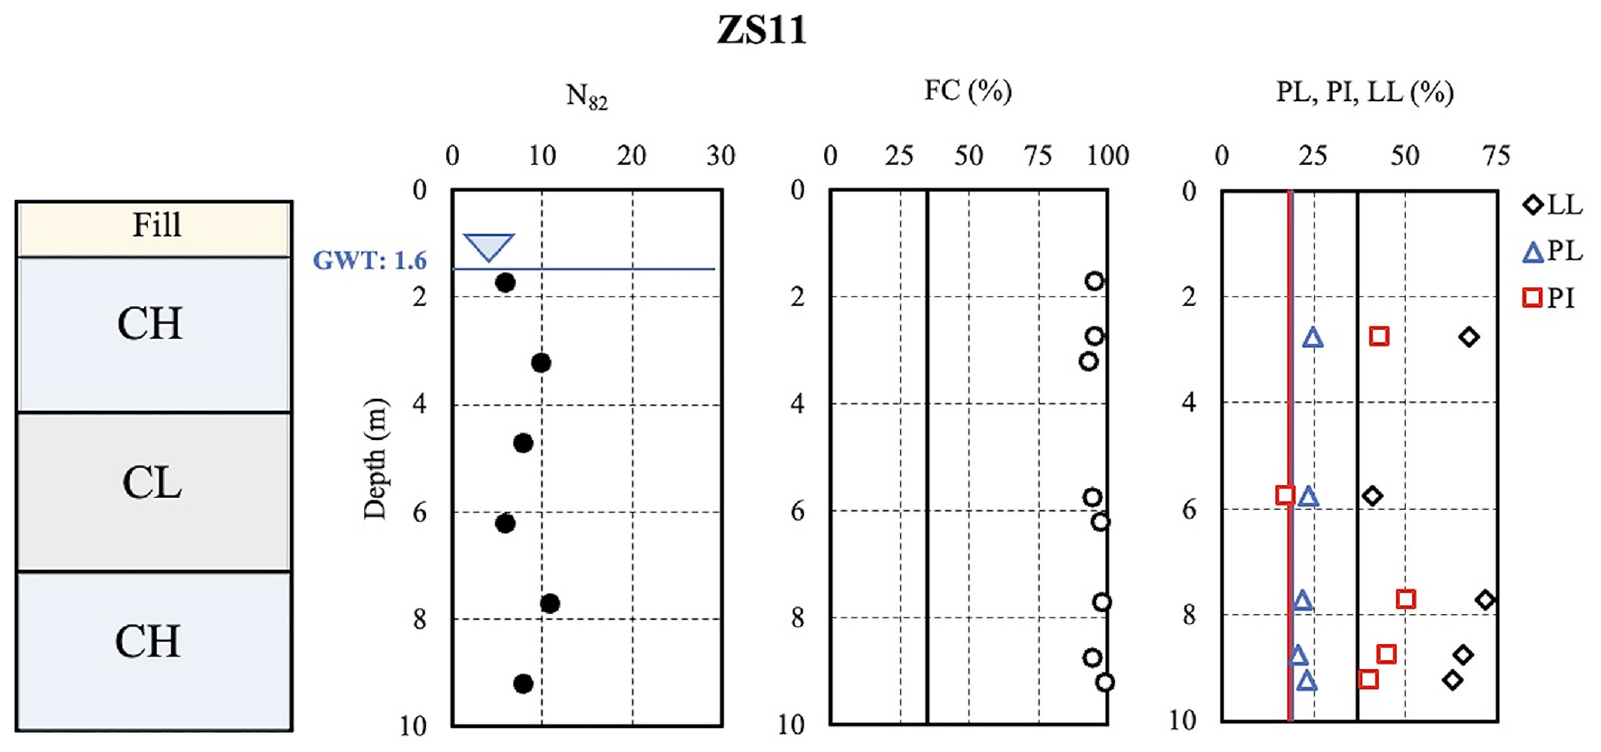
Idealized soil profile at borehole ZS11 along with the ejecta sample S5’s FC, LL, PL, and PI values.
Similar to the discussions presented for Region 1, the grain size characteristics of the clayey sand ejecta sample S5 appear coarser than those of the natural low- to high-plasticity clayey deposits. The arguments and discussions presented earlier for Region 1 regarding this inconsistency are also valid for this region and will not be repeated herein.
The ejecta sample from this region also consists of fines greater than 25% and again does not fall within the liquefiable soil region defined by Tsuchida (1970). Liquefaction susceptibility of the ejecta soil and natural soil layers were evaluated using susceptibility charts developed by Seed et al. (2003), Bray and Sancio (2006), and Boulanger and Idriss (2006).
As presented in Figure 29, the ejecta sample of clayey sand (S5) and the natural soil sample retrieved at a depth of 5.5–6.0 m (undisturbed Shelby tube sample), fall within or at the boundary of the “further studies required” region defined by Seed et al. (2003) and Bray and Sancio (2006). It is in the not susceptible zone in the Boulanger and Idriss (2006) study. Hence, the observation of a clayey sand (SC) ejecta is concluded to be consistent with the current state of knowledge regarding the Seed et al. (2003) and Bray and Sancio (2006) studies.
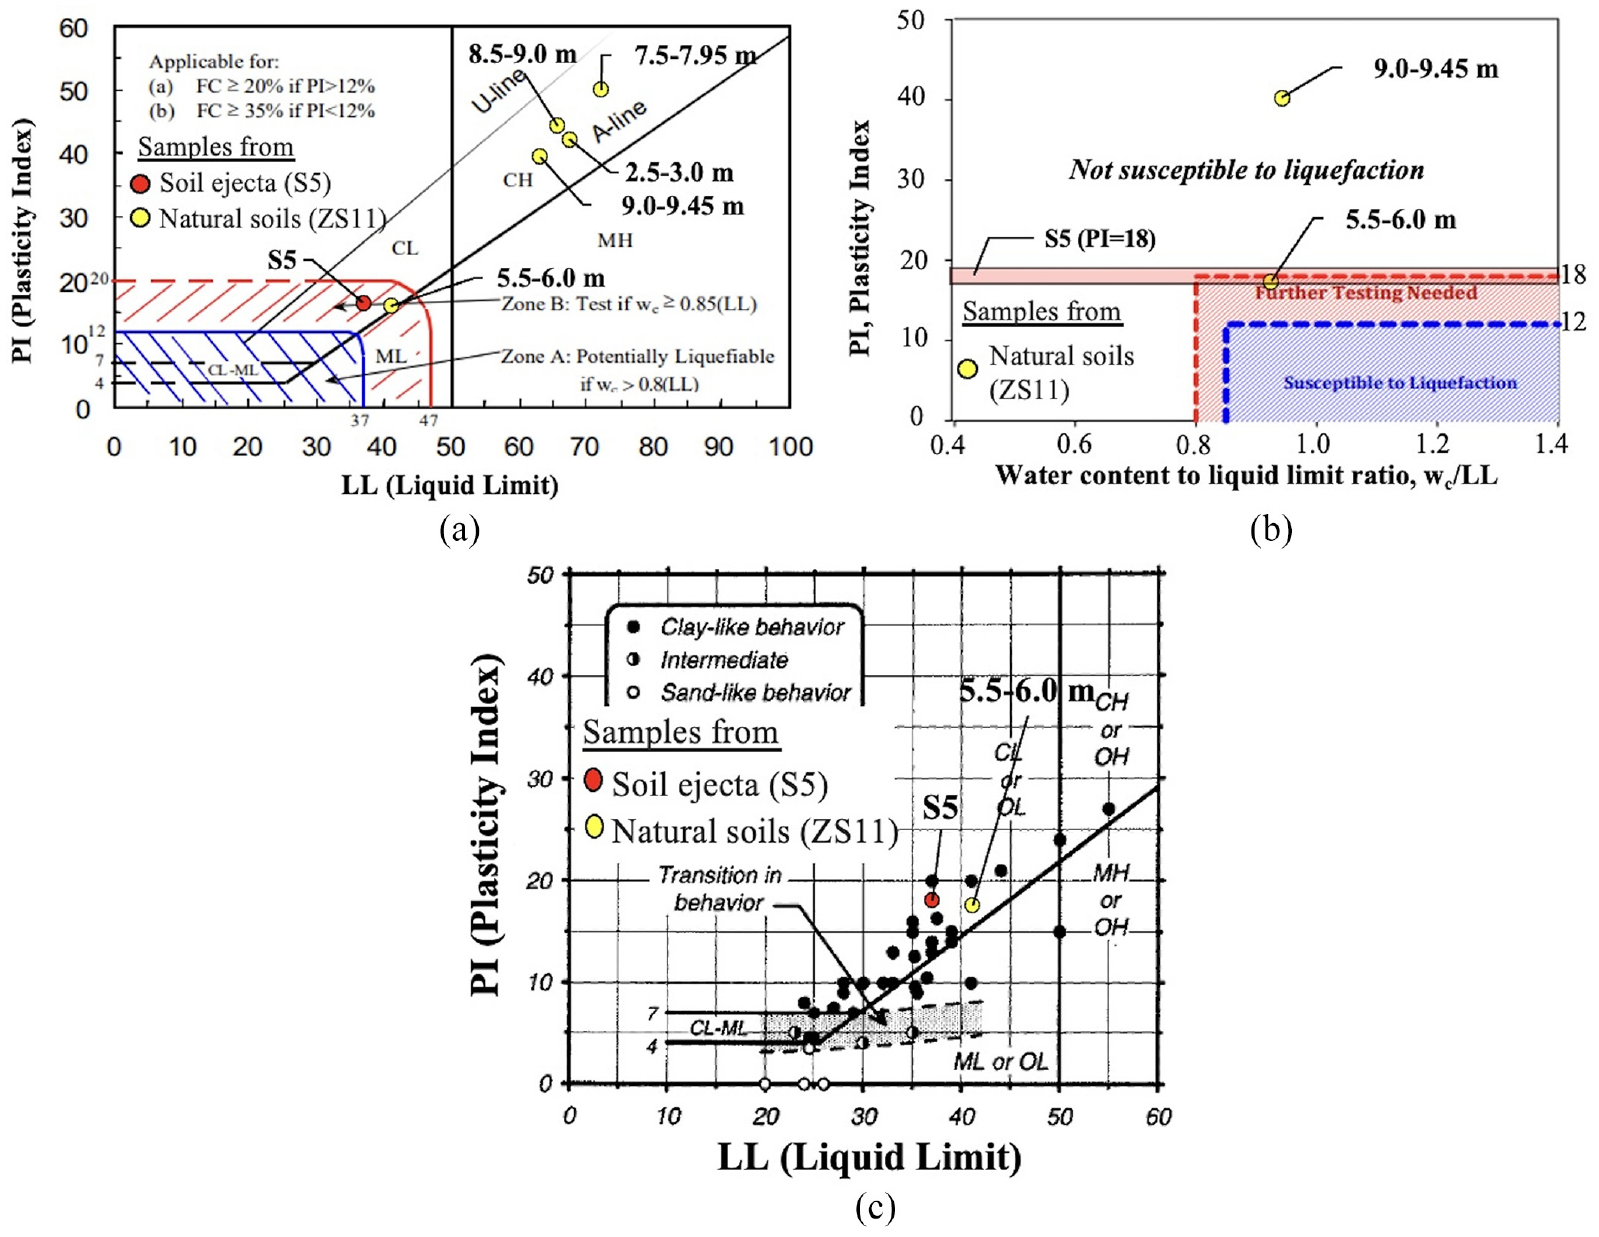
Liquefaction susceptibility assessment results of fine-grained soil sample in Region 2 shown on the (a) Seed et al. (2003), (b) Bray and Sancio (2006), and (c) Boulanger and Idriss (2006) susceptibility charts.
Region 3
The ejecta sample S3 was classified as low-plasticity clay (CL). The clayey nature of the ejecta became apparent upon closer examination of high-resolution field pictures, as shown in Figure 30. The grain size distribution curve of the ejecta sample is shown in Figure 31, along with those of samples retrieved from various depths in nearby borehole ZS5 for comparison.
High-resolution field pictures of soil ejecta.
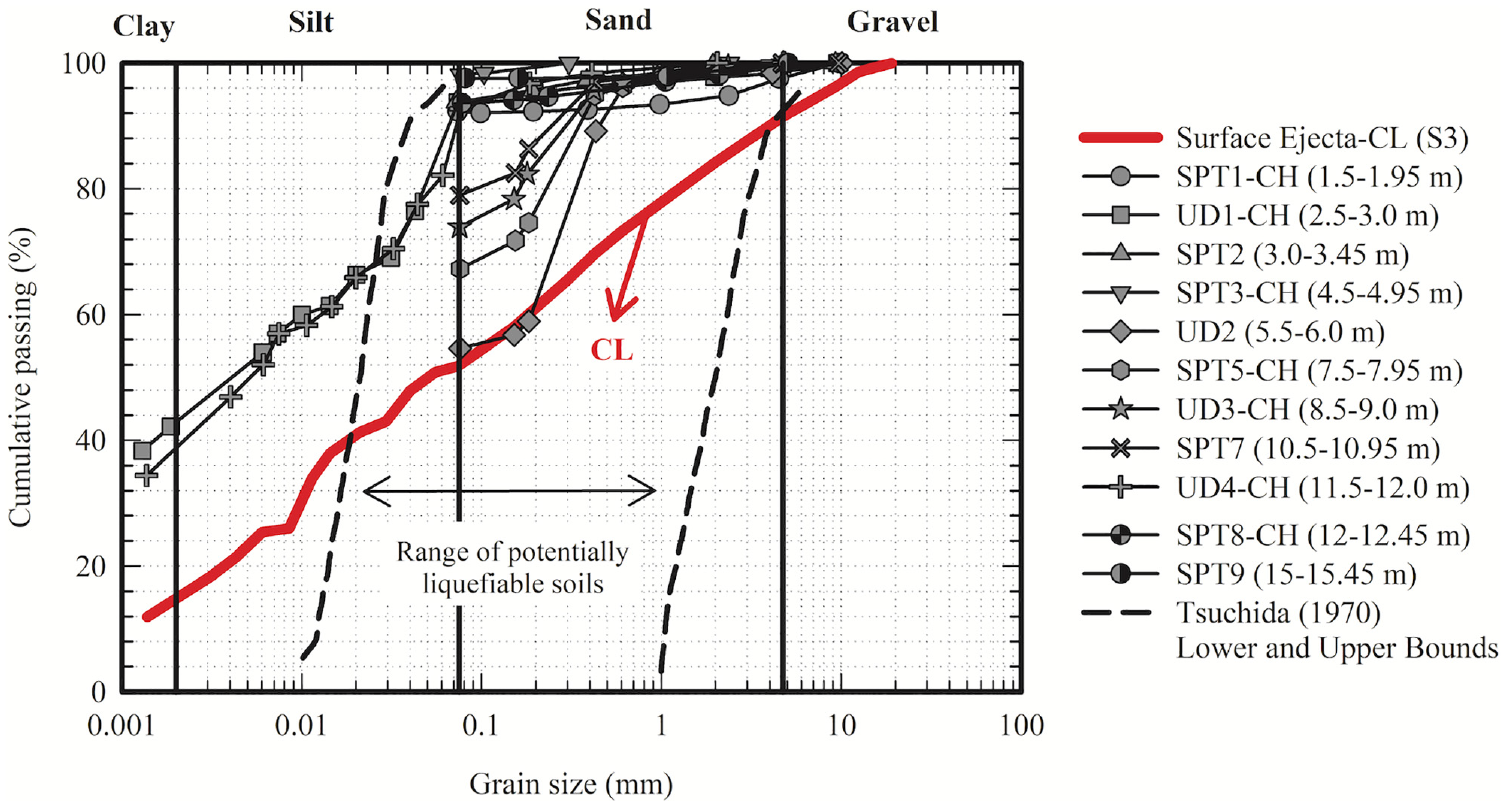
Particle size distribution curves of the soil ejecta retrieved from the site, disturbed and undisturbed samples taken from the region.
The grain size distribution characteristics of the low-plasticity clay ejecta S3 exhibit some similarity with those of the natural soil samples retrieved from ZS5, particularly at depths of 5.5–6.0 m (undisturbed Shelby tube samples). To further compare the ejecta sample characteristics with those of natural soils, the variations of SPT N82, fines content (FC), and consistency limits (LL, PL, PI) with depth are presented in Figure 32. In this figure, the variation of consistency limits values of the ejecta are represented by continuous blue, red, and black lines. The PI data also suggest some similarity between the characteristics of ejecta and natural soils at depths 2 to 3 m, 8 to 9 m, and 12 to 13 m. However, it should be noted that the ejecta sample is low plasticity as opposed to natural soils mostly being high-plasticity clays. This difference may stem from the possibility that there may be relatively thin low-plasticity clay layers, not identified in the boreholes, that liquefied. Resolving the source of this difference will require additional site investigation studies, including CPT soundings. While these studies have commenced, progress is slow due to the operational status of Hatay Airport. Once their results become available, they will be incorporated into the scope of a future study.
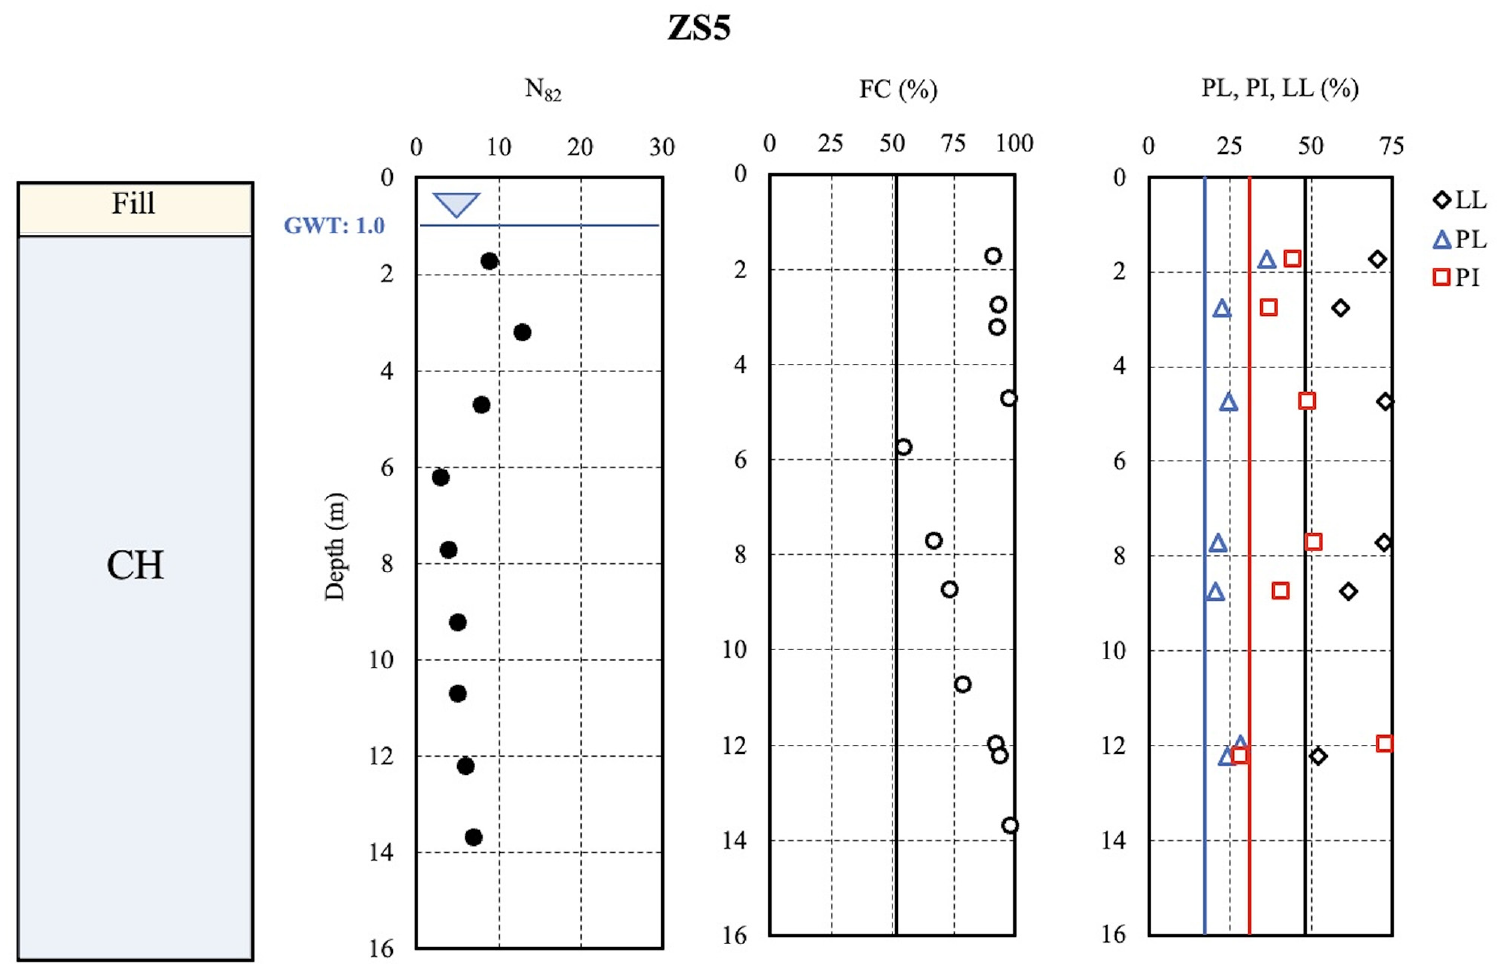
Idealized soil profile at borehole ZS5 along with the ejecta sample S3’s FC, LL, PL, and PI values.
The ejecta sample from this region consists of fines greater than 50% and does not fall within the region defined by Tsuchida (1970), which only classifies clean sands as susceptible to liquefaction. To assess the liquefaction susceptibility of both the ejecta soil and the natural soil layers, susceptibility charts developed by Seed et al. (2003), Bray and Sancio (2006), and Boulanger and Idriss (2006) were utilized.
As presented in Figure 33, all data points fall outside the zone defined as susceptible to liquefaction in all three studies. This suggests the need for further in-depth assessments to resolve this inconsistency, including better identification of the origin and travel path of the ejecta material. These additional investigations may provide insights into the mechanisms underlying the observed discrepancies and help refine our understanding of the liquefaction susceptibility of the soil in the region.
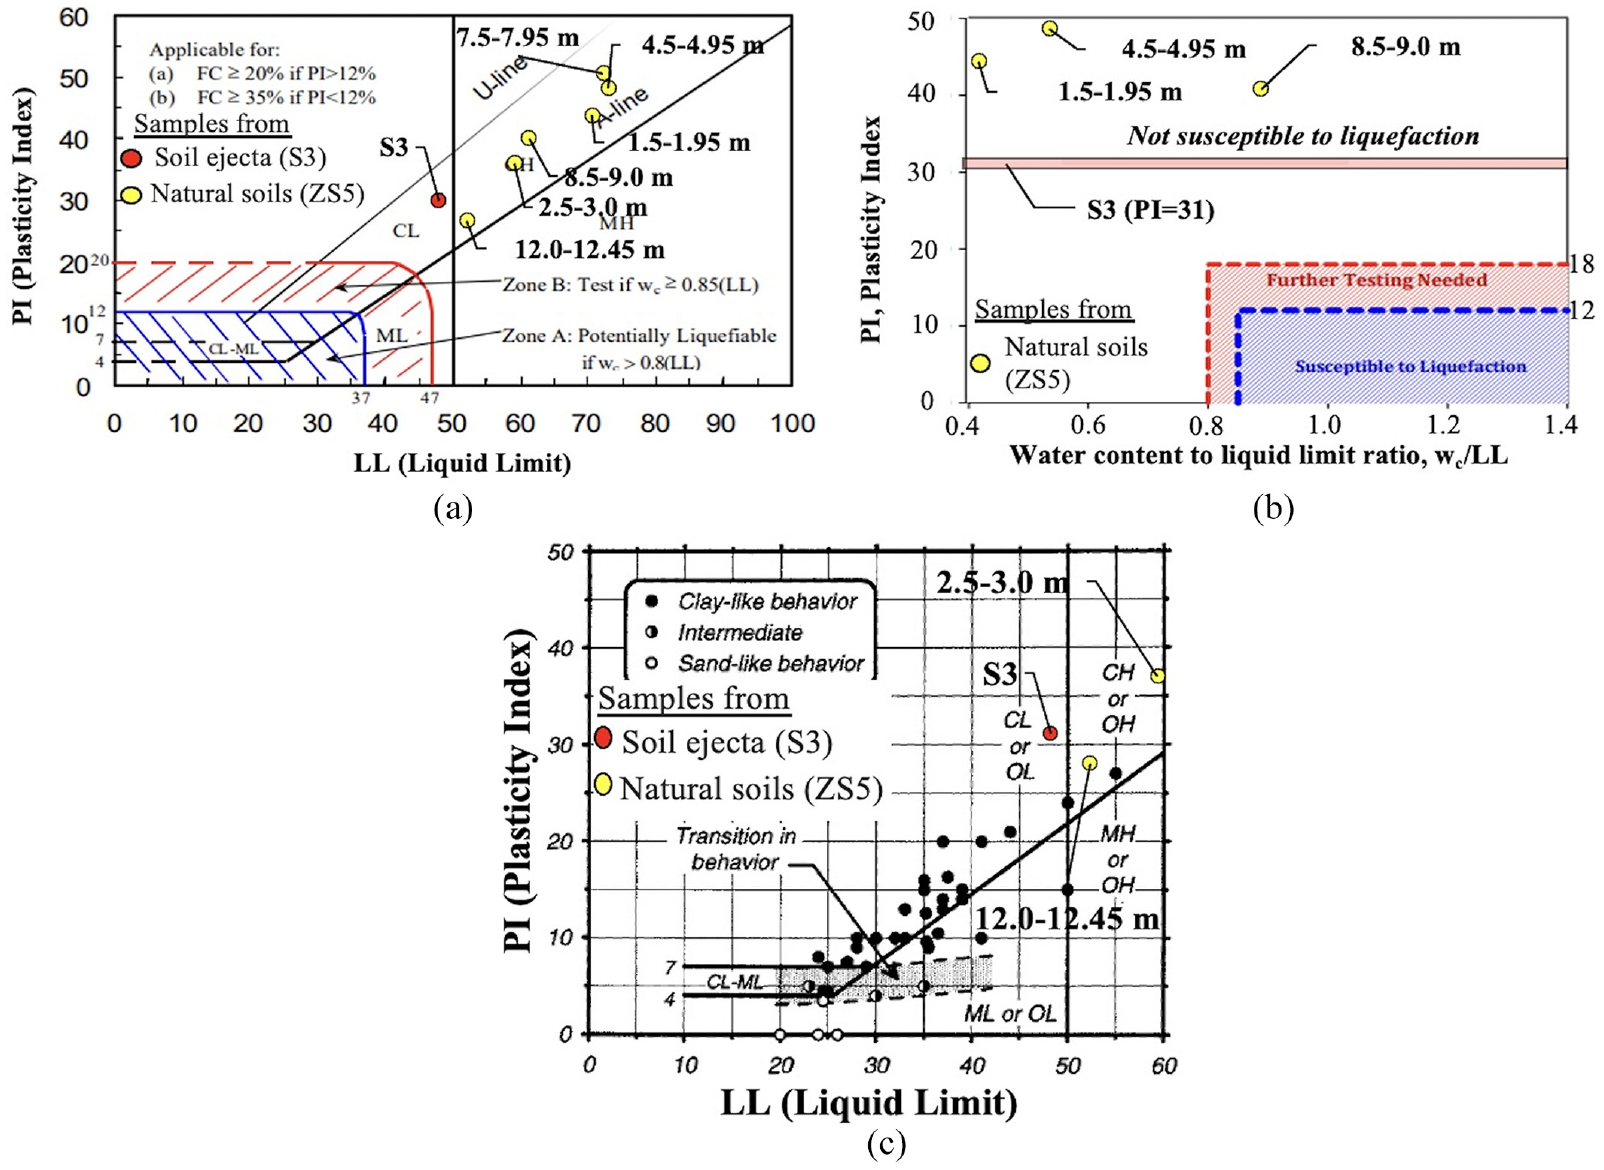
Liquefaction susceptibility assessment results of fine-grained soil samples in Region 3 shown on the (a) Seed et al. (2003), (b) Bray and Sancio (2006), and (c) Boulanger and Idriss (2006) susceptibility charts.
Region 4
In this region, the soil ejecta was identified from the satellite images. Unfortunately, due to heavy rains and flooding following days after the earthquakes, no ejecta samples were able to be collected. Hence, for the sake of completeness, only the data from borehole KM 4+000 is presented without cross-comparisons and susceptibility discussions. The grain size distribution curves of natural soils are shown in Figure 34, along with the grain size range of liquefaction susceptible soils recommended by Tsuchida (1970). It is evident that the natural soils in this region are composed of high-plasticity clays with the rare occurrence of high-plasticity silts and organics.
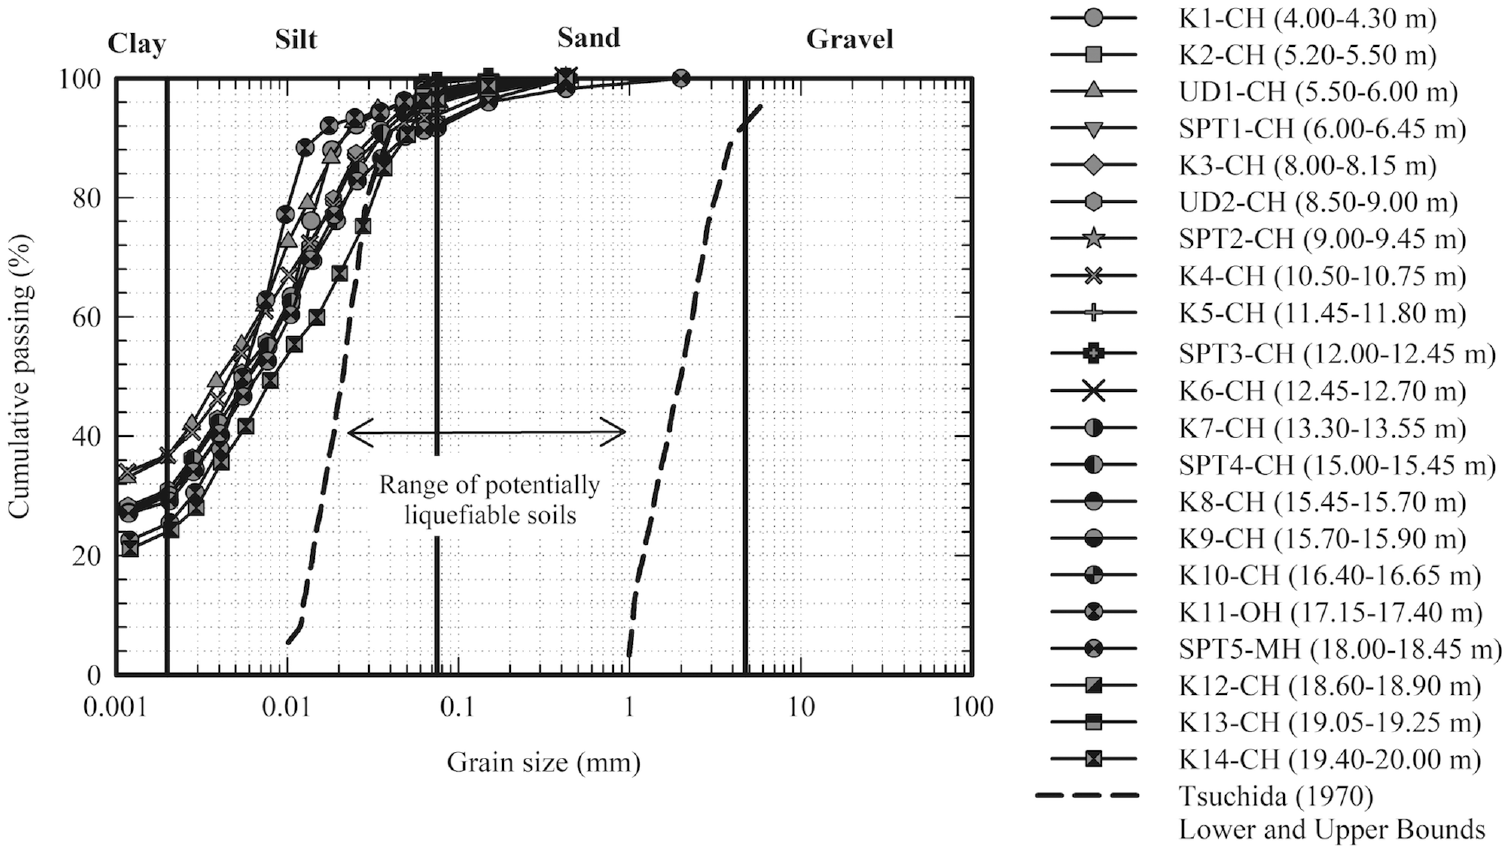
Particle size distribution curves of the disturbed and undisturbed samples taken from the region.
Figure 35 presents the variation of SPT N82, fines content (FC), and consistency limits (LL, PL, PI) with depth, conforming to the high-plasticity clayey nature of natural soil deposits.
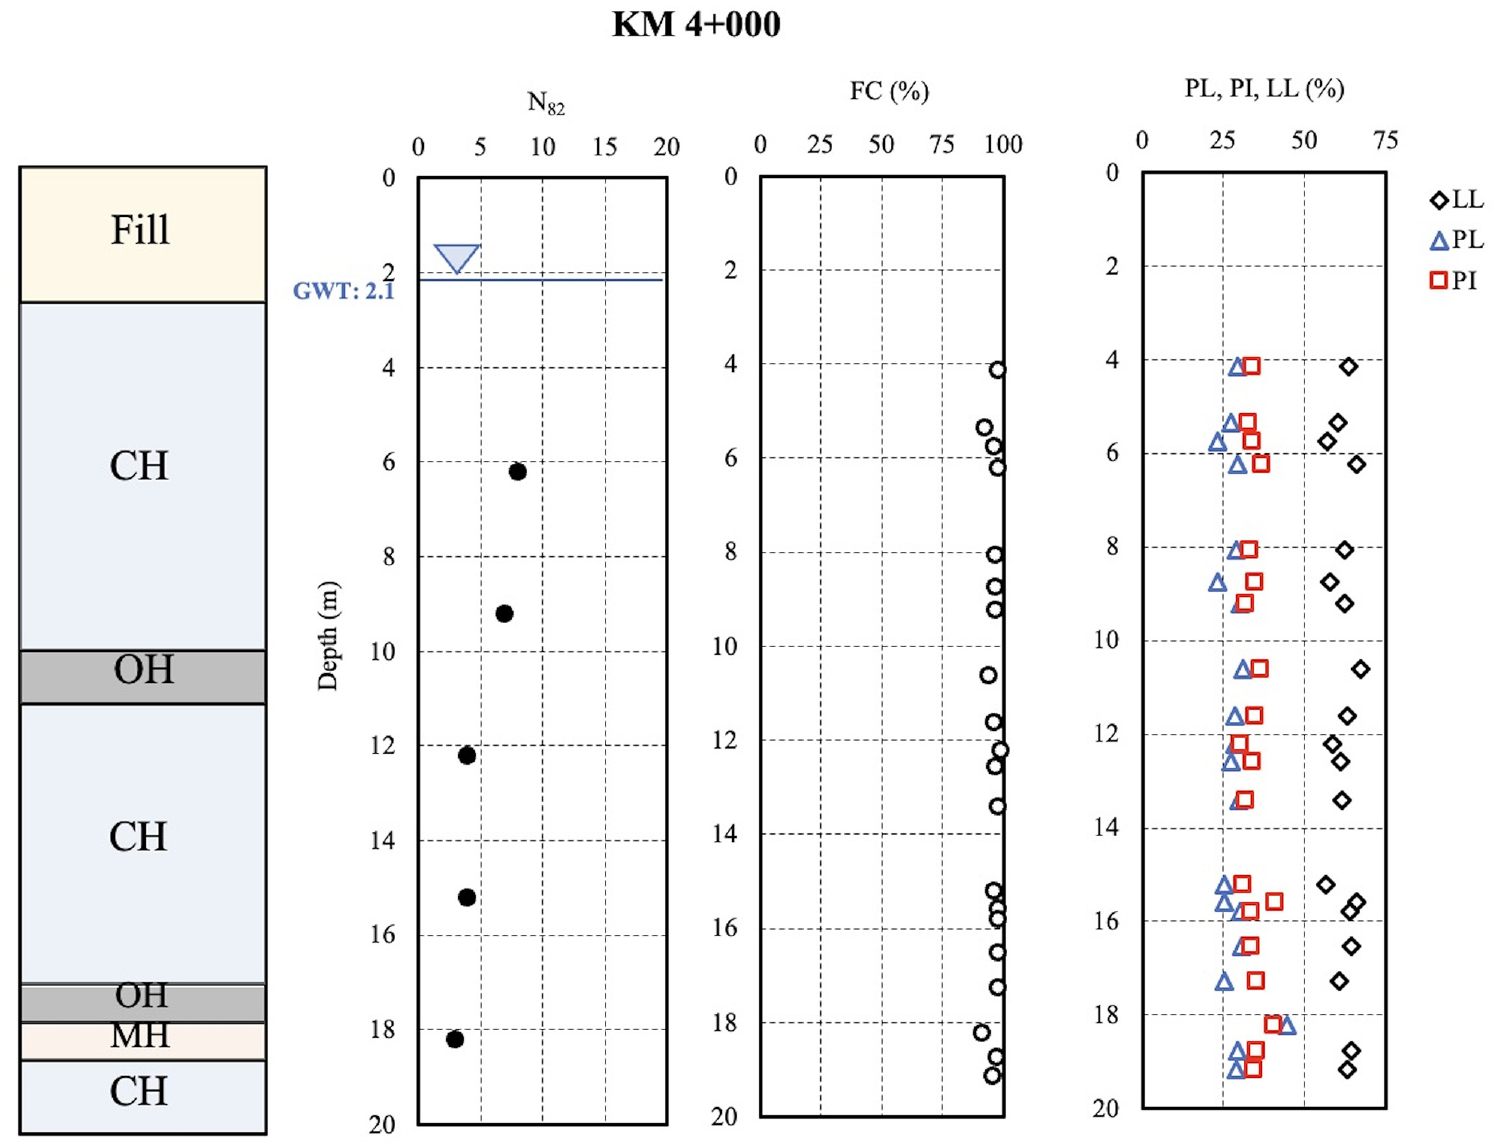
Idealized soil profile at borehole KM 4+000 along with borehole sample’s FC, LL, PL, and PI values.
Having lost the traces of seismic soil liquefaction after heavy rain and flooding emphasized once again the importance of collecting perishable data immediately after earthquakes in a timely manner.
Summary and conclusions
On February 6, 2023, Pazarcık and Ekinözü-Elbistan earthquakes with Mw 7.8 and Mw 7.5 occurred in Kahramanmaraş-Türkiye. Two weeks after these earthquakes, on February 20, the Mw 6.3 Yayladağı earthquake hit again the metropolitan city of Hatay. This paper presents a discussion on surface manifestations of soil liquefaction at Hatay Airport following these seismic events. The surface manifestations of seismic soil liquefaction were documented in the form of soil ejecta, ground cracking, excessive settlements, and floated manholes. Samples were retrieved from the soil ejecta during reconnaissance studies performed immediately after the Pazarcık and Ekinözü-Elbistan earthquakes.
A comprehensive set of site investigation studies was conducted during both the initial engineering design phase of the airport and in the aftermath of the earthquakes. These studies encompassed various methods, including borehole drilling, sampling both disturbed and undisturbed, in-situ tests such as pressuremeter and standard penetration tests (SPT), and laboratory analyses including soil classification and triaxial tests. The data collected from these investigations were utilized for evaluating liquefaction susceptibility and related engineering assessments.
The soil ejecta samples retrieved from the site were classified as clayey sand (SC), low-plasticity clay (CL), and high-plasticity clay (CH) with PI values of 31 and 36%, respectively. Contrary to general expectations of ejecta soils being composed of mostly clean sands and/or nonplastic silts, the ejecta samples contain significant amounts of plastic fines (SC, CL, or CH). Therefore, they did not fall within the region defined by Tsuchida (1970), which only classifies clean sands as susceptible to liquefaction.
Due to the presence of a significant amount of fines in ejecta and natural soils, their liquefaction susceptibility was evaluated using the procedures outlined by Seed et al. (2003), Bray and Sancio (2006), and Boulanger and Idsriss (2006). Among the five ejecta samples, three of them—namely S1, S4, and S5—fall within or near the boundary of the “further studies required” region on the susceptibility charts. These particular samples are all classified as clayey sand. Analysis of available borelogs and laboratory tests performed on disturbed and undisturbed soils indicate that the natural soil deposits consist mainly of low-plasticity or high-plasticity clays, with occasional occurrences of organic soils and silt and sand lenses. The grain size characteristics of the clayey sand ejecta samples (S1, S4, and S5) appear coarser compared to the natural clayey deposits with varying plasticity levels. This difference might be attributed to the mixing of the clayey ejecta with coarser-grained engineered fill present in the upper 1 to 3 meters of the soil profile. Such mixing could account for a sandy component in the clayey sand (SC) ejecta. Alternatively, it is possible that thin sandy soil layers, undetected during borehole investigations, liquefied during the seismic events, and induced excess pore water seepage eroded the natural clayey soils, leading to the observed characteristics of the ejecta samples. Another possibility is the existence of unidentified layers of clayey sand (SC) layers that underwent liquefaction during the earthquakes.
The ejecta samples S2 and S3 fall in the “not susceptible” region. These samples are categorized as high-plasticity (CH) and low-plasticity (CL) clays, respectively, with plasticity index (PI) values of 36% and 31%. The clayey and plastic nature of these ejecta samples was evident even upon closer examination of high-resolution field photographs. The deviation from the current state of knowledge could arise from two likely scenarios: (1) excess pore water pressure-induced seepage during liquefaction of loose sandy and nonplastic silty deposits, which, unidentified during borings, eroded clayey soils to the ground surface and (2) current liquefaction susceptibility assessment methods for fine-grained soils may not accurately delineate the boundaries between susceptible and not-susceptible zones. Determining the most likely scenario requires additional site investigation studies, including CPT soundings. Further detailed site investigation studies, extending beyond the scope of this reconnaissance study, are necessary to provide a comprehensive characterization of the soil profiles at the site and to resolve any ambiguity regarding the potential presence of nonplastic silts and sand lenses. These studies have commenced; however, the progress is slow due to the operational status of Hatay Airport. Once their results become available, they will be incorporated into the scope of a future study.
The data and results presented in this study are expected to contribute significantly to the ongoing development and refinement of empirical and analytical methods for assessing hazards associated with liquefaction susceptibility and triggering. It is anticipated that these findings will lead to more accurate and reliable methods, enhancing our ability to identify liquefiable soils.
Footnotes
Declaration of conflicting interests
The author(s) declared no potential conflicts of interest with respect to the research, authorship, and/or publication of this article.
Funding
The author(s) disclosed receipt of the following financial support for the research, authorship, and/or publication of this article: We would like to acknowledge the partial funding provided for the fieldwork by The Scientific and Technological Research Council of Turkiye (TÜBİTAK) “1002-C Natural Disasters-Focused Fieldwork Emergency Support Program (Doğal Afetler Odaklı Saha Çalışması Acil Destek Programı).”
Data and resources
The data generated and/or analyzed during the current study are available in the provided references.