
Abstract
To reduce disaster impacts, initiatives have been promoted to assess seismic risk in developing countries like Colombia. To achieve this, it is crucial to develop exposure models that consolidate parameters of assets that may be affected by a seismic event, including their geographic location, material, structural system, and economic value. This last parameter is often assessed by using the asset replacement cost. Replacement cost valuations are often based on rough estimates that overlook factors like demolition, material transport, land suitability, structural typology, and regional socioeconomic dynamics. This study focuses on developing a simplified national replacement cost model for residential buildings in Colombia, a country that exemplifies the complexities and unique characteristics among developing nations. Colombia’s diverse seismicity, topography, socioeconomic disparities, and varied climatic conditions present an ideal case for examining how a streamlined approach for cost estimation can be implemented and effectively used. Within the framework of the open National Seismic Risk Model (MNRS), the proposed methodology includes over 50 representative combinations of materials and structural systems obtained from the available exposure models of the country. The model integrates traditional construction costs of common building types with variables reflecting current socioeconomic conditions and regional transportation dynamics. The research highlights the importance of including indirect costs and transportation dynamics for accurate nationwide replacement costs. The regional models, calibrated to reflect local socioeconomic and logistical dynamics, demonstrate a range of fit that varies significantly across regions. This variability highlights the importance of calculating replacement costs using a regional approach rather than assuming a homogeneous national model. The study also shows that reinforced concrete systems, especially moment-resisting frames, are costlier than masonry-based systems. The model updates Colombia’s exposure models in the MNRS, providing a crucial tool for decision-makers in a seismically active country.
Keywords
Introduction
In recent years, Colombia has made significant advances in developing a comprehensive approach to risk assessment and disaster management, focusing on enhancing the resilience of homes and neighborhoods to minimize loss of life and damage to buildings and infrastructures. A critical aspect of this strategy is understanding seismic risk at a national level with sufficient detail to inform decision-makers for disaster risk management across municipal, departmental, and national levels. Estimating the potential impacts of future earthquakes on buildings, infrastructures, and populations is crucial for planning the physical, social, and economic development of regions. A prediction consequence model due to seismic events improves the prioritization, assessment, and reinforcement of critical buildings and infrastructures; in addition, it allows response and recovery planning after an earthquake occurs. Developing such a model requires prior knowledge of four key components: (1) the likely seismicity in the area (seismic hazard model), (2) the assets and population at risk (exposure model), (3) the assets’ probability to exceed a certain damage state due to seismic demand (fragility model), and (4) the expected loss as a function of the seismic intensity measures (vulnerability model). In certain situations, when vulnerability models are unavailable, the damage predicted by fragility models is converted into direct and indirect economic, social, or environmental losses using consequence models (Porter et al., 2002). The integration of all these components results in a comprehensive seismic risk model. Within this context, the Colombian Geological Service (SGC) and the Colombian Association of Engineering Faculties (ACOFI), with the support of the Network of Civil Engineering Programs (REPIC), started a collaboration, joining technical, administrative, and logistical efforts, to develop the open National Seismic Risk Model of Colombia (MNRS) initially with around 80 exposure models compiling an inventory of exposed elements including the following key properties. (1) Location: this is crucial for identifying the assets’ hazard intensities and to geolocate possible damages, that is, for developing resource management plans for emergency response. (2) Vulnerability characteristics: in the case of buildings and infrastructure, it is relevant to know properties such as the construction material and the load-resistant system, among other characteristics of the structural configuration, to classify the assets into construction typologies whose behavior is similar in the face of a certain hazard. This information is useful for assessing direct physical damage. (3) Exposed value: this includes characteristics such as the occupants and replacement cost (RPC), reflecting the importance or quantity of the exposed elements. Highly precise definition of all these properties is often impractical. For example, determining the RPC requires specific details about each construction activity. In a city like Bogotá, a detailed evaluation of 1 million buildings is both impossible and impractical. As an alternative, in the exposure models, approximate calculations are usually implemented using index costs available in the construction market. This approach provides feasible means to estimate the exposed value and vulnerability of a large number of buildings and infrastructure elements but does not consider variables such as demolition or repair costs, transportation of materials, suitability of land, structural typology, and the socioeconomic (SE) dynamics between geographic regions. To bridge the gap between the high-level overview of exposure models and the specific calculation of RPCs, it is important to delve deeper into the methodologies used for estimating the value of assets at risk.
RPC is usually used in seismic risk assessments to quantify the impact of earthquakes on the civil infrastructure (Silva et al., 2015; Yamin et al., 2017) and its estimation is affected by several factors such as the geographical location (Yepes-Estrada et al., 2017), the specific inhabitants’ SE dynamics, and the constructive process of the building (Yamin et al., 2017). Previous studies have used several simplified approaches to estimate the RPC of a large number of assets. For example, Goulet et al. (2007) incorporated the gross square footage of benchmark buildings in Los Angeles to define buildings’ replacement/repair costs for seismic risk assessment. Similarly, Liel and Deierlein (2013) obtained RPCs from a standard database to evaluate mitigation options for older concrete frame buildings in a performance-based cost–benefit assessment. Yamin et al. (2017) used the commercial value as a proxy for the replacement. Crowley et al. (2020) estimated RPCs through a census database obtained from the national statistics departments of several European countries for residential and non-residential buildings. For cases when the national statistics department provided no information for non-residential buildings, the authors employed additional secondary sources, such as SE data sets, energy efficiency studies, websites with European statistics on the matter, or expert judgment. In addition, the authors classified RPCs by urban and rural areas, as well as large cities. However, the authors did not clarify whether indirect construction costs (ICCs) are included in their estimation of RPCs. As noted by Yamin et al. (2017), Hyari et al. (2009), and Becker et al. (2014), ICCs are a fundamental part of a replacement value analysis for a building. Recently, Acevedo et al. (2020) estimated RPCs per square meter for the residential buildings of three major cities in Colombia based on the SE level through the judgment of various local engineers and practitioners. Huyck et al. (2022) used per-square-foot costs from RSMeans (Gordian Group Inc, 2024; ImageCat Inc, 2019) and expert-judgment assumptions to estimate RPCs. Although their approach recurred to varied sources, those relied on general databases and the qualitative nuance judgment of experts to obtain a quantitative model. Yepes-Estrada et al. (2023) developed an average RPC procedure for dwellings at the global level that included both structural and non-structural components, assuming that these are based on the main materials of construction, occupancy class, and region. The values of these last three parameters were estimated from the literature, cost handbooks, and local experts. This procedure was intended to cover a global scope by an average calculation of the built-up areas of constructions. However, this study overgeneralized the estimation of replacement values by reaching only a country scale, thus resulting in models that do not allow the analysis of variabilities between morphologies in regions smaller than a country. Follador et al. (2024) elaborated a simplified cost approach to calculate the construction costs of seismic retrofit interventions in Italian residential unreinforced masonry (UM) buildings among different building subclasses defined according to subtypologies like age, height class, and floor types. These features have applicability only for the construction dynamics of the case study and the system analyzed (i.e. masonry), thus limiting its replicability. The authors used the unit prices of construction items and quantity surveys of building databases to estimate the retrofit costs.
In contrast to the vast amount of research that is available on seismic vulnerability and risk assessment, only a few studies have dealt with RPC models for residential buildings considering SE and morphologic variations at the national level. Also, previous research has used over-simplified approaches without testing the implications of their assumptions and usually does not consider SE dynamics and structural features. Only a few studies have calculated RPCs for different building typologies. Outstandingly, no research in the revised literature on seismic risk assessment has addressed the ICCs within the context of replacement building estimation. As noted in the literature on construction management and quantity surveying, indirect costs are part of quantifying building replacement expenses (Becker et al., 2014; Hyari et al., 2009; Marrero and Ramirez-De-Arellano, 2010). To fill this gap, this article presents the results of a simplified replacement cost (SRC) model applied to a seismic-active country like Colombia. The proposed model aims to provide an accessible and practical tool that leverages available data (i.e. SE databases) and local construction practices to generate reliable cost estimates. By focusing on key factors such as building materials, labor costs, and regional variations, the model seeks to simplify the cost estimation process without compromising accuracy. This research not only contributes to the field of construction economics but also offers valuable insights for enhancing disaster preparedness and housing policy development in Colombia and other similar contexts. Through this case study, this article demonstrates the potential benefits of an SRC model, highlighting its applicability, accuracy, and relevance in the context of developing countries. The evaluation methodology included data collection from real construction developers in the country. Complementarily, a multiple regression analysis with SE variables influencing housing development was developed. The main contributions of this work are as follows. (1) Presenting, for the first time, an RPC model for the MNRS in Colombia. Before this study, the quantification of RPC usually ignored variables such as the specificities of construction typologies, geographical factors, demolition or repair costs, transportation of materials, suitability of land, and regional SE dynamics. (2) Proposing an innovative and comprehensive methodology for RPC quantification under seismic risk; the procedure stages can be easily assessed to obtain conclusive and trustful results. (3) Presenting benchmark values for 1120 municipalities, encompassing over 50 typologies per municipality. (4) Complementing the open MNRS regarding its exposure and vulnerability models. The results of this study are useful for scholars and practitioners involved in seismic risk assessment of Colombia; also, scholars in other regions with similar conditions can adapt and extend the findings of this work. (5) Providing data for decision-makers in public agencies in charge of the risk management of Colombia.
RPC definition
The construction features and the vast scale of information pose challenges to the accuracy of the RPC when attempting to reach a high-detail estimation. For this reason, an SRC model is proposed in this study. At the gross level, the total replacement cost C of a set of buildings sharing the same typology can be calculated as:

where
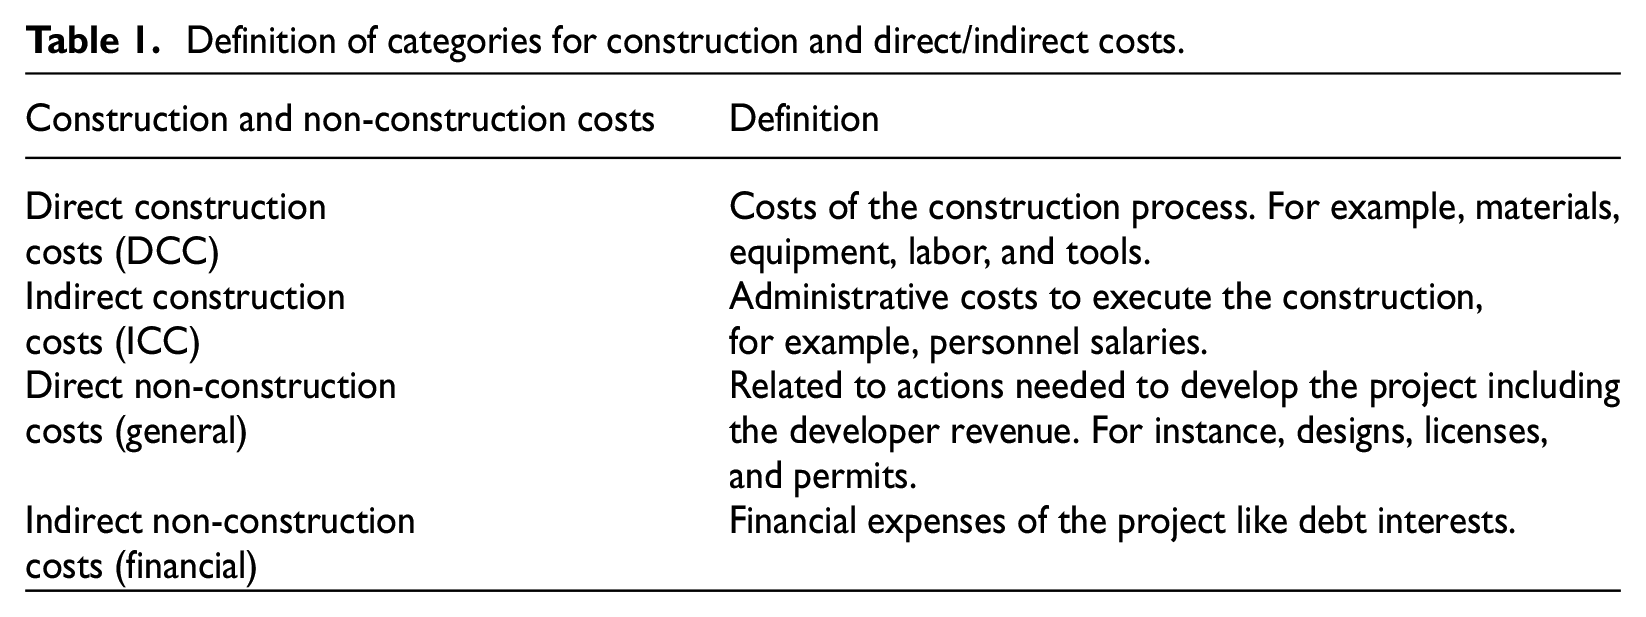
A categorization framework of residential project costs was developed by Becker et al. (2014), encompassing two dimensions, that is, direct/indirect and construction/non-construction costs, thus obtaining four categories. Since the current research is focused on the RPC estimation for residential buildings, the indirect non-construction category is not addressed (i.e. financial and debt expenses that the developer incurs to construct the project). Because the variability of the debt ratio of each developer depends on their financial scheme (Warszawski, 2003), this value cannot be easily generalized as an input of the model. The other three categories obtained from the framework are direct construction cost (DCC), ICC, and direct non-construction cost. The latter refers to the expenses incurred for activities such as design fees, licenses, and permits, which are part of a managerial activity. Given the challenges of estimating non-construction costs, in this study, only DCC and ICC will be considered. Becker et al. (2014) summarized ICCs as expenses incurred by the primary construction company to provide supportive functions and shared general resources necessary for the proper execution of field construction operations. These costs cannot be accurately or feasibly attributed to a single direct cost object, like a specific construction activity, and are not incorporated into the final physical improvements delivered to the owner. With rare exceptions, these expenses are only induced during the construction process at the project site. In most instances, the expense can be assigned to a single construction project, rather than being a common outlay shared across multiple separate construction projects. After analyzing the existent literature, we defined the related cost concepts as presented in Table 1.
Definition of categories for construction and direct/indirect costs.
The corresponding outlays that are used to estimate the RPC are DCC and ICC. The financial expenses are proper to each developer’s capital structure, as explained previously, and cannot be generalized as input of this model. The general expenses depend heavily on the planning process and the location of the project, thus presenting variability to be estimated for the case of each housing project as well as the financial costs. In this sense, this work proposes that the RPC of a building damaged by an earthquake be defined as the cost to construct a new building with the same or a closely similar structural system as the original one prior to the seismic event. The replacement structure must comply with the standards defined in the Colombian seismic-resistant standard (NSR-10), and its RPC must be at least the DCC and ICC incurred by the builder to develop the dwellings. These costs include demolition and debris removal in the event of replacing a collapsed house. Regarding the financial and general costs in construction, the following situations further limit their suitability to be included in the RPC calculation. Usually, the builder needs to finance the construction with a proportion of debt and pay for the land cost. Also, the value incurred in sales and promotion (belonging to general costs) is included in the direct costs since the sales and promotion activities apply in cases where the dwelling needs to be marketed to attract clients. However, in the case of replacing a dwelling through a government contingency program, marketing strategies are unnecessary, as there is no need to compete in the market or attract customers. Furthermore, it is assumed that the builder does not rely on debt financing because a fixed price has already been agreed upon with the government entity responsible for the housing units. As explained before, the cost of land was also excluded from the calculation of the RPC.
Methodology
This study follows a seven-step methodological approach, as illustrated in Figure 1. First, building typologies and key parameters influencing residential cost estimation are identified and defined (step 1). Next, relevant data such as distance between nodes and municipalities and materials transportation costs among other variables are collected (steps 2–4). Following this, a statistical model is developed and calibrated using the gathered data (step 5). Then, RPC projections are generated for different building typologies at the municipality level (step 6). Finally, in step 7, these results are integrated into existing exposure models, which represent the assets at risk (residential buildings for this study). Exposure models are defined based on attributes like location, structure type, and occupancy. It is essential that these attributes are consistent with the vulnerability models, as both models use the same typological definitions to ensure accurate risk assessment.
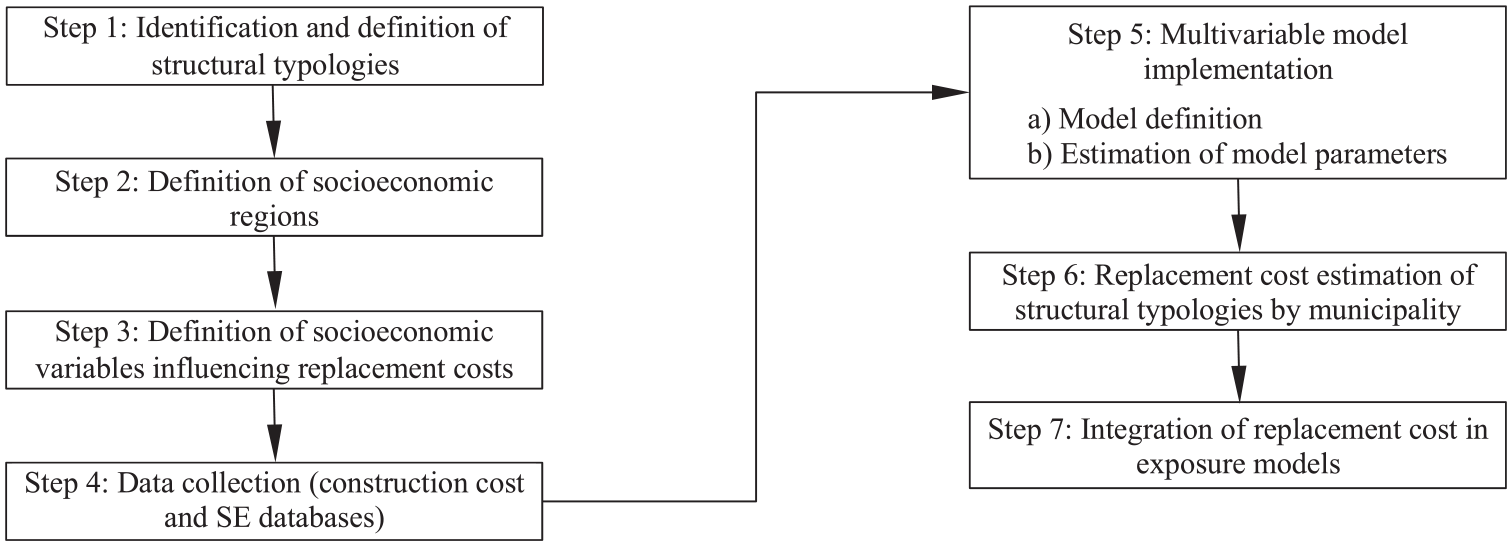
Methodological workflow.
Step 1: identification and definition of building typologies
Building typologies are identified based on a detailed study of construction practices of the country. The research includes both urban and rural areas because, in Colombia, municipalities comprise not only large cities but also small villages that are primarily rural and centered on agricultural activities. In the MNRS, the variables associated with the building typology are material, structural system, number of stories, and system ductility. The structural systems’ composition of this study is only limited to reinforced concrete and masonry because they represent more than 75% of the exposed assets of the country (Valcárcel et al., 2021). The structural systems used in this study are as follows: unreinforced walls (UWs, Figure 2a), reinforced masonry or concrete walls (RWs, Figures 2b and 2d), confined masonry walls (CWs, Figure 2c), moment-resistant frames (MRFs, Figure 2e), and combined systems (CSs, Figure 2f). RWs consist of load-bearing walls made with vertically perforated masonry units with some cells reinforced with steel bars and filled with mortar. CWs are masonry walls enclosed by reinforced concrete elements, such as tie-columns and tie-beams. MRFs are composed of beams and columns designed to withstand both gravitational and seismic lateral loads. Finally, CSs integrate both concrete walls and frames. In this study, the number of stories was grouped as follows: 1 story (S1), 2–3 stories (S2), 4 stories (S3), 5–6 stories (S4), 7–12 stories (S5), and 13 or more stories (S6). The authors determined this classification, based on the correlation between building height and factors like material use, structural typology, and seismic vulnerability. For example, masonry systems are predominant in low-rise buildings (S1–S4), while concrete systems, especially RW and CS, are common in mid- and high-wise structures (S5–S6). Moreover, S1 and S2 generally correspond to individual houses, whereas buildings with four or more stories tend to be apartments. This grouping helps to better capture the relationship between building height and structural behavior defined in the vulnerability models of the MNRS. Regarding ductility, systems may be classified as ductile or non-ductile. For this model, all systems are considered ductile because building replacement is assumed to be conducted using code-conforming structures when the existing construction is non-ductile.
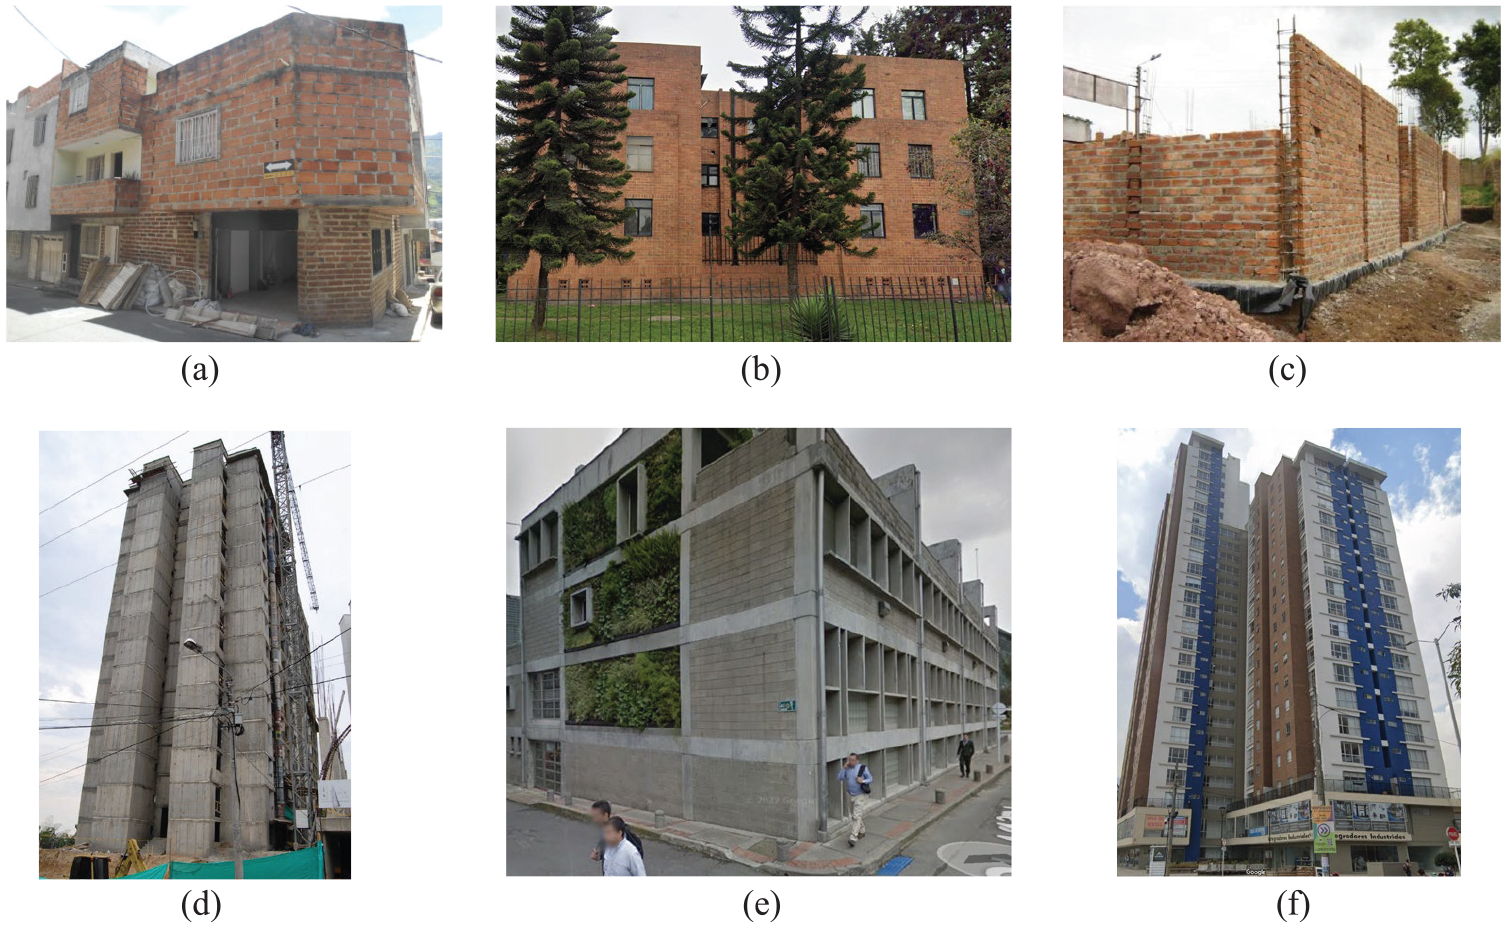
Structural systems: (a) unreinforced walls (UWs), (b) reinforced masonry walls (RWs), (c) confined masonry walls (CWs), (d) reinforced concrete walls (RWs), (e) moment-resistant frames (MRFs), and (f) combined systems (CSs).
Step 2: definition of SE regions
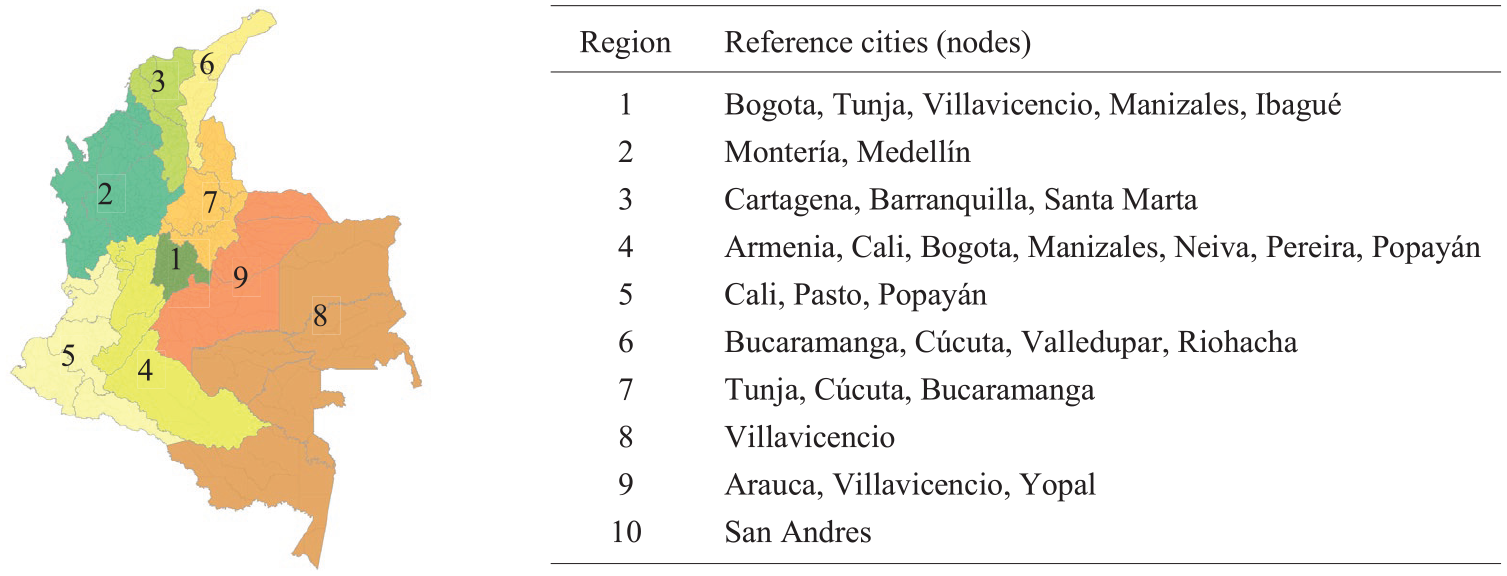
In this study, the SE regions were defined using the criteria that are closely linked to Colombia’s construction industry, focusing on three key factors: geographic features, the condition of transportation infrastructure, and the availability of primary construction materials. Colombia’s diverse geography, which includes mountainous areas, coastal regions, and plains, plays a crucial role in determining construction practices. For instance, mountainous regions face challenges due to rugged terrain and increased seismic risk, while coastal areas contend with issues like flooding and strong winds. The state of transportation infrastructure significantly impacts construction costs and the ease with which materials are transported. Urban centers such as Bogotá and Medellín, with more developed road and transport networks, have better access to both local and imported materials, which enables larger and more complex projects. In contrast, rural or remote areas often experience higher material costs and slower project timelines due to inadequate infrastructure, which limits the kinds of materials and technologies that can be used. The availability of primary materials varies across regions, with some areas being rich in local resources and others depending on materials transported from distant locations, further affecting construction costs and feasibility. By considering the interaction between these factors, the study identifies ten distinct SE regions that reflect the varying construction dynamics and the broader economic development patterns across Colombia (Figure 3). Region 10 is not shown in Figure 3 because it corresponds to San Andres Island in the Caribbean Ocean. Each region has a set of reference cities (nodes). A node is a reference city within a region that serves as a focal point for SE activity and analysis. These nodes are selected based on their SE dynamics and their relevance to the region, even if they are physically located outside the region itself. Nodes are used as central points to represent the SE conditions of the surrounding area and guide the study’s regional analysis. For example, region 3 has the three nodes shown in Figure 4: Barranquilla, Santa Marta, and Cartagena. These cities, or nodes, are not just geographical markers but serve as central hubs of economic, social, and transportation activity. Each city plays a distinct yet interconnected role for understanding regional SE dynamics due to their roles in trade, industry, tourism, and logistics. By serving as nodes in the model, these cities help to accurately represent the complex interplay of factors such as economic activity, transportation dynamics, and construction patterns across the wider region, allowing for a more detailed and accurate assessment of RPCs and regional development. In short, nodes help researchers analyze the SE landscape by providing focal points that encapsulate the region’s key activities and connections.
Defined socioeconomic regions at the national level of Colombia.
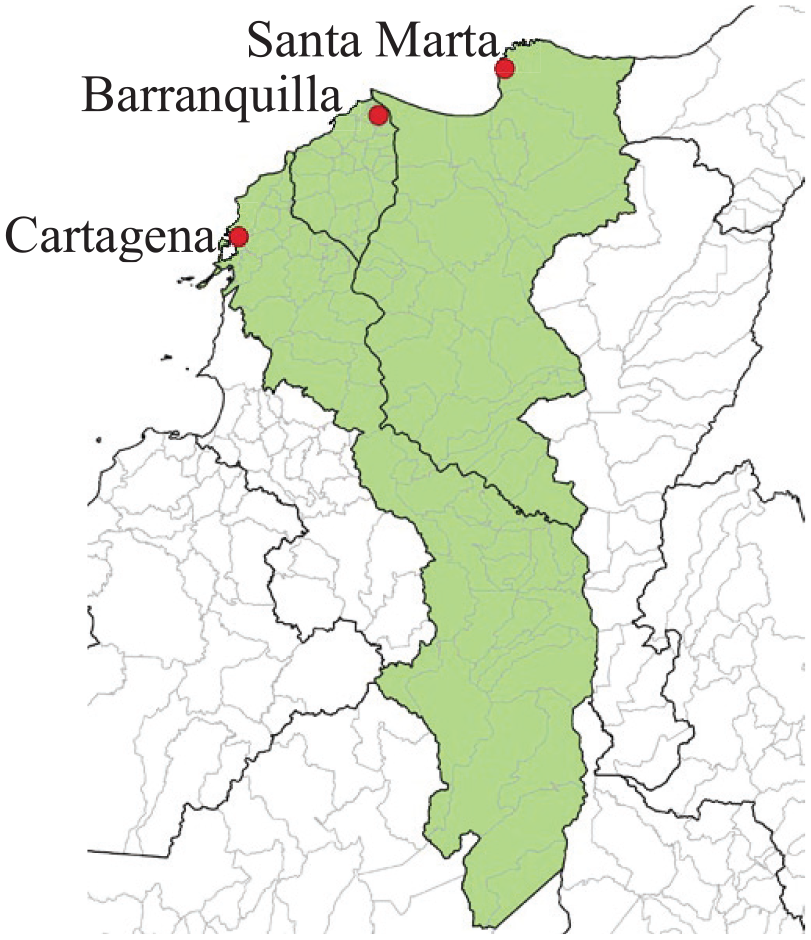
Nodes of region 3.
Geographic disaggregation considers the relationship between the different departments of Colombia in agreement with the National Building Census (CEED) (DANE, 2023a) from the National Administrative Department of Statistics (DANE) in Colombia, which analyzes the most relevant cities in the building construction sector. The data included in these databases pertains to principal metropolitan areas in the country. In this study, we evaluate construction projects in different stages of the life cycle of the building (in process, uncompleted, and finished). The geographic aggregation made by the DANE serves as a guide to determine the regions to be implemented in the model. In Colombia, the DANE has divided SE levels into six categories, ranging from very low (stratum 1) to high (stratum 6). This classification is determined by analyzing the physical characteristics and infrastructure of households, as well as the urban environment in which dwellings are located. The main goal of this stratification is to facilitate a more equitable distribution of public services and provide subsidies to lower-income families. The SE stratum was grouped into four categories: very low (1), low (2–3), middle (4), and high (5–6); these categories are subsequently referred to as SE1, SE2, SE3, and SE4, respectively.
Step 3: definition of SE variables influencing RPCs
Based on the specific objective of the study and the selected SE regions, SE variables are defined considering housing construction dynamics between municipalities in each region to be modeled. For this study, the following variables were defined: (1) DCC of a specific building typology; (2) transportation costs of main construction materials; (3) road distance between municipalities; (4) municipal gross domestic product (GDP) of a selected destination; and (5) GDP of a reference city. Among these variables, the DCC of a specific construction typology is one of the most relevant. The distance between municipalities plays a crucial role in determining material availability and, consequently, influences housing construction costs. In addition, the GDPs of origin and destination reflect the SE dynamics of municipalities within the context of the country’s macroeconomic environment. The inclusion of GDP as an indicator of regional inequalities directly affects housing construction costs in several ways. Higher GDP regions tend to attract more investment in infrastructure, leading to increased land prices and elevated construction costs (Breidenbach and Schaffner, 2025). The demand for construction labor and materials rises in these areas, driving up costs further (Somerville, 1999). Wealthier regions with high GDP often implement stricter regulations, such as environmental and zoning laws, which increase compliance costs for construction firms (Hsieh and Moretti, 2019). In addition, higher GDP leads to increased property values, encouraging developers to focus on high-end housing, which raises material costs as premium finishes and advanced technologies are prioritized (Gyourko and Saiz, 2006). Finally, GDP growth can contribute to inflation, further increasing the costs of construction materials and labor (Wei et al., 2017). These combined factors make housing construction in high-GDP regions more expensive. For this study, GPD values were computed based on data from the year 2023.
Step 4: data collection (construction cost and SE databases)
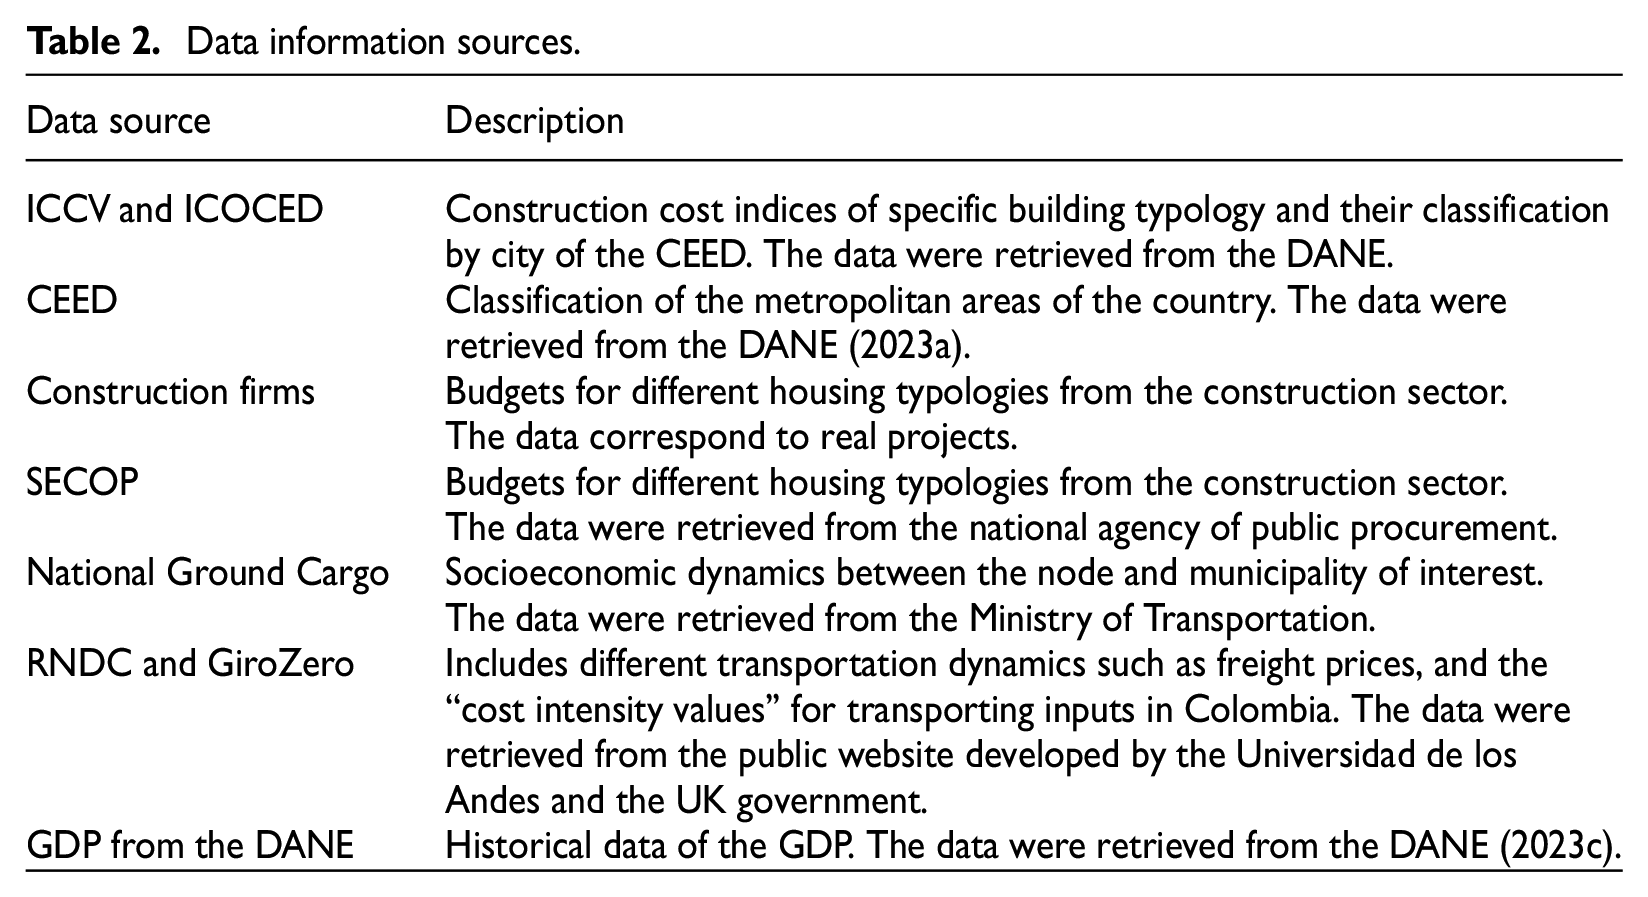
The objective of this step is to obtain input data for the variables defined in step 3. One of the most important variables is the DCC of a specific construction typology. The main sources of information for this variable include data from developers in the construction sector, encompassing budgets from formal construction companies and informal development. In addition, budgets from the public procurement web platform (SECOP) were consulted (Agencia Nacional de contratación pública Colombia, 2021). The study incorporated existing macroeconomic indicators of construction costs from DANE such as the CEED, the Housing Construction Cost Index (ICCV), and the Building Construction Cost Index (ICOCED) (DANE, 2023b), along with data from other sources. This study uses these macroeconomic indexes to project construction costs over time based on prices from previous years. Similarly, these indicators may be used to forecast economic construction values across different cities, providing valuable supplementary data when primary information sources are incomplete. The projections across cities will be used to consolidate the information from the regression model, and their application will be presented later in the results chapter. Using the information available in the MNRS exposure models, it is possible to establish relationships between different typologies of the same structural system. This includes constructions with varying numbers of stories or finishes that share the same structural system. Therefore, this study defines relationship factors for construction value per square meter, considering the story number and SE level. The story number is closely related to the surveyed quantities of work, as it impacts both the foundation and the number and size of structural elements. As the story number increases, the construction cost also tends to rise. However, this increase in floors also results in a larger built area. Therefore, despite the rise in quantities and construction costs, the value per square meter can fluctuate. The SE level of the construction directly impacts both the construction cost and the expenses related to the building’s finishes. For very low and low SE levels, construction is usually in bare shell conditions, waiting for interior finishes. In contrast, for middle and high SE levels, there is a gradual increase in the application and quality of finishes. Due to this disparity, the SE stratum significantly impacts the construction costs for buildings with the same story number, materials, and structural systems. To define the SE dynamics between the node and municipality of interest, the national ground cargo database from the Ministry of Transportation was used. To define freight prices, the “cost intensity values” for transporting inputs in Colombia were used; these data are available in the databases consolidated by the GiroZero initiative (Universidad de los Andes UK; Pact Colombia Cardiff University, 2023) and originate from the National Cargo Dispatch Registry (RNDC) of the Ministry of Transportation. Finally, public information available in the DANE database was used to obtain GDP values. The compiled information of the data sources is presented in Table 2.
Data information sources.
Step 5: multivariable model implementation
The study employs a multivariable regression framework to estimate DCCs for municipalities, accounting for SE factors across municipalities. The model integrates various inputs such as relevant housing construction variables (e.g. SE indicators, building typology, and proximity to material sources) at a national scale, alongside regional construction costs. Data for these inputs are collected from the databases mentioned in step 4. Regional regression models are developed using data primarily from the reference cities, tailored to regional nuances. Subsequently, the robustness of the model is evaluated based on two approaches. The first approach assesses the model fitness through
The first substep of this activity is to define a multivariable model representing the SE dynamics between municipalities in the region based on various variables that influence housing construction development. The prediction model was developed after identifying and defining key variables affecting housing construction (steps 1–3) as well as consolidating data to calibrate the model based on pertinent SE factors in residential construction (step 4). Subsequently, criteria to fine-tune the model according to variable and regional characteristics were established to apply multivariable regression to derive region-specific models. After exploring many alternatives, it was found that a simple linear regression model was adequate to explore causal relationships between the dependent and independent variables. The selected model is linear because it comprises additive terms where each term represents a predictor multiplied by an estimated coefficient with an additional constant term included. The equation used in this study was:

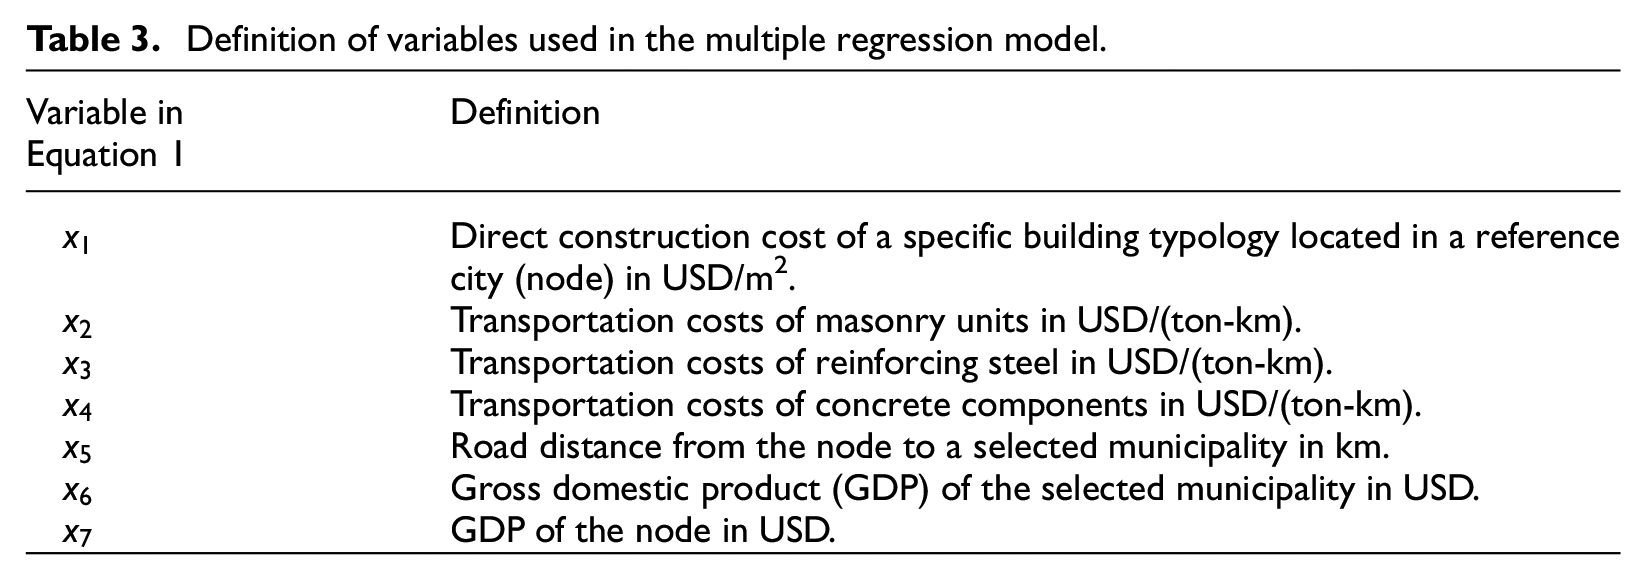
Table 3 presents the definition of each variable of Equation 2. Multivariable linear regression differs from traditional linear regression by incorporating multiple independent variables (denoted as
Definition of variables used in the multiple regression model.
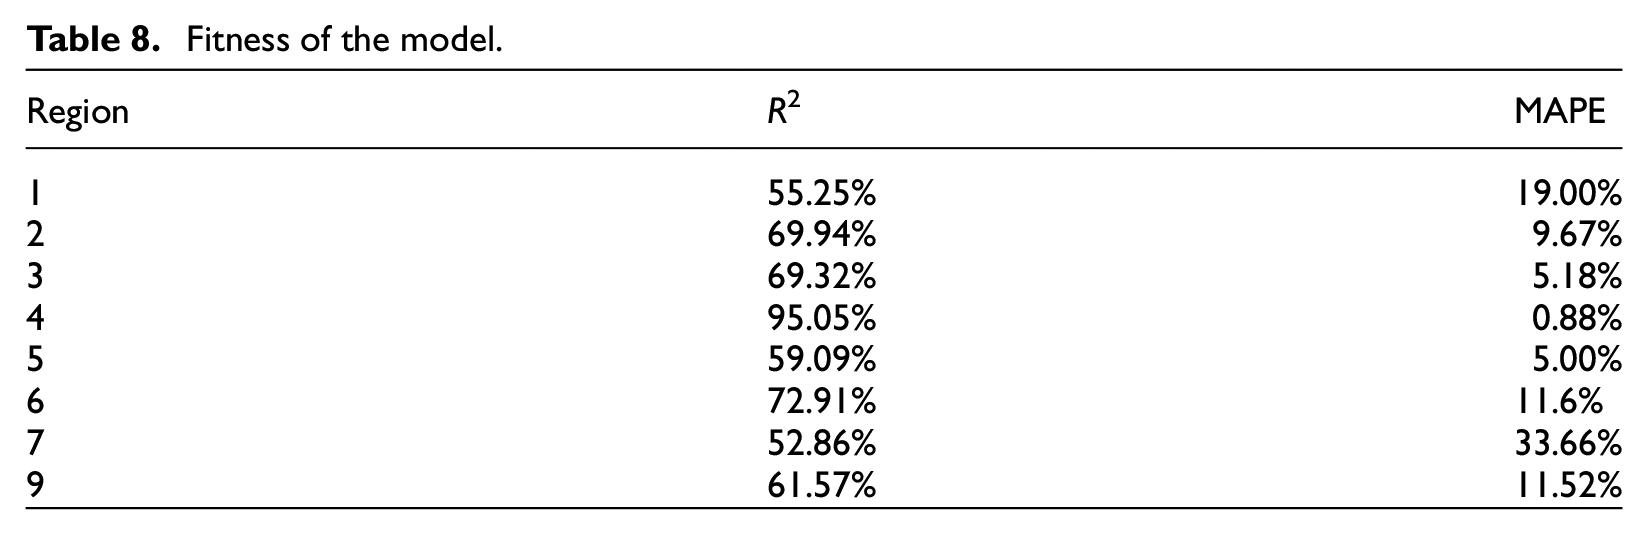
The second substep of this activity is to estimate the model’s coefficients and iteratively adjust parameters to enhance the model’s fit. Collected information was used for the economic assessment of construction cost for each typology as well as data on the relationship between SE dynamics that influence housing construction development in the municipalities of Colombia. Data on building activity from construction developers is used as input for the nodes of the multivariable model. This information is reliable for predicting the selected destinations in the model, compensating for the lack of data on construction dynamics in other municipalities. It enables direct calculation of RPCs across all municipalities in the country. This substep is conducted using the following iterative process. (1) Estimate the coefficients of the model and forecast DCC for the selected destination using a multivariable regression model. The selected destination must have enough DCC data. (2) Evaluate the model fitness using
As explained before, the fitness of the model was evaluated using two metrics: the
In this equation,
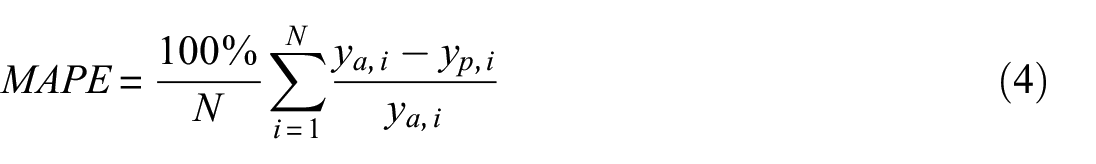
In Equation 4,
To illustrate the application of this step, we selected region 3 of Figure 2 as an example. For this region, construction costs are obtained for different typologies from construction companies, public contracting, and direct information collected for informal masonry dwellings for the nodes (Barranquilla, Santa Marta, and Cartagena). With this information, it is possible to consolidate the distribution of the construction costs for the existing typologies in the main cities of this region. Subsequently, the missing typologies are complemented to consolidate a database that will be used in the calibration of the multivariate regression model. To fill in gaps for missing typologies, we projected data based on existing construction activity in the country, factoring in the number of building stories, SE levels, and the SE dynamics between major cities. In the first model of region 3, an adjusted
Step 6: RPC estimation
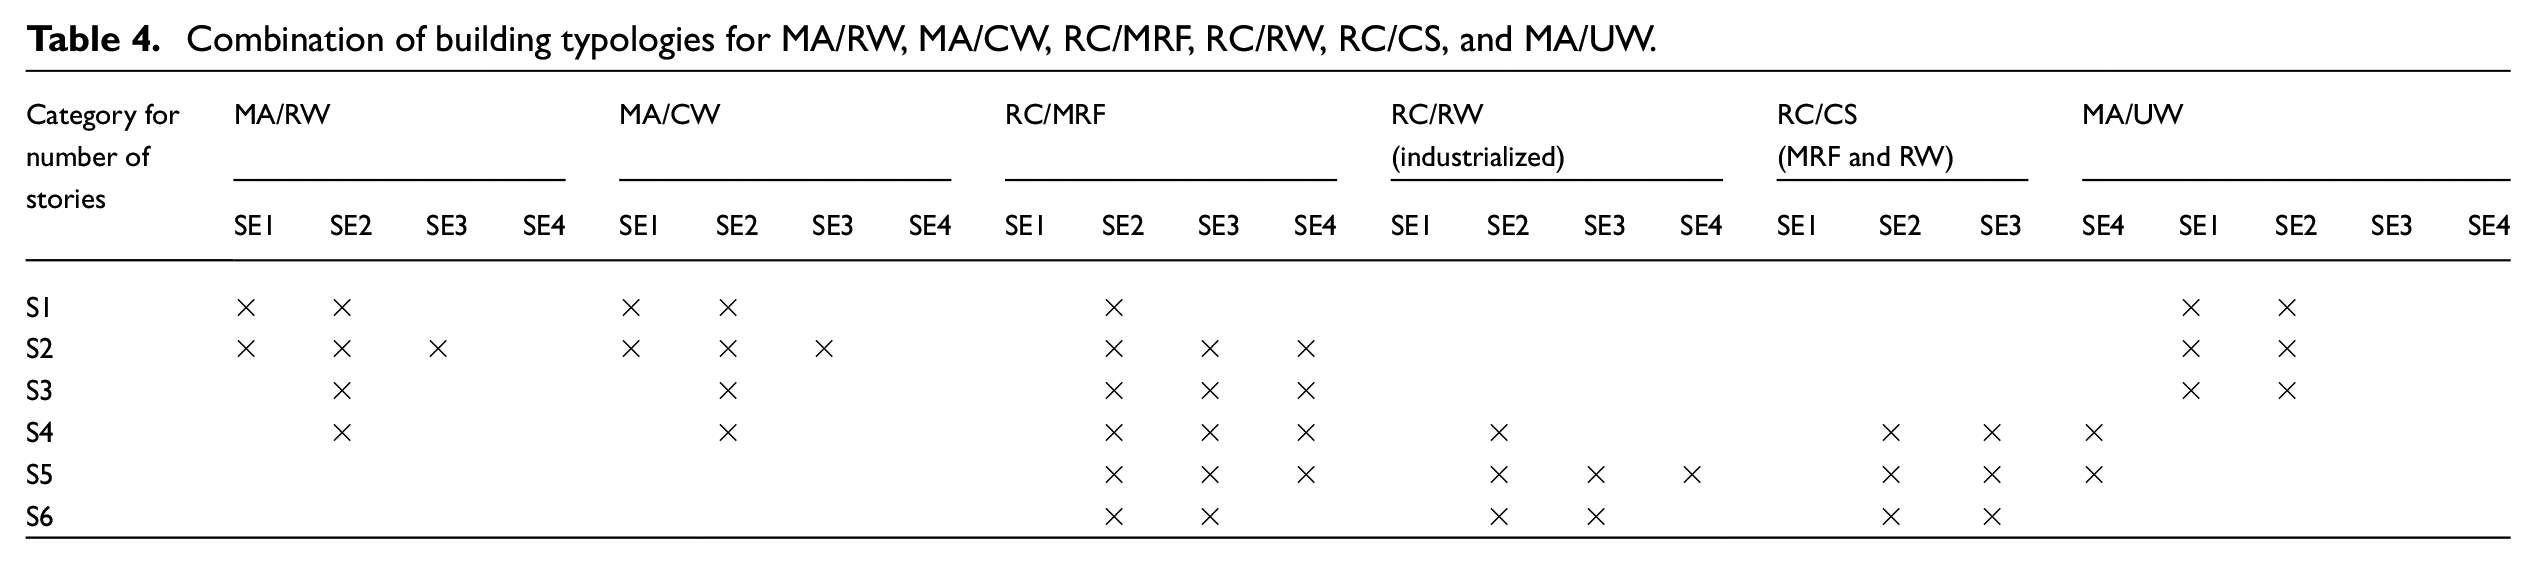
This activity aims to estimate the cost of recovering a structure with similar characteristics after it has been damaged or replaced after collapsing. The replaced structure must comply with the regulatory standards of the country’s structural code. This study quantifies various factors influencing the housing construction sector in Colombia, notably SE conditions and materials transportation dynamics, which impact both workforce availability and material supply. The estimation process considers the different structural systems identified in step 1. Note that UM, prevalent in informal construction, does not conform to Colombia’s national seismic code. Because this system must be replaced using a structural system permitted by the building code, we chose reinforced or confined masonry systems. The typologies of the model comprise a combination of four fields aligned to the predominant constructive practices identified in the country: (1) material (masonry, MA or reinforced concrete, RC); (2) structural system (reinforced walls, RWs; confined walls, CWs; moment-resistant frames, MRFs; combined systems, CSs; and unreinforced walls, UWs); (3) story number category (S1: 1 story, S2: 2–3 stories, S3: 4 stories, S4: 5–6 stories, S5: 7–12 stories, and S6: 13 or more stories); and (4) SE level (SE1: stratum 1, SE2: strata 2–3, SE3: stratum 4, and SE4: strata 5–6). Not all combinations of parameters were studied. Instead, combinations shown in Table 4 were selected to ensure that the analysis reflected the most typical and relevant cases for each material and structural system. This approach allowed us to focus on the combinations most likely to influence construction costs and risk assessment, considering factors such as local building practices and SE conditions.
Combination of building typologies for MA/RW, MA/CW, RC/MRF, RC/RW, RC/CS, and MA/UW.
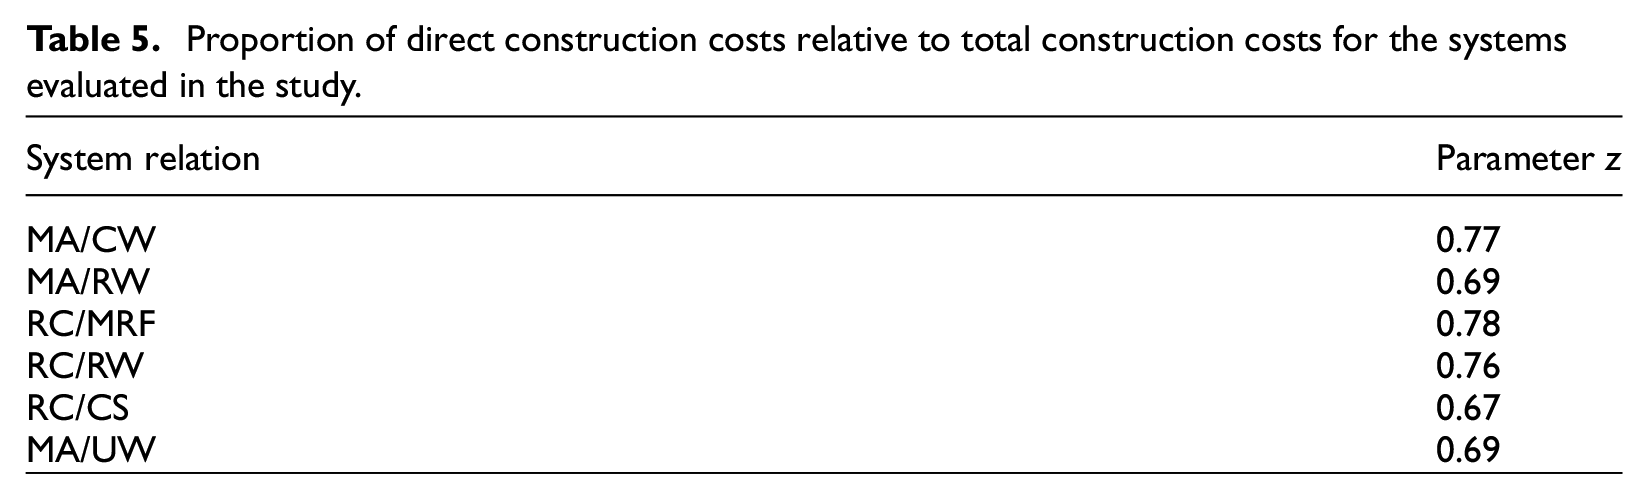
For estimating indirect costs, current construction engineering and management methodologies rely on subjective, experience-based approaches, as well as quantitative methods, such as artificial intelligence, building information modeling (BIM), and predictive analytics. The traditional approach, that is, subjective methods, is outlined in the code of estimating practice (CIOB, 2018). The fundamental concept of this document is that each indirect cost item consists of risk contingencies, overheads related to time expenses, rental fees and salaries, and/or fixed costs like installation and dismantling charges. The principles established in the CIOB code have been incorporated into textbooks on construction estimation theories and practices (Tah et al., 1994). Subjectivity is commonly used in the field. For instance, in Hong Kong, Chan and Pasquire (2004) found that 57% of the major contractors had their project indirect cost items estimated based on subjective assessments made by senior managers. While quantitative methods that utilize statistics and probability are recommended, they are infrequently implemented in practice. Their complexity necessitates a more structured approach, often leading to their neglect (Tah et al., 1994). Machine learning provides a quantitative method using statistical, analogical, and analytical models. These techniques require vast data sets and are being increasingly investigated for their potential to enhance the accuracy of cost predictions (Tayefeh Hashemi et al., 2020). Artificial neural networks (ANNs) are employed to forecast indirect costs by examining the factors that affect them. This method requires a substantial amount of data and can yield accurate estimates when enough information is accessible (Leśniak, 2013). BIM-based methods combine cost estimation with design processes, enabling semi-automated and precise cost predictions. This approach minimizes dependence on manual inputs and experienced estimators, improving both accuracy and efficiency; nonetheless, the model needs a significant volume of data (Fazeli et al., 2021). Predictive analytics, such as case-based reasoning and system dynamics models, are utilized for cost estimation in the early stages of a project. These methods require historical data and simulations to enhance estimation accuracy, particularly when comprehensive project information is scarce (Liu and Luo, 2025). However, the primary challenges identified for predictive models stand for the requirement of additional data, the limitations to generalizing models to account for location and various project types, and the enhancement of attribute weighting (Castro Miranda et al., 2022). Our proposed estimation approach has an intermediate level of precision exceeding that of the popular subjective methods but requiring less effort and data than fully quantitative approaches. The proposed approach uses the intuitive concept of estimating indirect costs as a function of other available costs, as done by Hyari et al. (2009), Yamin et al. (2017), and Valcárcel et al. (2021). The proposed model outperforms by simplicity and precision with a limited amount of data when compared to methods such as statistical-based, ANNs, BIM-based, and predictive models (Liu and Luo, 2025). Based on the disaggregation of construction costs, the RPC concept is a representation of the data retrieved from the sources of this study and the multivariable model (i.e. construction cost composed of DCC and ICC as explained in Table 1). In this case, rather than relying on housing commercial values like done by Yamin et al. (2017) and Valcárcel et al. (2021), our approach estimates RPC using construction cost in the housing sector of the country. Estimating RPCs based on commercial values can be inaccurate due to market fluctuations, which affect property values but do not account for actual rebuilding costs. Commercial values often reflect factors like location, profitability, or demand, while RPCs focus on current prices for materials, labor, and compliance with building codes. To avoid these inconveniences, we decided to include indirect costs in the RPC calculation through the use of a factor

where
Proportion of direct construction costs relative to total construction costs for the systems evaluated in the study.
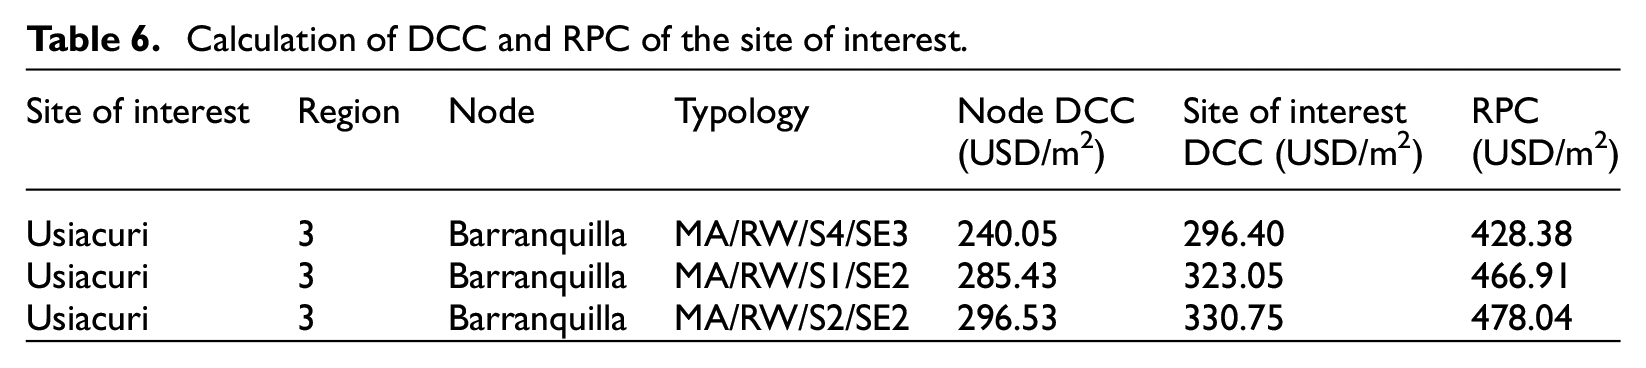
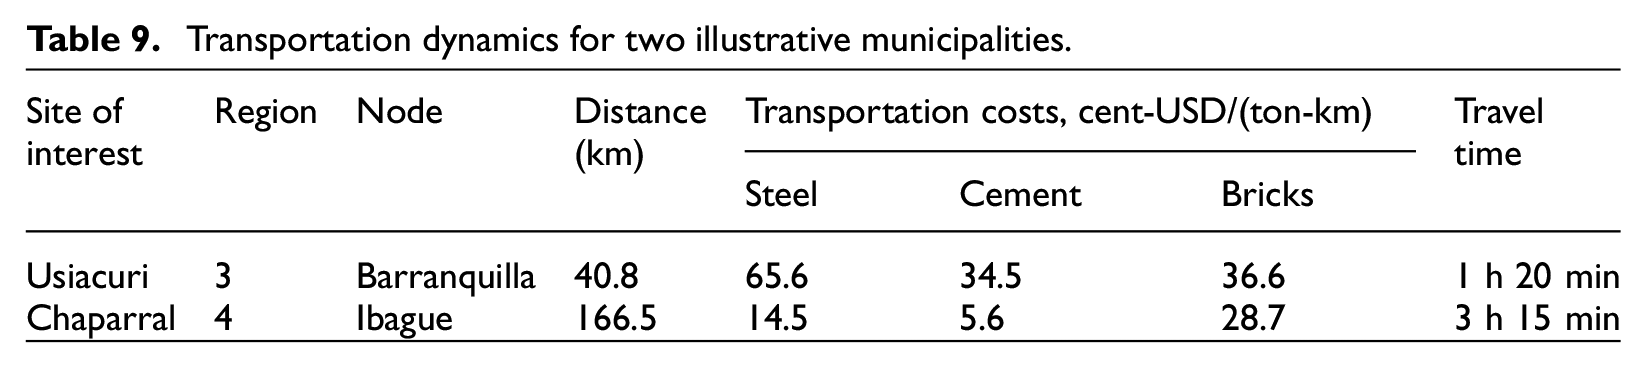
Using the multivariable model explained in the previous section, the RPC of the sites of interest was calculated based on the nodes’ data. To illustrate this process, we selected a municipality located in Region 3 as an example. This region has three nodes: Cartagena, Barranquilla, and Santa Marta. The selected site of interest was Usiacuri (a municipality of 9490 inhabitants and 103 km2 of area), and the reference city was Barranquilla (the capital city of the Atlántico Department). The distance between the municipalities is 40.8 km. Once the model was calibrated for region 3, it was used to estimate the DCC of Usiacuri. Table 6 contains the input parameters of the model and the results for the site of interest. For currency conversion purposes, in this study, an exchange rate (TRM) of $3900 COP per USD was used.
Calculation of DCC and RPC of the site of interest.
Step 7: integration of RPC in existing exposure models
One of the objectives of this study is to integrate the RPCs calculated for each municipality into the exposure models developed for the MNRS. Exposure models are developed based on key attributes such as location, structural type, occupancy, and other relevant characteristics that define the buildings’ physical and functional aspects. It is crucial that these attributes align with those used in the vulnerability and cost models, as these models rely on consistent typological definitions to ensure the accuracy and reliability of the overall risk assessment. By maintaining this consistency, the integration of these models allows for a more precise evaluation of potential risks, enabling better-informed decision-making in areas such as risk mitigation, insurance, and urban planning. In this cost model, the combinations of materials, structural systems, and building heights presented in Table 4 were derived from the most representative typology classes of the exposure models. Replacement values are directly assigned to the previously defined typologies based on characteristics such as structural system, story number, and SE level. However, for typologies not explicitly defined within the data set, equivalence factors are used to estimate their replacement values. These equivalence factors were established through expert judgment, leveraging the experience of professionals who assessed similarities between building typologies, structural designs, and SE levels. By drawing parallels between less common typologies and their more well-documented counterparts, experts were able to assign replacement values that conservatively reflect realistic cost estimates. In this way, it is possible to update the costs of all exposed elements included in the MNRS.
Results
The following chapter outlines the steps for developing the construction cost model for each SE region defined for the study. For each region, specific details are clarified following the defined methodological development for the multivariable regression model to obtain projected DCC and RPC values.
Regression coefficients
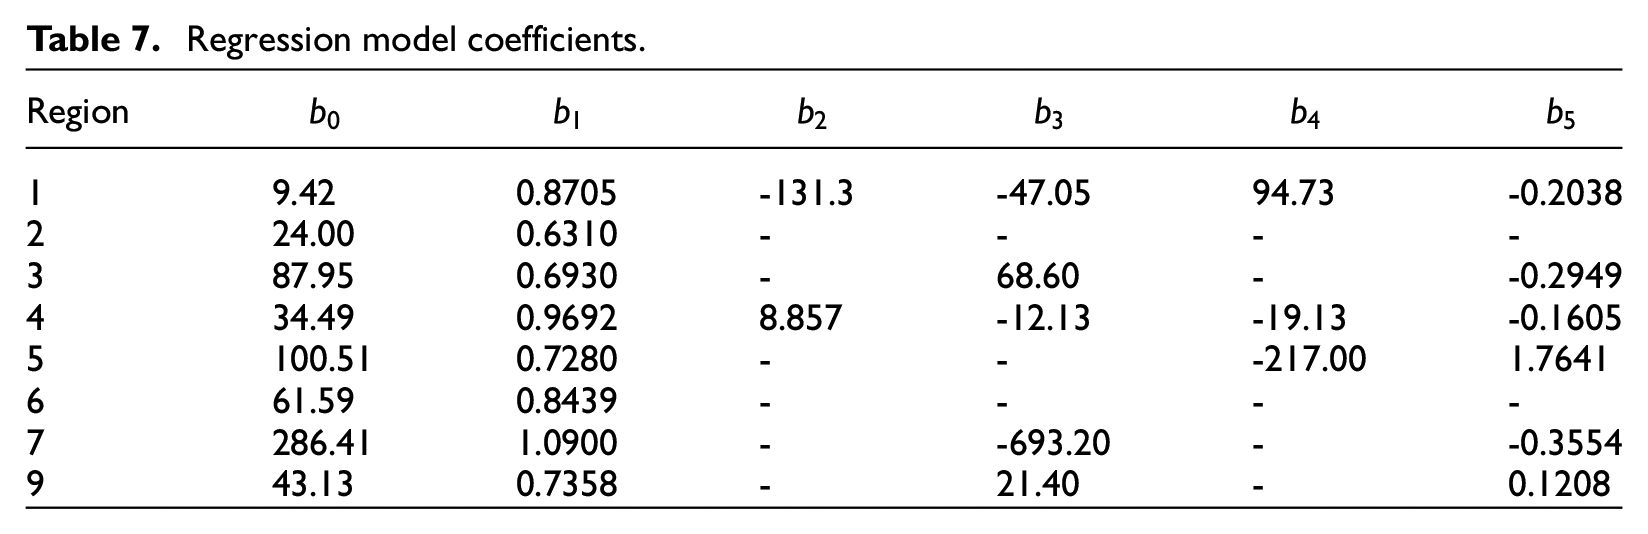
Table 7 presents the regression coefficients for the regions analyzed to calculate the construction cost in USD. Note that region 10 is not included because it corresponds to the country’s insular region where the regression is not applicable. For this region, construction costs are obtained directly from the available information. Coefficients
Regression model coefficients.
Fitness of the model.
The developed methodology permits to analyze the influence of the input variables in the RPC calculation, elucidating the effect of SE factors on the development of the residential building activity. To illustrate this feature, two municipalities (Usiacuri and Chaparral) located in different regions are used. Usiacuri has 9543 inhabitants and is in region 3, a coastal area with predominately flat terrain. The main economic hub that provides services to this municipality is Barranquilla, the fourth most important city in the country. Conversely, Chaparral is in region 4 on the Andes mountains and has 47,293 inhabitants. Its SE dynamics are influenced by Ibague, the capital of the Tolima Department, which is a middle-sized city in the country. When comparing the transportation dynamics between these two municipalities, road distance emerges as a key variable influencing material transportation cost, particularly the cost of transporting steel over distance. As indicated in Table 9, Usiacuri faces higher transportation costs despite being closer to its supply node, while Chaparral, although farther from its supplier, incurs lower transportation costs. Both transportation routes include concession roads, which generally offer higher service levels compared to government-maintained roads. More than half of the Ibague–Chaparral corridor has better roads, reducing freight costs and increasing average speed compared to the Barranquilla–Usiacuri corridor. This highlights the significant impact that road conditions have on RPC, where an external factor (e.g. road quality) can explain an internal component (e.g. transportation costs of construction materials) within the model. Even though the distance between the node and cities of interest is a variable common for both models, it varies in its influence on each model. This situation reflects the features of the supply chain and its connections (i.e. roads or other transportation modes) between the economic centers. When the road presents more inefficiencies (i.e. larger travel times for the same distance), the freight increases. Travel times are affected by road conditions and traffic levels, while freight costs may also be influenced by tolls along the route. The road from Barranquilla to Usiacuri has lower toll costs per vehicle category than the road from Ibague to Chaparral. However, the higher tolls on the latter route do not lead to increased freight costs that would raise RPC. These differences reflect the unique regional SE dynamics, as represented by transportation and the distances between economic nodes and construction sites, which in turn affect workforce availability and material supply for housing construction.
Transportation dynamics for two illustrative municipalities.
RPC estimation by region
The RPC estimates gathered in this research for the 1120 municipalities of Colombia, encompassing over 50 typologies per municipality, are available in an Excel file accessible as Supplementary Material. The workbook contains ten sheets, one for each region. Within each sheet, there are nine columns: municipality, DIVIPOLA 1 code, department, region, typology, base DCC, forecasted DCC, COP RPC, and USD RPC (TRM $3900 COP/USD). Figure 5 presents the RPC in US dollars per square meter (USD/ m2) for the most common typologies identified in the exposure model of the country: masonry (MA) and reinforced concrete (RC) dwellings located in SE levels 1 (stratum 1) and 2 (stratum 2–3). Note that more than half of the population in Colombia is classified in these two SE categories. The taxonomy follows the notation defined previously: material/structural system/number of stories/SE level. Since the results presented in Figure 5 are limited to low SE levels, the RPCs per square meter are significantly lower compared to residential costs in other economies, such as those reported by Yepes-Estrada et al. (2023) and Follador et al. (2024). Regarding the height of structures, the predominant typologies tend to have lower RPCs compared to buildings with six or more stories. This reduces the potential impact on the public budget for replacing damaged buildings. When examining the geographic regions in Figure 5, unreinforced (MA/UW) and reinforced (MA/RW) masonry typologies are notably less expensive in the central region, which is the most populated and includes three of the four most industrialized cities in the country. This indicates that the housing construction market and its processes are more mature in industrialized areas (Zhu et al., 2018). In addition, the development of the construction sector in densely populated regions fosters an economy-of-scale effect (Ahmad et al., 2019). Furthermore, the well-connected transportation network in the central region reduces transportation costs, which in turn lowers material costs (Ambrosino et al., 2019). Reducing construction costs can lead to increased housing supply and encourage higher housing production by enhancing the financial feasibility of projects (Kedir and Hall, 2021; Somerville, 1999). A well-developed housing market, supported by strong regulatory frameworks, consistent demand, and efficient supply chains, can streamline processes and reduce uncertainties, ultimately lowering costs and encouraging housing development (Gyourko and Saiz, 2006). In line with this, adopting industrialized construction techniques like prefabrication and modularization can improve efficiency, minimize waste, and decrease costs, resulting in a boost in housing production (Pan et al., 2008). Therefore, to reduce the vulnerability of the national system, efforts should focus on promoting incentives for industrializing construction processes in the housing sector. This approach is likely to lower construction costs, ultimately leading to reduced public expenditure in the event of a seismic collapse. The relationship between lower construction costs, market maturity, and industrialized construction is complex. While market maturity may improve access to basic materials, it doesn’t necessarily extend to advanced, industrialized systems. In regions with poor transportation infrastructure, the benefits of industrialized approaches, such as offsite construction, are often negated by high logistics costs. This indicates that adopting advanced construction methods depends not only on market maturity but also on improving transportation and logistics, which significantly impact overall costs.
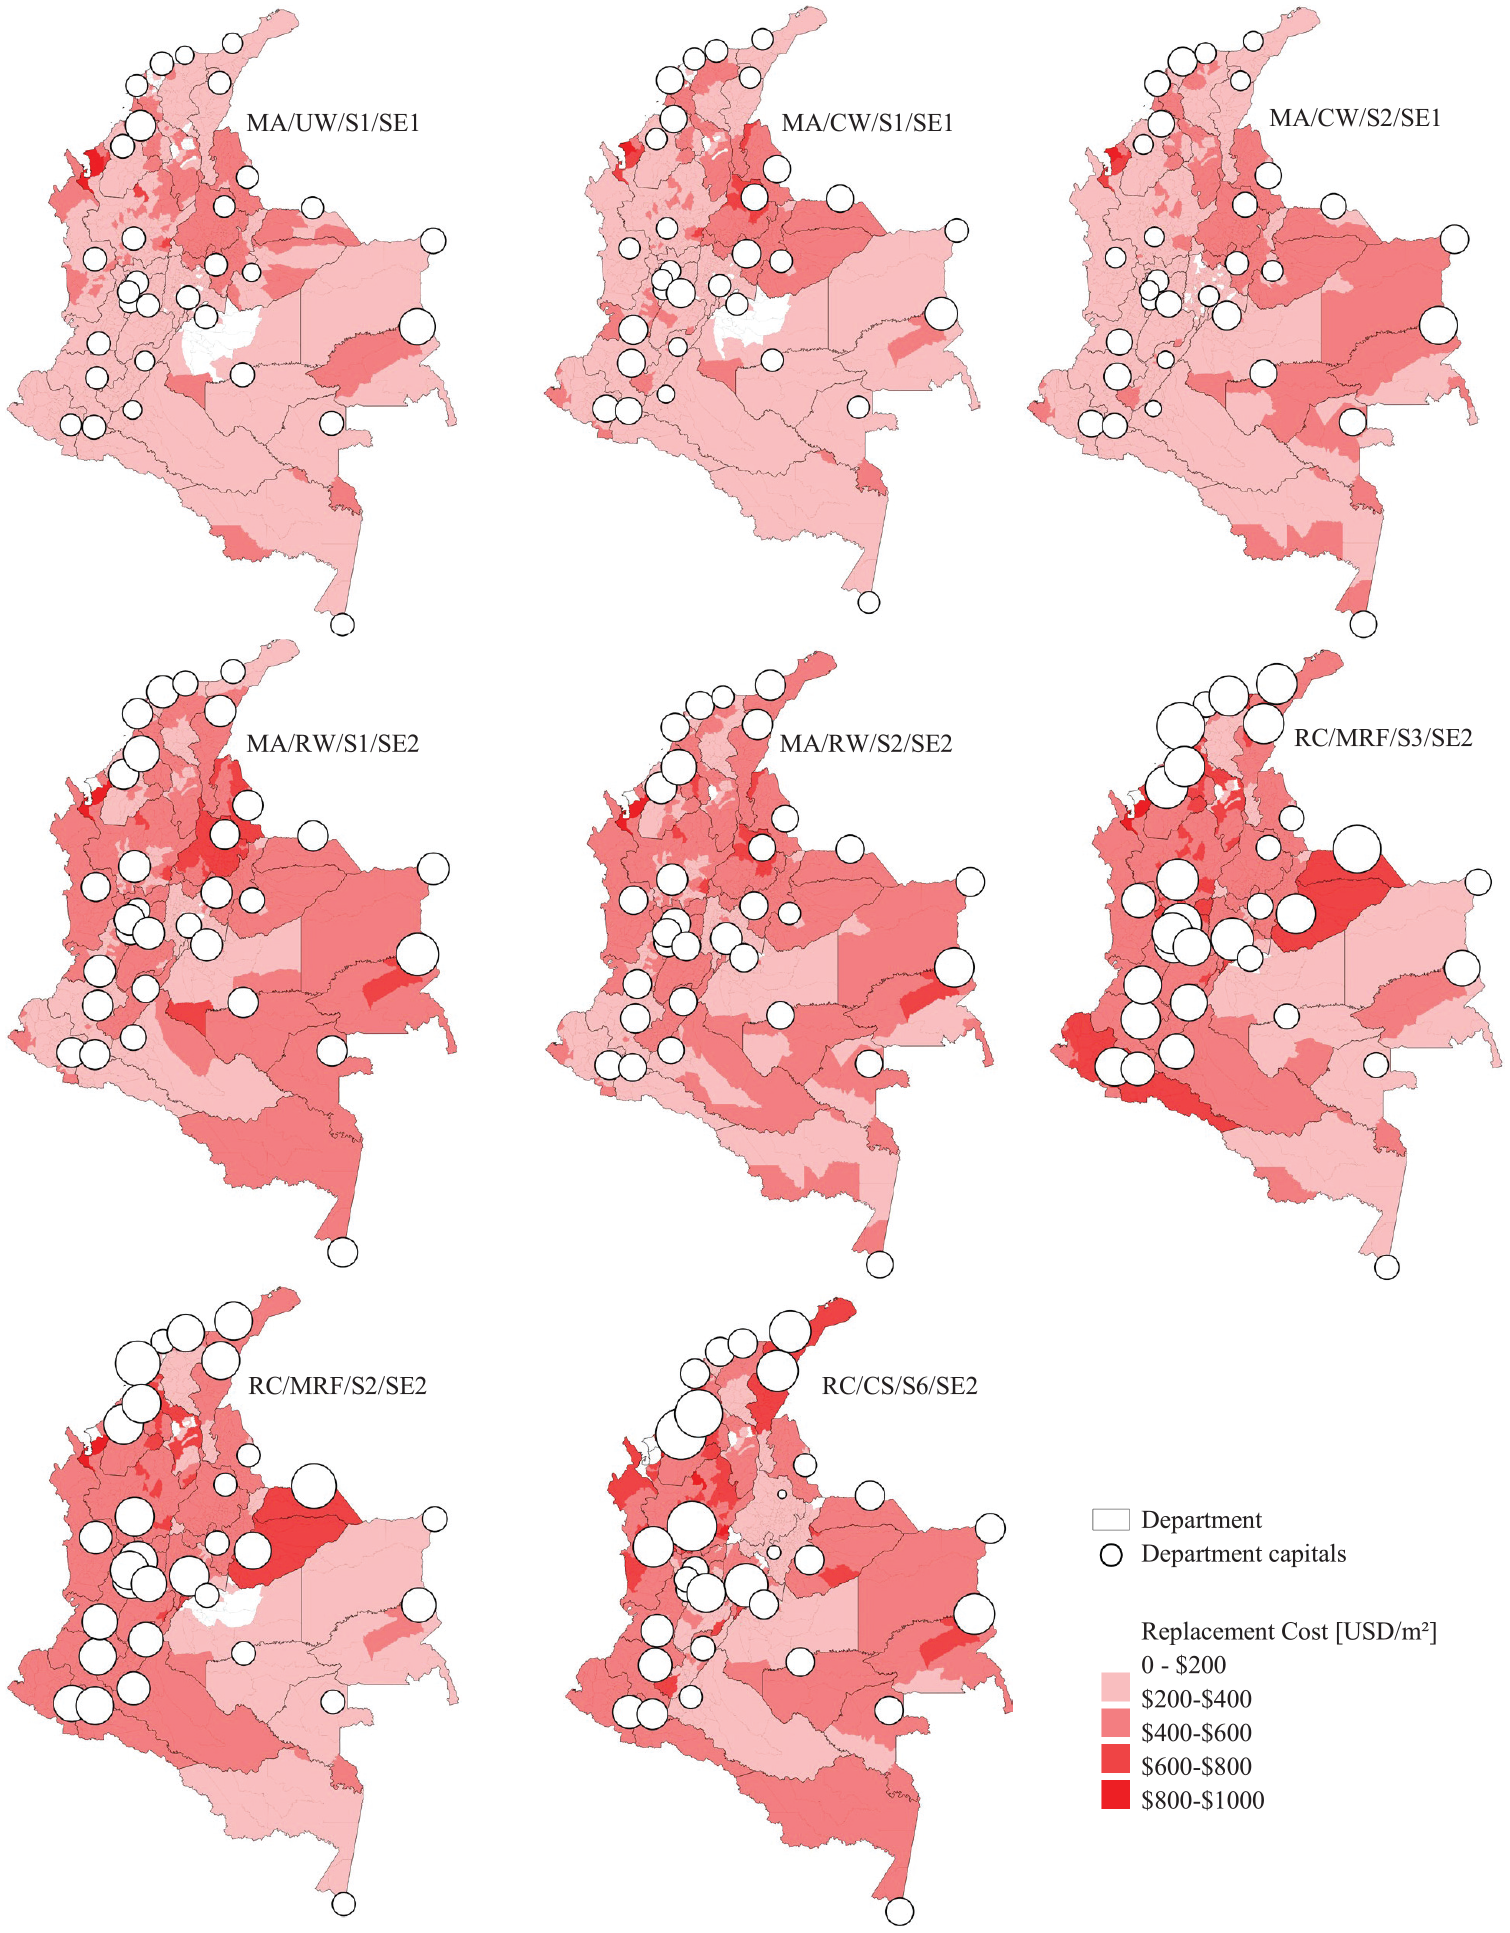
Replacement costs for most common typologies. The dot size is proportional to the replacement cost.
Figure 6 shows the RPC estimations for the 1120 municipalities of the country in ascending order classified by typology. It is evident that dispersions of the RPC values for the typologies included in this figure are similar. Also note that the masonry-based systems (MA) present the lower costs, especially for low SE levels (SE1). Typologies based on reinforced concrete (RC) in SE2 are the most expensive segment of the comparison. Although reinforced concrete (RC) combined systems typically have 13 or more stories, they tend to have a lower RPC compared to reinforced concrete moment-resisting frames (MRF) with fewer than 5 stories. Interestingly, the results suggest that the economy of scale may play a role in reducing the RPC of taller buildings when compared to shorter buildings made of the same material.
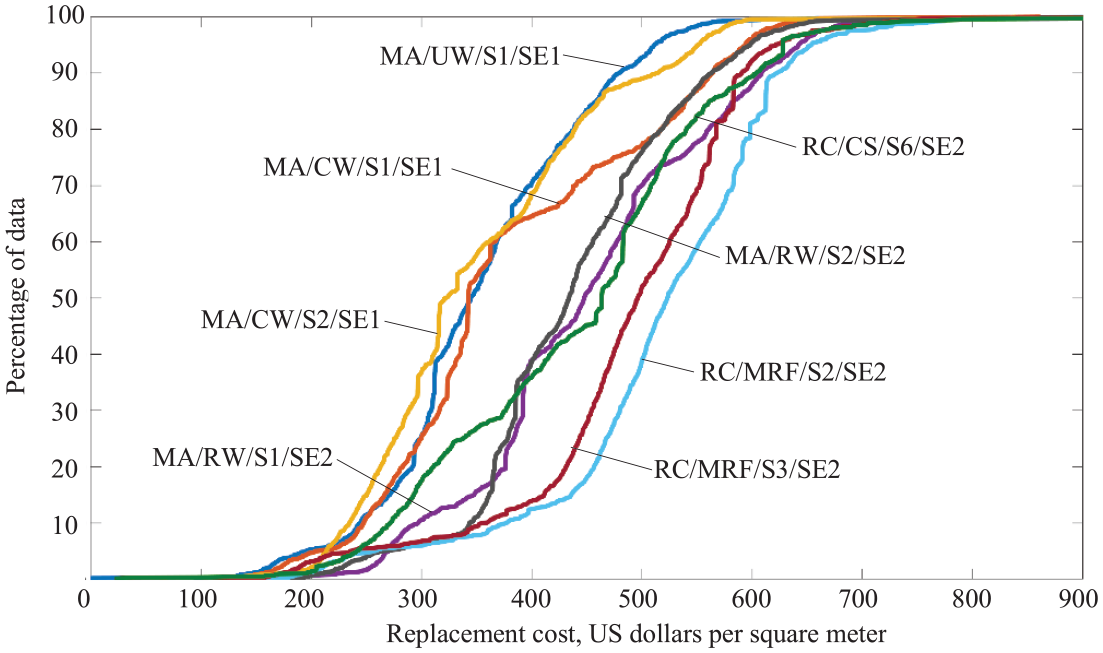
Replacement cost’s cumulative distribution for most common typologies.
RPC analysis in the main SE centers
Figure 7 illustrates the RPC behavior across different building typologies in the capital cities of each department of the country. Among these, the most expensive typology is the reinforced concrete moment-resisting frame (RC/MRF) system. The other typologies, which are based on masonry such as confined (MA/CW) and reinforced (MA/RW) masonry, are more affordable in every SE region analyzed. These typologies are also the most common for dwellings in the country. The analysis highlights that masonry-based construction is more suitable for addressing the demand for single-family dwellings with one to three stories, making it ideal for less densely populated areas. Therefore, public policymakers should focus on optimizing urban jurisdictions to provide the most affordable housing systems, especially in urbanizing areas. In other words, local settlement density should be considered when planning, as this can help reduce RPCs for the state in the event of seismic damage. In low-density cities, masonry typologies can adequately meet demand while minimizing costs. In addition, it’s important to note that the RPC of unreinforced masonry (MA/UW) is higher than that of confined masonry (MA/CW). Despite MA/UW being a more informal construction method, its replacement value must meet a minimum standard (e.g. reinforced masonry—MA/RW). This gap between actual value and its minimum replacement value reflects a higher level of exposure to seismic risk in Colombia. As such, policy efforts should focus on regulating masonry construction to at least the CW level, as it represents the lowest RPC among structural systems in the country. For example, laws to control informal construction practices and increase local jurisdiction oversight could help mitigate the impact of UW on the country’s exposure to seismic risk for residential buildings.
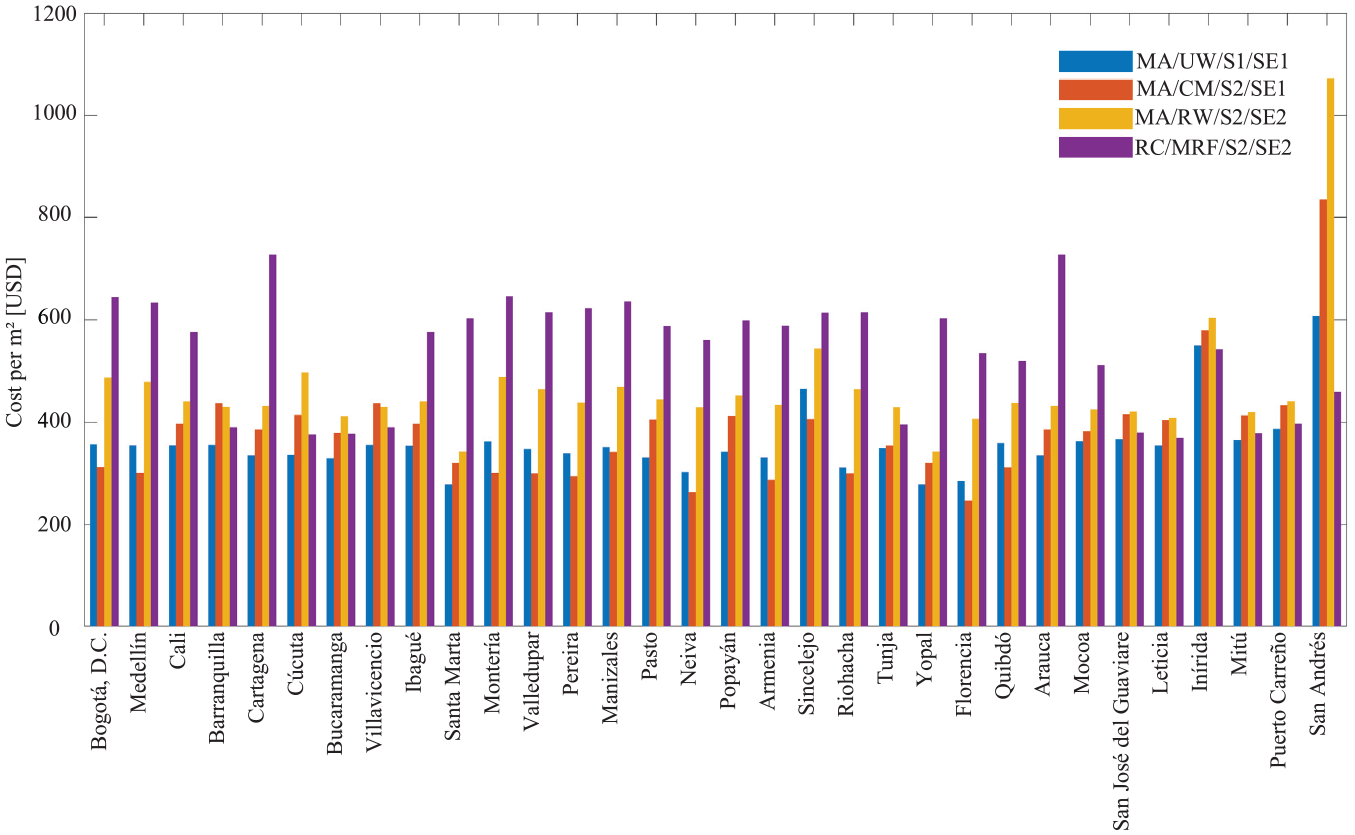
Replacement cost comparison between department capitals for relevant typologies.
RPC analysis by exposure level
The integration of the SRC model into the MNRS marks a significant step forward in assessing seismic risk in Colombia. By updating the costs of all exposed elements within the MNRS, this study offers a thorough analysis of RPCs for residential buildings across various SE regions. The methodology, which involves gathering construction cost data from multiple sources and employing multivariable regression models to project values and cost ratios, provides a practical and consistent approach to estimating RPCs. This integration enhances the understanding of the economic impact of potential seismic events on the housing stock, particularly in areas with high concentrations of low-income housing. The findings reveal that the most common building typologies in the vulnerability model have the highest exposure but the lowest RPC per square meter. This situation underscores the need for targeted policy interventions to mitigate the potential impact of seismic activity on vulnerable populations. The focus on high-vulnerability regions offers valuable insights for regional development strategies, emphasizing the promotion of more affordable masonry systems. These systems benefit from the maturity of the housing construction market, economies of scale, and the efficiency of transportation networks. Furthermore, the analysis of RPCs in major SE centers reveals disparities between different structural systems and their implications for public spending on housing reconstruction after seismic events. Consequently, this study recommends promoting industrialized construction processes and regulating masonry construction to at least the confined masonry (MA/CW) level. These steps provide policymakers with actionable measures to reduce the country’s seismic risk exposure and strengthen the resilience of Colombia’s housing sector.
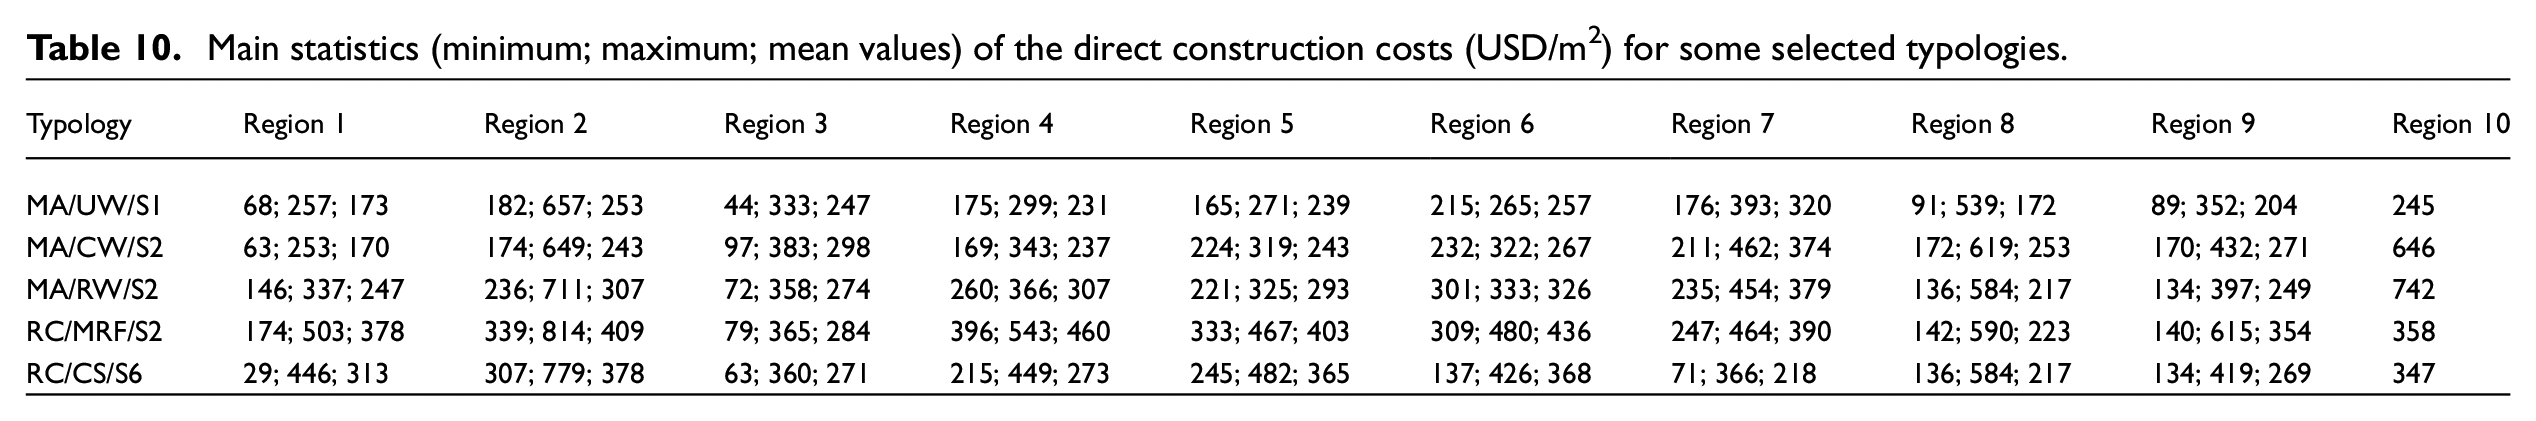
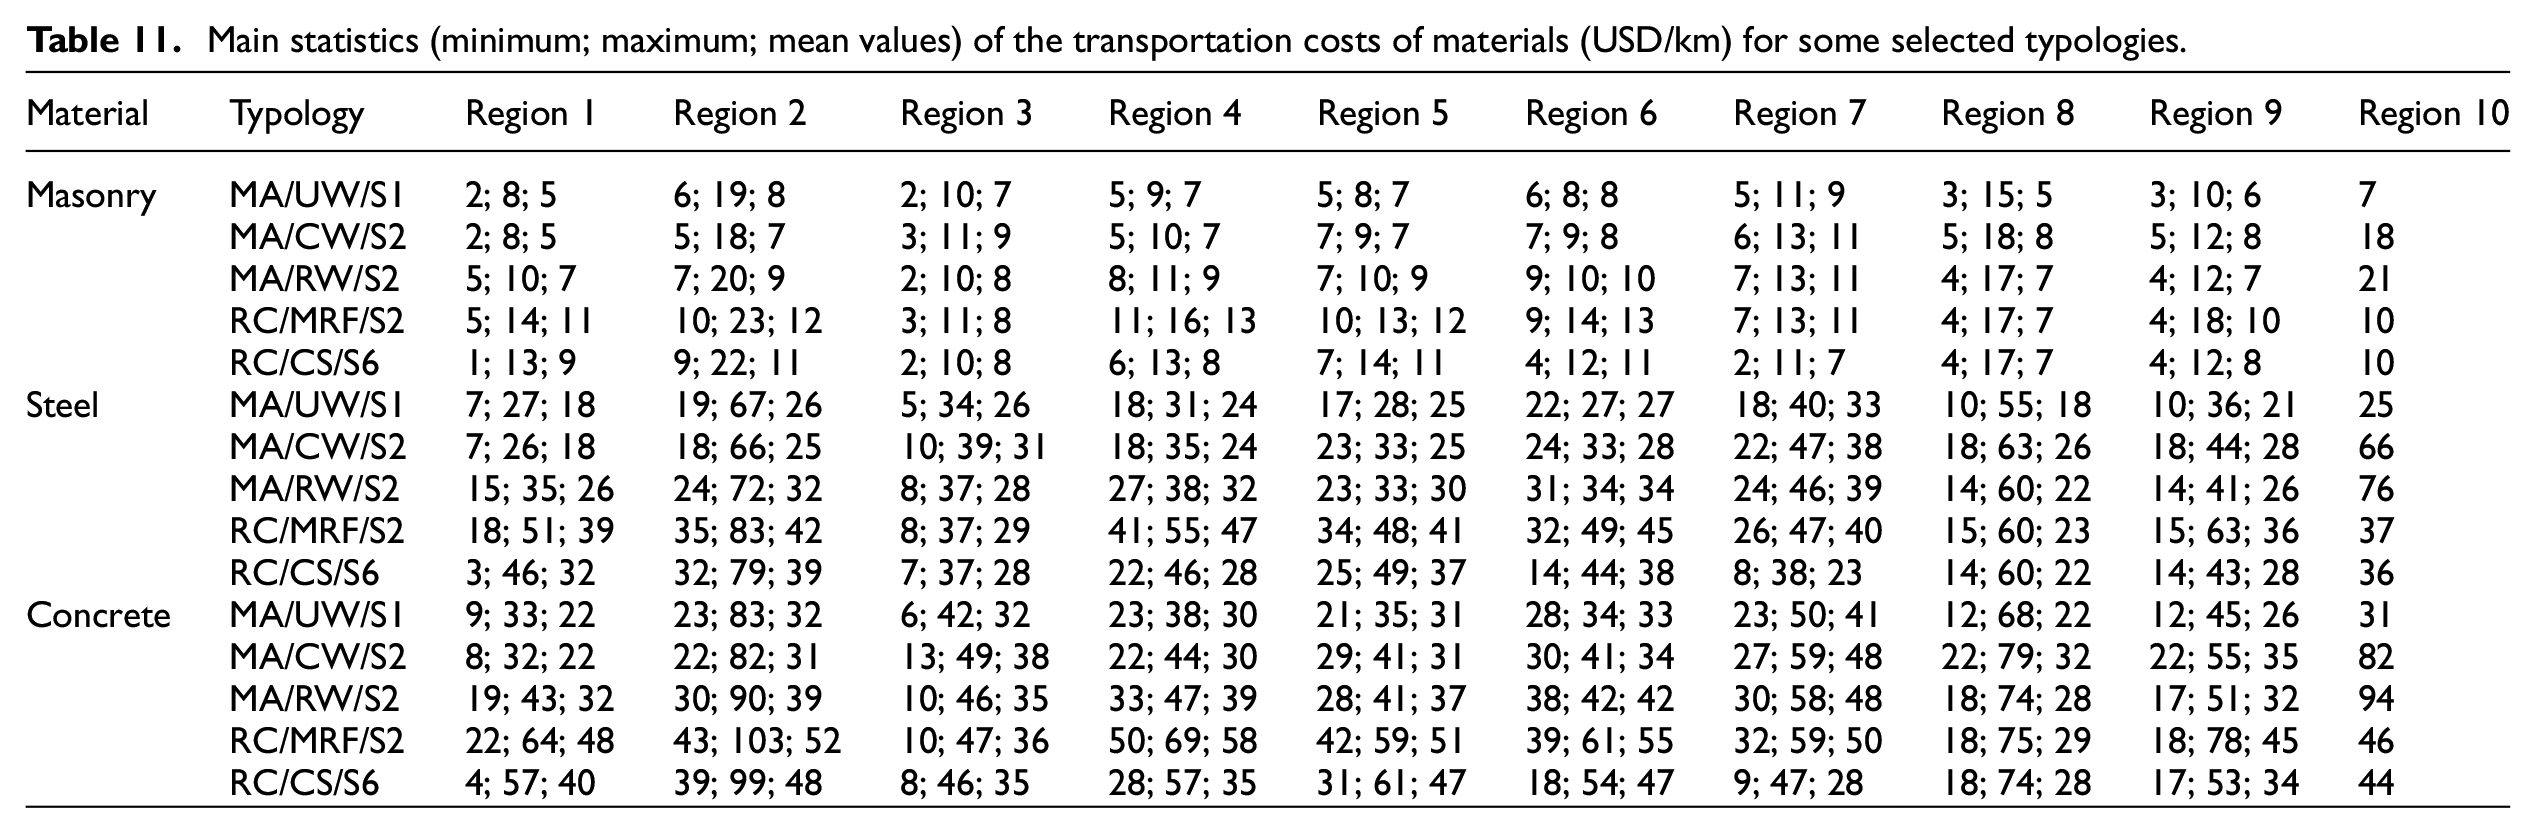
Table 10 presents the minimum, maximum, and average values of the DCCs in USD per square meter for some selected typologies: MA/UW/S1, MA/CW/S2, MA/RW/S2, RC/MRF/S2, and RC/CS/S6. It is clear that reinforced concrete structures generally tend to have higher maximum costs than masonry structures. The table also highlights significant variations in construction costs across regions. For instance, the maximum values in region 2 are notably higher than those in region 1. This difference reflects the contrasting SE dynamics between the two regions. Region 1 has five interconnected nodes (Bogota, Tunja, Villavicencio, Manizales, and Ibagué) that support a well-developed SE network, while region 2 has only two nodes (Medellin and Monteria) serving isolated areas with significant economic disparities. To further explore the model results, Table 11 presents statistics on transportation costs by material type (masonry, steel, concrete) for the same selected typologies. Significant differences in transportation costs are observed between regions, such as the high costs in region 2 compared to region 1. In region 2, the nodes do not encompass most municipalities, leading to substantial variations in transportation costs within the region. This contrasts with region 1, where a more interconnected network helps stabilize transportation expenses. When analyzed by material, it is evident that masonry structures (MA typologies) have the lowest transportation costs, which explains their widespread popularity across the country, particularly in areas where affordability is a key factor. In contrast, steel and concrete structures show significantly higher mean and maximum transportation costs. These elevated costs are often seen in regions with higher economic capacity, where more advanced infrastructure and resources make it feasible to use such materials. In addition, regions with stricter seismic regulations tend to favor steel and reinforced concrete. This trend highlights the relationship between economic factors, regulatory requirements, and material choices in different regions of the country.
Main statistics (minimum; maximum; mean values) of the direct construction costs (USD/m2) for some selected typologies.
Main statistics (minimum; maximum; mean values) of the transportation costs of materials (USD/km) for some selected typologies.
In Colombia, the seismogenic sources identified for the National Seismic Hazard Model (Rivera et al., 2020) include crustal activity, intraplate and interplate subduction in the Pacific, and the Bucaramanga seismic nest. The distribution of seismicity in different regions may be represented by rock peak ground accelerations (PGAs) for a 975-year return period (Figure 8a). In terms of population distribution (Figure 8b), the country’s municipalities can be classified as follows: special cities (more than 700,000 inhabitants), intermediate cities (between 700,000 and 160,000 inhabitants), type I cities (between 160,000 and 50,000 inhabitants), and type II cities (between 50,000 and 20,000 inhabitants), in addition to small and rural municipalities. This classification indicates that most of the population (Figure 9a) and building stock (Figure 9b) are located in areas of moderate to high seismic hazard. In these regions, structural design requires greater use of materials to meet ductility requirements compared to low seismic zones. Regarding seismic hazard, high areas of high PGA (e.g. near fault lines) show higher RPCs, supporting the correlation between seismic risk and construction cost.
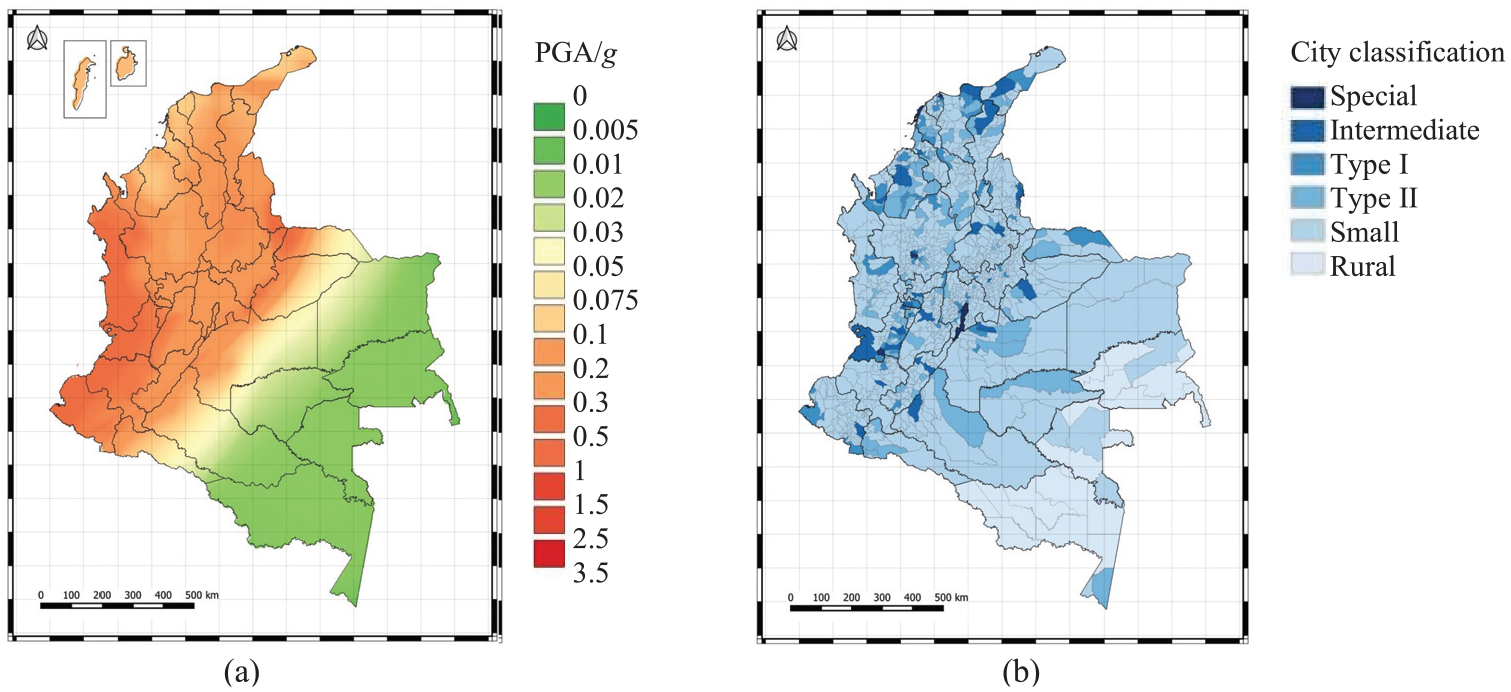
(a) Peak ground accelerations normalized by g (9.81 m/s2) for a return period of 975 years. (b) Classification of cities by population.
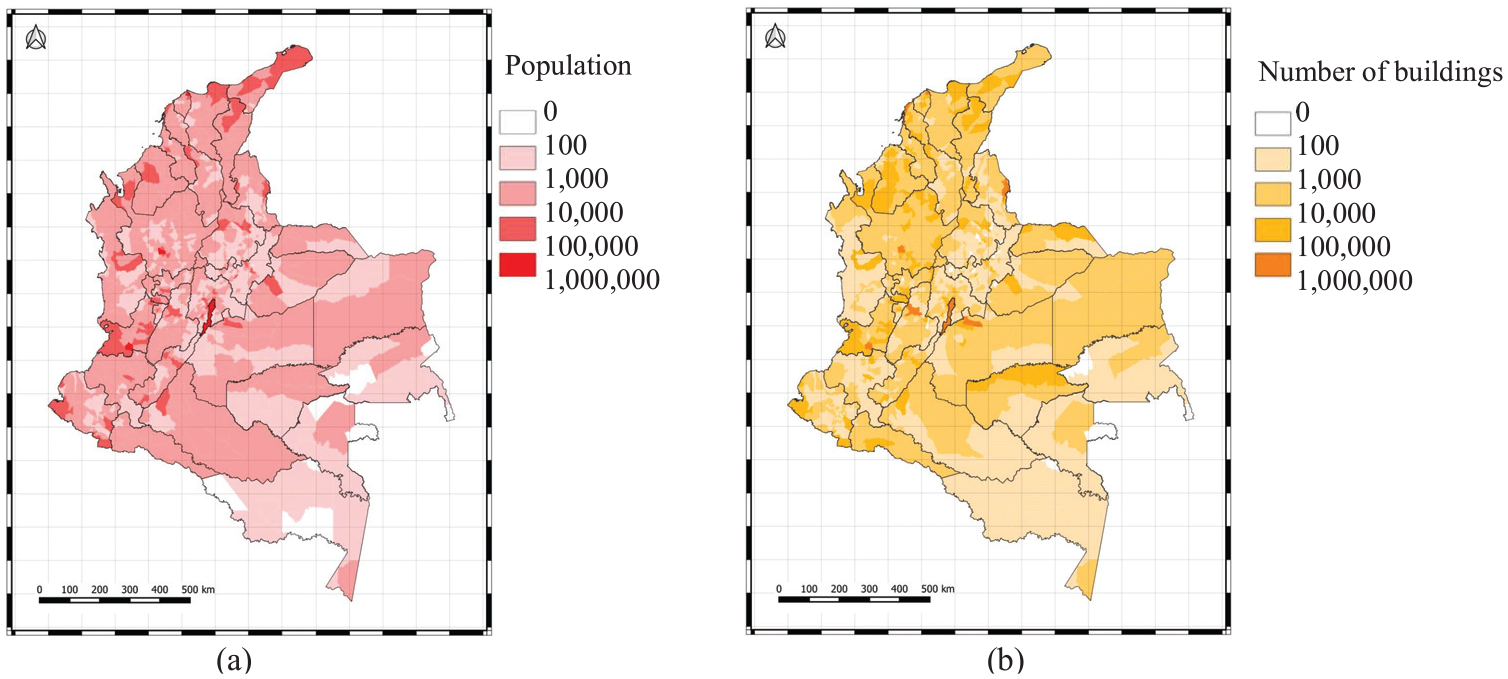
(a) Municipality population map. (b) Municipality building stock map.
Comparison with previous studies
The results of this study are compared with the RPCs provided within the initial exposure models of the MNRS (Valcárcel et al., 2021) derived mainly from modified commercial values. Figure 10 shows a comparison between this research and the results of Valcárcel et al. (2021). The replacement values of Bogotá, D.C., the capital of the country, and the surrounding municipalities show similarities between both studies. Overall, the RPCs estimated by the current research are in the same order of magnitude as those provided in the reference study, likely due to the relative uniformity of building typologies across the country. However, in certain cases, such as Valledupar, Inírida, and Riohacha, the replacement values calculated in this study are notably higher than those reported by Valcárcel et al. (2021). These discrepancies may be explained by the fact that the reference study employed varying methodologies for different municipalities and did not use consistent data sources across regions, leading to significant differences in the results. Also, in more remote municipalities where technical information is lacking, and commercial prices are usually low, this study considers a broader data set, indirect costs, and the transportation dynamics of various construction materials. In general, the RPCs for masonry systems reported by Valcárcel et al. (2021) are consistently lower than those estimated in this study. This discrepancy arises because the reference study uses the costs of existing informal constructions as a proxy for RPCs, whereas this study assumes that dwellings are reconstructed using code-conforming structures, leading to higher estimated costs.
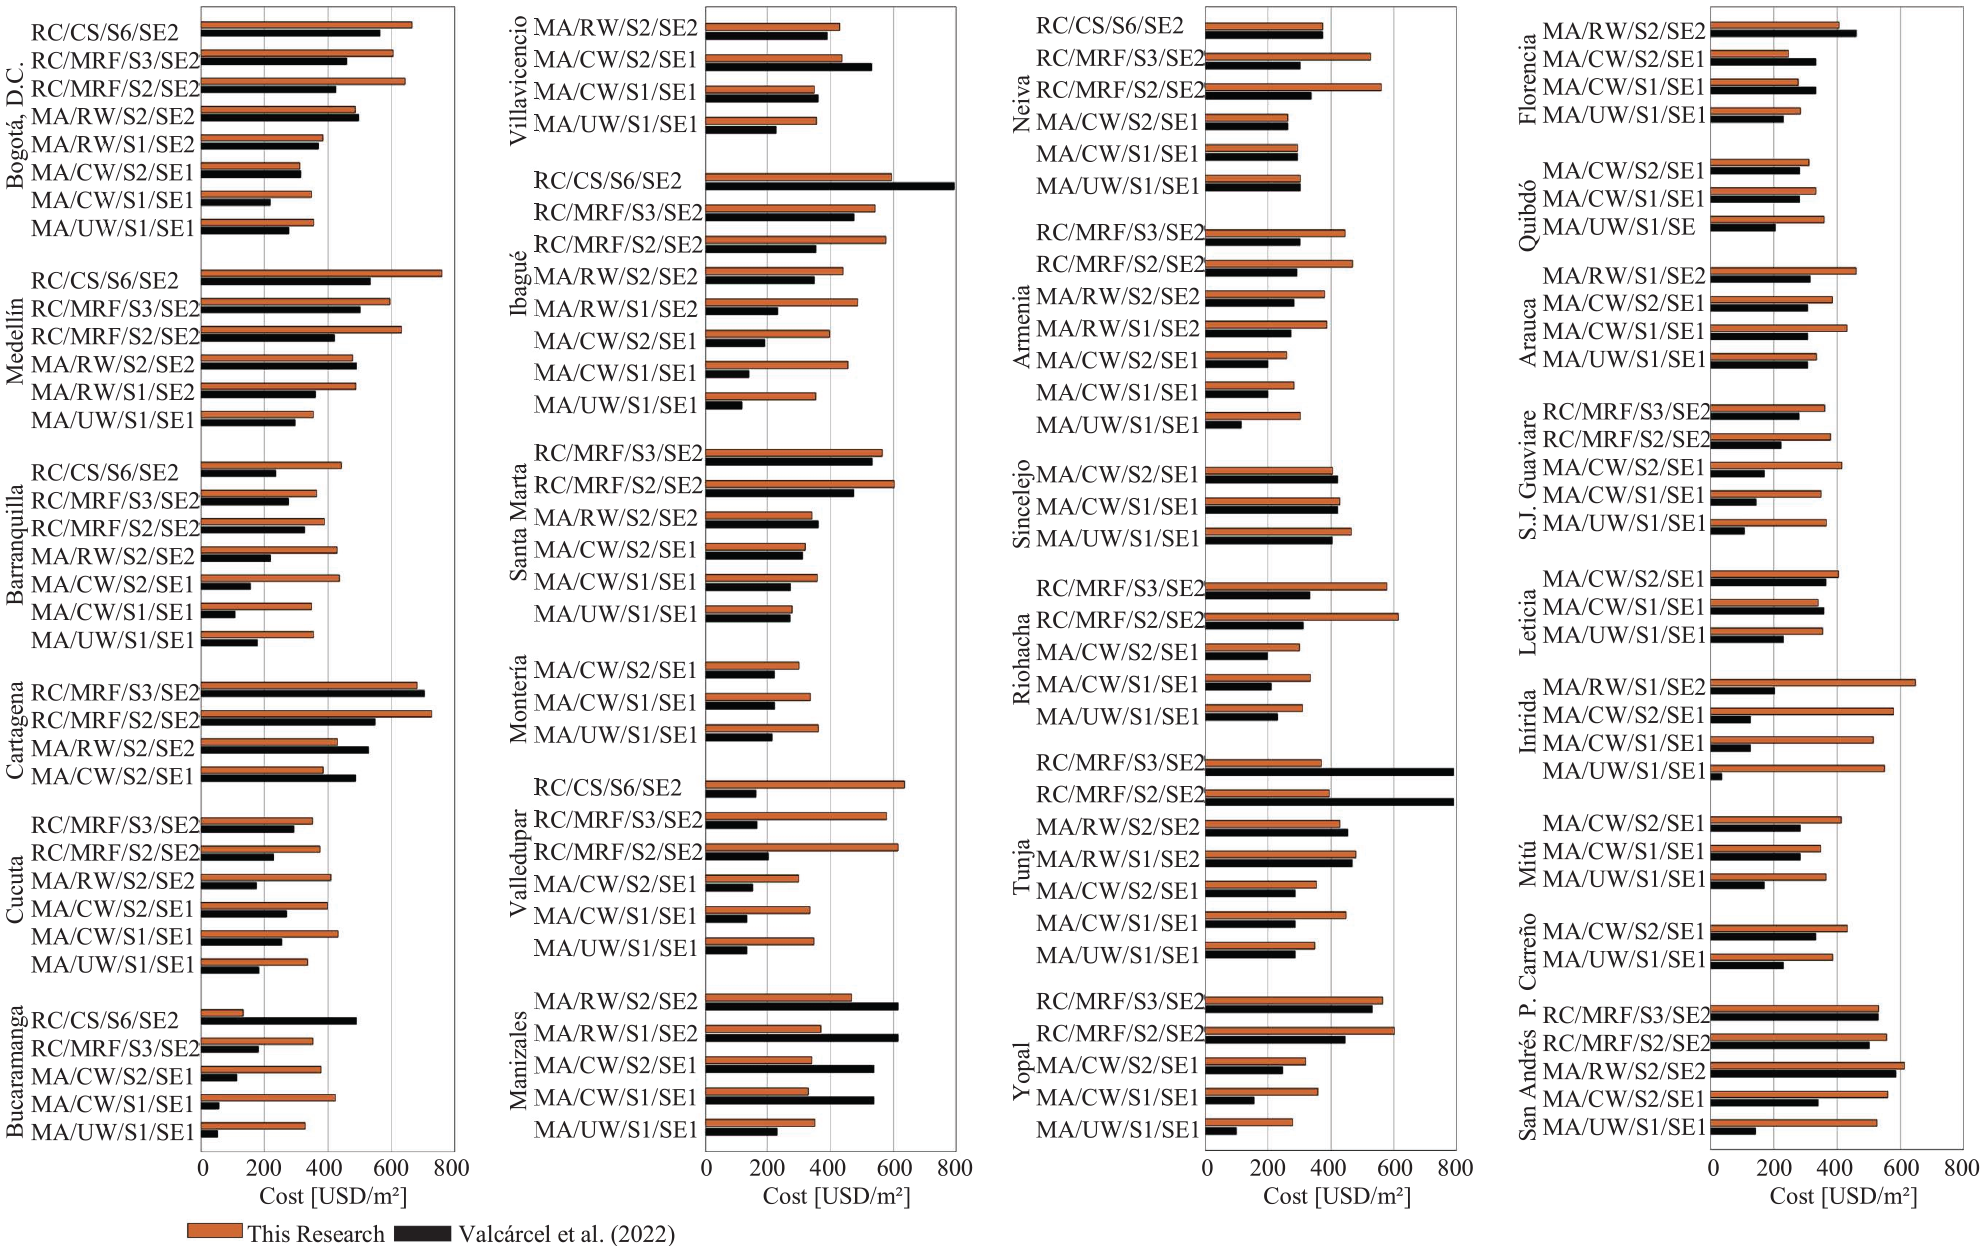
Calculation of DCC and RPC of the site of interest.
This study’s analysis of Colombian residential RPCs reveals notable differences when compared to existing literature. While previous studies often provide general estimates without accounting for regional SE variations or specific construction typologies. This study offers a more detailed and localized assessment. It highlights the influence of economies of scale and construction market maturity on reducing RPCs, particularly for masonry systems in less dense areas. In addition, the study underscores the disparity in RPCs between different structural systems, which is often overlooked in the broader literature. Unlike previous research, which may under-represent the RPC dynamics of low-income housing, this study emphasizes the economic vulnerability associated with common typologies in Colombia, offering a more comprehensive and accurate understanding of RPCs across the country.
Limitations and future work
Despite the valuable contributions of the developed model, this work has some limitations and areas for further exploration. First, the use of both real cost data from developers and public procurement costs for housing introduced discrepancies in the model’s construction value database. Public procurement costs tend to be higher due to the inclusion of transaction costs, leading to increased data variance and a decline in the statistical model’s precision. A potential solution is to create a homogenized data set of construction cost information. Second, some of the construction cost data used in this study were from years before 2023, the model’s normalizing year. These earlier values were adjusted to present value using correction factors for housing sector construction costs, specifically the ICOCED and ICCV indexes from DANE (2023b). However, these indexes do not fully account for the rapid changes in material prices caused by the pandemic’s impact on the construction supply chain. As a result, the indexed construction costs may not accurately reflect the actual 2023 values. To prevent such discrepancies during economic shocks, econometric indexing models should be developed to better align construction costs with fluctuations in material prices and labor wages. ICCs are influenced by the expertise and process optimization of the project developer. A skilled developer can streamline processes, thereby reducing indirect costs. Future research could explore how a developer’s expertise impacts the model’s outcomes. Finally, a key limitation of this study is the uniform application of the
Conclusion
This study developed an SRC model for the MNRS in Colombia. Based on the RPC analysis and their compared building typologies, the following conclusions were obtained:
The multiple regression model implemented in this study demonstrated that both the SE income level of a residential building and the distance for transporting construction materials within the supply chain are significant SE factors influencing the RPC estimation for a particular structural typology in residential buildings.
The integration of the SRC model into the MNRS provides a more detailed and accurate understanding of the economic impact of seismic events on residential buildings across different regions in Colombia. This improvement allows for better-informed decision-making in risk mitigation and urban planning.
The study highlights significant disparities in RPCs among different building typologies. Reinforced concrete systems, particularly moment-resisting frames, are more expensive compared to masonry-based systems. This finding underscores the importance of considering construction typologies in seismic risk management, especially in low-income areas where cost-effective solutions are critical. The results indicate that masonry systems, particularly confined masonry, are more suitable for addressing housing demand in less densely populated areas. Policymakers should prioritize promoting these systems to optimize housing affordability and resilience in regions with lower-income populations, thereby reducing the state’s financial burden in the event of seismic damage.
Economies of scale and transportation network efficiency are key factors that contribute to reducing the RPC of residential buildings. Therefore, Colombia can mitigate its exposure to seismic risks through a dual approach. First, by offering incentives to the construction sector to encourage economies of scale. Second, by enhancing the efficiency of the transportation network to facilitate material supply in housing construction. Policymakers should consider implementing mitigation measures that include incentivizing the construction sector to adopt industrialized construction practices, thereby reducing the replacement value of assets at risk of damage.
By providing a more granular analysis of RPCs, this study contributes valuable insights to seismic risk mitigation strategies, particularly in the context of affordable housing and urban environments. The findings support the need for targeted interventions to strengthen the resilience of Colombia’s housing sector against future seismic events.
Supplemental Material
sj-xlsx-1-eqs-10.1177_87552930251346773 – Supplemental material for A simplified replacement cost model for residential buildings located in developing countries: The case study of Colombia
Supplemental material, sj-xlsx-1-eqs-10.1177_87552930251346773 for A simplified replacement cost model for residential buildings located in developing countries: The case study of Colombia by Juan C Reyes, Diego A Peñaranda, Nathalia Ceron, Miguel Mora, Jose A Guevara, Maria X Valenzuela and Diego Rojas in Earthquake Spectra
Footnotes
Declaration of conflicting interests
The author(s) declared no potential conflicts of interest with respect to the research, authorship, and/or publication of this article.
Funding
The author(s) disclosed receipt of the following financial support for the research, authorship, and/or publication of this article: The work presented in this paper has been developed within the framework of the Special Cooperation Agreement No. 018 of 2021 between the Colombian Geological Survey (SGC) and the Colombian Association of Engineering Faculties (ACOFI), with financial resources from the National General Budget and the General System of Royalties, and in-kind contributions from ACOFI and the participating universities.
Data availability statement
The data used in this study come from the following publicly available sources: the GIROZERO Dashboard for Economic Dimension (https://girozero.uniandes.edu.co/en/tools/dashboard), the National Cargo Dispatch Registry RNDC of the Ministry of Transportation (https://plc.mintransporte.gov.co/Estad%C3%ADsticas/Carga-Modo-Terrestre/Carga-Movilizada-Carretera-RNDC), the Construction Cost Index for Buildings ICOCED (https://www.dane.gov.co/index.php/estadisticas-por-tema/precios-y-costos/indice-de-costos-de-la-construccion-de-edificaciones-icoced/indice-de-costos-de-la-construccion-de-edificaciones-icoced-historicos), the Housing Construction Cost Index ICCV (https://www.dane.gov.co/index.php/estadisticas-por-tema/construccion/indice-de-costos-de-la-construccion-de-la-vivienda/iccv), and budgets from the public procurement web platform SECOP (![]() ). Actual construction budgets from the private sector are confidential, and, therefore, they cannot be assessed online. The replacement cost estimates estimated in this research for the 1.120 municipalities of Colombia, encompassing over 50 typologies per municipality, are openly available as Supplementary Material.
). Actual construction budgets from the private sector are confidential, and, therefore, they cannot be assessed online. The replacement cost estimates estimated in this research for the 1.120 municipalities of Colombia, encompassing over 50 typologies per municipality, are openly available as Supplementary Material.
Supplemental material
Supplemental material for this article is available online.
Notes
References
Supplementary Material
Please find the following supplemental material available below.
For Open Access articles published under a Creative Commons License, all supplemental material carries the same license as the article it is associated with.
For non-Open Access articles published, all supplemental material carries a non-exclusive license, and permission requests for re-use of supplemental material or any part of supplemental material shall be sent directly to the copyright owner as specified in the copyright notice associated with the article.