
Abstract
In the present study, crystallisation behaviours of the Al80Fe10Ti10 amorphous phase (prepared by mechanical alloying) has been investigated using X-ray diffraction and differential thermal analysis techniques. It was found that Al80Fe10Ti10 amorphous phase exhibits one-stage crystallisation on heating [amorphous to Al13Fe4, Al(Fe,Ti) and Al5Fe2 intermetallic phases]. The activation energies for crystallisation of Al80Fe10Ti10 amorphous phase were determined as 326, 322, 351 and 301 kJ mol−1 by means of the Kissinger–Akahira–Sunose, Flynn–Wall–Ozawa, Friedman and Afify equations respectively. Kinetic parameters such as Avarmi exponent or reaction order n and frequency factor Ko were also discussed. The reaction orders obtained for the crystallisation was ∼2·03, suggesting that a diffusion controlled crystallisation process with a decreasing nucleation rate was the crystallisation mechanism. The deduced Ko value for crystallisation peak was calculated to be 6·75×1010 s−1.
Introduction
The main advantages of aluminium based alloys are low density and good corrosion resistance. Among the aluminium alloys, Al–Fe systems seem to be of technological interest due to the two practically used metals in these systems and their advantageous properties, in particular high specific strength, high specific stiffness, good strength and excellent corrosion resistance.1– 7
A new class of Al based alloys, which have received a great deal of attention over the last few years, are amorphous as well as nanocrystalline ones.8 It has been shown that this type of alloys can be prepared using either melt spinning or mechanical alloying (MA) techniques. Mechanical alloying is a widely used processing route for synthesis of a variety of phases, mainly non-equilibrium ones.9– 11
However, MA products are in the form of a powder; thus, consolidation is a necessary step for milled powders for possible practical applications. As further material processing strategies, such as hot consolidation, must be employed to compact the powder amorphous materials into bulk shapes for a range of engineering applications, it is important to have knowledge of the thermal stability and phase transformations of these metastable alloys.5
Therefore, in this paper, Al80Fe10Ti10 powder mixture was mechanical alloyed, and the fully amorphous phase was obtained. The structural and phase changes, which take place during MA and heating of the milled products, were studied. The crystallisation kinetics of produced amorphous phase was analysed, and more accurate values for the activation energies of crystallisation in addition to other kinetic parameters (n and Ko) by employing several non-isothermal models for Al80Fe10Ti10 amorphous phase were achieved.
Experimental
The powders of Al (99%), Fe (99·9%) and Ti (99%) were used as raw materials. The elemental powders with composition of Al–10Fe–10Ti (at-%) were mechanically alloyed in a planetary ball mill under argon atmosphere. MA was carried out in a steel container at room temperature. The rotation speed of 250 rev min−1 and ball/powder ratio of 10∶1 were employed. Stearic acid powder (1 wt-%), supplied by Merck, was used as the process control agent.
X-ray diffractometry was used to follow the structural changes of powders during milling and subsequence annealing. A Philips diffractometer (40 kV) with Cu Kα radiation (λ = 0·15406 nm) was used for XRD measurements. The XRD patterns were recorded in the 2θ range of 20–100° (step size: 0·03°; time per step: 1 s).
Differential thermal analysis was also conducted to study the thermal stability of produced amorphous alloy using a Rheometric STA 1500 differential thermal analyser. The samples were placed in Al2O3 pans and heated in dynamic Ar atmosphere up to 1200°C at heating rates of β = 10, 20 and 30°C min−1.
Theory
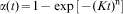
Crystallisation kinetics of glassy materials can be described through three kinetic parameters, namely, the activation energy for crystallisation, the Avrami exponent, which reflects the mechanism of nucleation, and the growth process and the frequency factor. In calorimetric measurements, non-isothermal methods can be used to obtain these parameters. In these methods, the sample is heated at a constant heating rate β, and the heat produced is recorded as a function of temperature or time. The theoretical basis for interpreting differential thermal analysis (DTA) data for crystallisation is provided by the classical Johnson–Mehl–Avrami (JMA) model.12–
14 In this model, the crystallised volume fraction α can be expressed as a function of time according to the relation
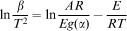
In this study, various theoretical models, such as Flynn–Wall–Ozawa (FWO), 15 15,16 Kissinger–Akahira–Sunose (KAS), 17 17,18 Friedman (FR)19 and Afify (AF),20 are considered to understand the crystallisation kinetics of the amorphous Al80Fe10Ti10 alloy using the non-isothermal DTA measurements. The main points of these models are described as follows.
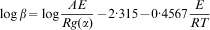
The FWO
15
15,16 method is a linear integral method based on equation (3)
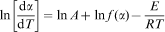
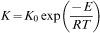
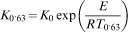
Moreover, Afify20 introduced a new method for studying the transformation kinetics of crystallisation under non-isothermal conditions according to JMA equation. In this method, the activation energy for crystallisation E, the frequency factor Ko and the Avrami exponent n can be determined. According to this method, the JMA
13
13,14 equation can be written as
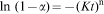

The Avarmi exponent n is an important parameter, which can directly reflect the crystallisation mode. Ozawa21 developed a model to describe the kinetics of non-isothermal crystallisation. In this model, the crystallised volume fraction α is

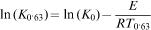
Moreover, Afify20 suggested a method to determine the Avrami exponent n under the non-isothermal conditions by taking the double logarithm of equation (6) as

Results and discussion
Mechanical alloying
Figure 1 shows the XRD patterns of Al–10Fe–10Ti (at-%) powder mixture after various milling times. On the basis of these patterns, phase transformations occurred in the powder samples during the MA process. The XRD results demonstrate that with increasing milling time, the intensity of the Fe and Ti diffraction peaks decreases progressively. These changes suggest that these two elements dissolute in Al matrix, and an Al solid solution forms during this stage of the process. Another feature which can be seen in this pattern is broadening of the Al diffraction peaks due to the reduction in grain size and the increase in lattice strain. As seen, after 50 h of MA, the Al peaks vanish completely, and only an amorphous halo is visible.
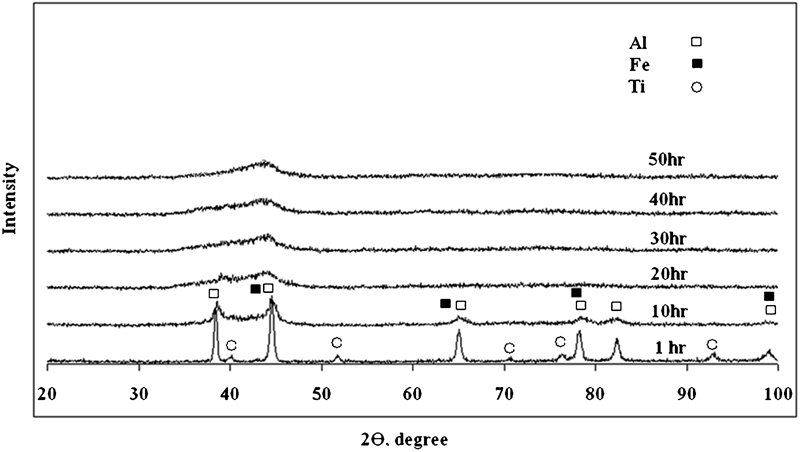
Patterns (XRD) of Al–10Fe–10Ti (at-%) powder mixture after various milling times
The amorphisation mechanism during MA is generally attributed to microstructural breakdown followed by the interdiffusion of elements22 or mechanically driven atomic mixing 23 23,24 among previously formed nanocrystalline multilayers. In mechanically alloyed experiments, the kinetic process of the amorphisation reactions usually proceeds slowly, and therefore, a glass forming composition is determined only after milling for an extended time.25– 27 According to the above, the product of performed MA (for longer than 50 h) of Al80Fe10Ti10 powder mixture is an amorphous phase.
Non-isothermal analyses by DTA
As mentioned in the previous section, milling the mixed powder for 50 h led to the formation of Al80Fe10Ti10 amorphous phase. The mechanically milled structure is in a metastable state. So, it is generally expected that considerable structural and phase changes can occur upon heating the milled powder.11 In order to study the thermal behaviour of the produced amorphous phase, the sample was examined by DTA under continuous heating conditions. Figure 2 shows the DTA heating traces of the Al80Fe10Ti10 amorphous alloy at different heating rates ranging from 10 to 30°C min−1. As seen in this figure, with the increase in heating rate, the crystallisation peak shifts to higher temperatures. It can also be observed that two peaks appear in DTA curve (one exothermic peak at 900°C and endothermic one at 1150°C). To analyse the crystallisation process responsible for the exothermic peak, the as blended sample was annealed in Ar atmosphere at 950°C for 20 min. The XRD patterns of the as blended powder after annealing at 950°C are presented in Fig. 3. As can be seen, the annealed sample at 950°C mainly consists of Al13Fe4, Al(Fe,Ti) and Al5Fe2 intermetallic phases. Therefore, the exothermic peak in Fig. 2 should be attributed to the precipitation of these phases from amorphous phase. Meanwhile, the endothermic peak in Fig. 2 (at 1150°C) related to melting of produced alloy. These results indicate that the total transformation sequence of the Al80Fe10Ti10 amorphous alloy is a one-stage process in the temperature range from 850 to 950°C. In fact, the DTA results indicate that the crystallisation in Al80Fe10Ti10 system is different from that in Al80Fe20 and Al83Fe17 amorphous systems. 28 28,29 In fact, in contrast to Al80Fe10Ti10 amorphous alloy (which exhibit one-stage crystallisation on heating), Al80Fe20 and Al83Fe17 amorphous phases exhibit three-stage crystallisation on heating.
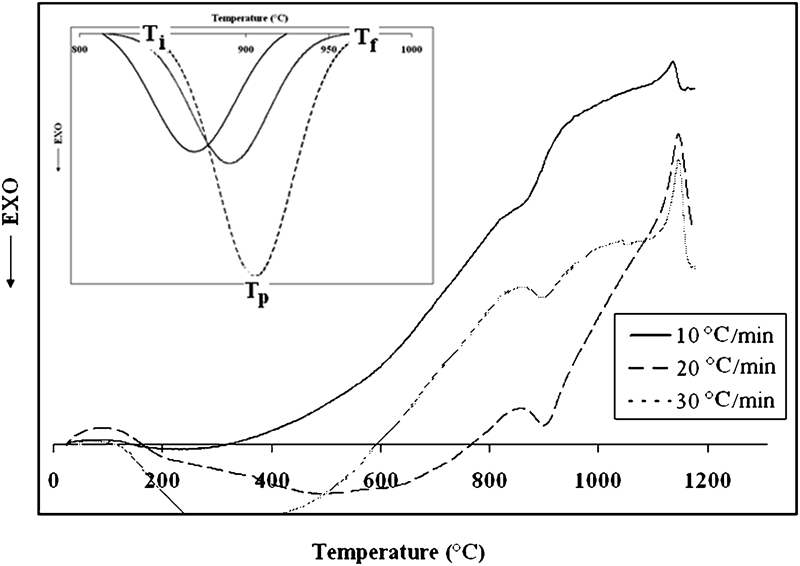
Differential thermal analysis trace of Al–10Fe–10Ti (at-%) powder mixture after 50 h of MA process
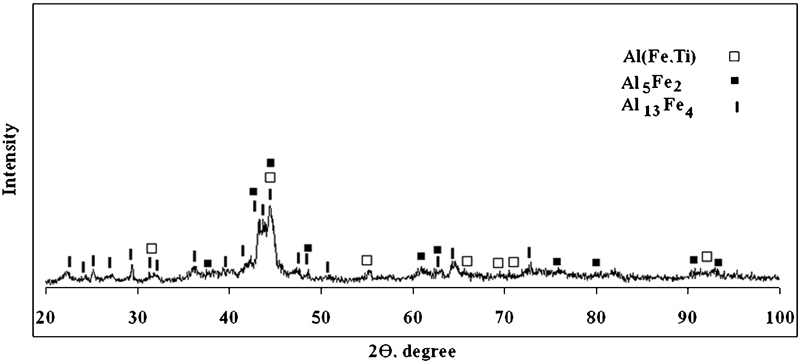
Patterns (XRD) of Al80Fe10Ti10 amorphous phase after annealing at 950°C
The volume fraction α of the sample transformed into crystalline phase during crystallisation event has been obtained from the DTA curves (Fig. 2) as a function of temperature T by means of the partial area method. The crystallised volume fraction α at any temperature T is given as α = (AT/A), where A is the total area of the exothermic peak between the temperature Ti, where the crystallisation is just beginning, and the temperature Tf, where the crystallisation is completed, and AT is the area between the initial temperature and any temperature T, ranging between Ti and Tf as illustrated in the inset of Fig. 2. The plots of α versus T at different heating rates are shown in Fig. 4. Their shapes are typical sigmoidal type, as appearing quite frequently in the literature.30– 32 The sigmoidal plot exhibits the bulk crystallisation and excludes the chance of surface crystallisation.32
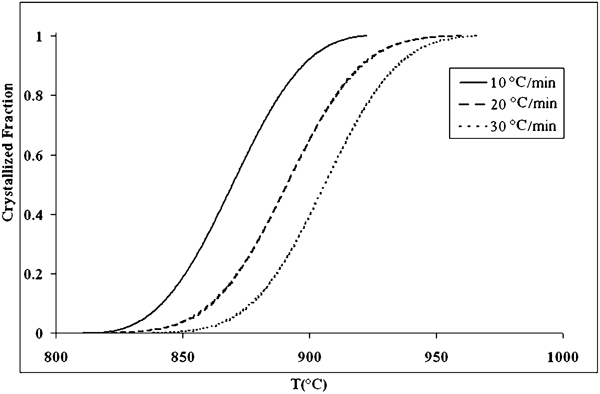
Crystallised volume fraction α as function of temperature for Al80Fe10Ti10 amorphous phase at different heating rates
In order to evaluate the activation energy E for the non-isothermal crystallisation of Al80Fe10Ti10 amorphous alloy, FWD, KAS, FR and AF methods were used. The average apparent activation energies values for crystallisation of Al80Fe10Ti10 amorphous alloy calculated by means of FWO, KAS, FR and AF methods are presented in Table 1. As can be seen, the activation energy of crystallisation in Al80Fe10Ti10 amorphous alloy is equal to 325±25 kJ mol−1.
Average apparent activation energy values for crystallisation of Al80Fe10Ti10 amorphous alloy calculated by means of FWO, KAS, FR and AF methods
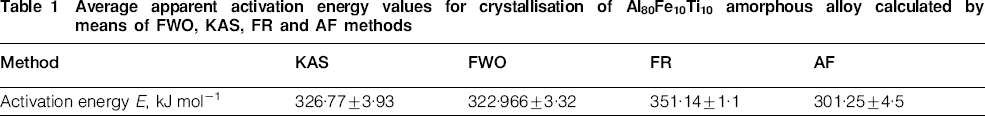
The activation energy of primary crystallisation for Al80Fe20 is 191·0±9·6 kJ mol−1.28 In the present study, the activation energy of amorphous Al80Fe10Ti10 alloy is 325±25 kJ mol−1. The difference in activation energy between amorphous Al80Fe10Ti10 alloy and amorphous Al80Fe20 alloy results from two factors. The first is that one stage was observed during the crystallisation process of amorphous Al80Fe10Ti10 alloy, while three stages were observed for amorphous Al80Fe20 alloy. The second is the effects of Ti addition. The strong interaction between the Al and Ti may result in the difference in activation energy of crystallisation.
The Avrami exponent n gives detailed information on the nucleation and growth mechanism. As for the diffusion controlled growth behaviour, 1<n<1·5 stands for the growth of particles with an appreciable initial volume; n = 1·5 stands for the growth of small particles with a nucleation rate close zero; 1·5<n<2·5 reflects growth of small particles with a decreasing nucleation rate; n = 2·5 pertains to the growth of small particles with a constant nucleation rate; n>2·5 indicates the growth of small particles with an increasing nucleation rate.33
In order to determine the Avrami exponent n for the crystallisation of Al80Fe10Ti10 amorphous alloy, Ozawa21 and Afify20 methods were used. The values deduced for the reaction order n is ∼2·03 for each methods, corresponding to a diffusion controlled, three-dimensional growth of small particles with a decreasing nucleation rate.33
Isothermal annealing
In order to investigate the thermal stability and structural changes of produced amorphous alloy under crystallisation temperature, the as milled powder particles (for 50 h) were annealed at several temperatures for 3 h. The XRD patterns of as milled and annealed samples at 200, 300, 400, 500, 600 and 650°C are presented in Fig. 5.
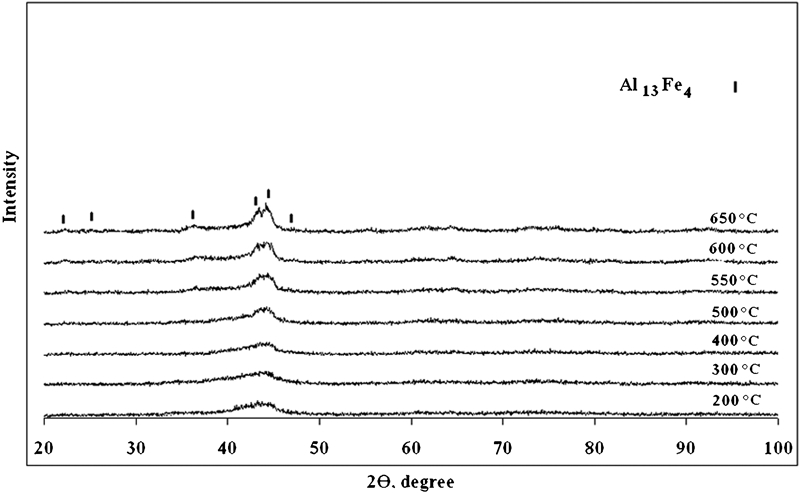
Patterns (XRD) of Al80Fe10Ti10 amorphous phase after annealing at 200, 300, 400, 500, 600 and 650°C for 3 h
Analysis of the XRD patterns in Fig. 5 reveals that after annealing the powder mixture in temperatures below 400°C, structural relaxation and stress relief processes are the only considerable changes that occur in the amorphous phase, and no evidence of crystallisation is found from XRD patterns. In contrast to the above, by annealing the samples above 400°C (under crystallisation temperature), Al13Fe4 intermetallic phase precipitated from the amorphous matrix. As seen in Fig. 5, the intensity of the Al13Fe4 intermetallic peaks in XRD patterns increases with increasing annealing temperature. It is indicated that the volume fraction of the Al13Fe4 intermetallic phase that precipitated from amorphous matrix increases at higher temperatures.
Conclusions
Based on the investigation of the crystallisation kinetics of Al80Fe10Ti10 amorphous alloy using non-isothermal DTA analysis method, the main results are summarised as follows. Amorphous Al80Fe10Ti10 alloy is obtained by MA. The crystallisation process of produced amorphous alloy is a one-stage mode, which corresponds to the Al13Fe4, Al(Fe,Ti) and Al5Fe2 intermetallic compounds. The activation energies for crystallisation of Al80Fe10Ti10 amorphous alloy are determined as 326, 322, 351 and 301 kJ mol−1 by means of the KAS, FWO, FR and AF equations respectively. The values of Avarmi exponent or reaction order n for crystallisation reaction was 2·03, confirming a diffusion controlled crystallisation process with a decreasing nucleation rate.