
Abstract
According to the relationship between damping, strain and time, the piecewise linear wavelet transform and the piecewise linear short time Fourier transform methods are put forward to identify the nonlinear damping of alloy material. The overall nonlinear property of damping is derived from the piecewise local linearisation. The satisfied results obtained from simulations demonstrate that the methods presented are effective. Usually, damping measured in the non-uniform stress field is only a volumetric average. To overcome this deficiency, a trapezoid specimen with quasi-uniform stress field is developed on the basis of the traditional damping experimental equipment. The damping measurement experiment is carried out. The measurement signal is analysed by the two methods presented. The relation curve of damping versus strain has shown that the damping capacity of the alloy Al–33Zn–6Si increases with the increasing strain. The relationship between damping and strain appears obviously nonlinear.
Keywords
Introduction
Using high damping material to reduce vibration and noise in mechanical systems has become an efficient method in recent years. One of the most important items in the structure design of machines is the damping characteristic of material. Normally, for a low internal dissipation metal material, damping is considered as a constant to simplify the computation. While for a high dissipation material, such as damping alloy, damping is related to the stress amplitude, and is always a nonlinear function of strain. 1 Therefore, in this case, a constant damping consideration will lead to big error.
Because that damping is the natural characteristic of material, it cannot be computed quantitatively from the view of theory. At present, damping is often identified by means of experiments combining with appropriate identification methods. The identification methods for constant damping, such as time domain and frequency domain methods, have become mature. But the research on the identification of nonlinear damping is still not enough. Audenino employed the auto-regressive moving average (ARMA) method and the exponent method to compute the nonlinear damping from the free response signal of a single degree of freedom (SDOF) system,1,2 where the nonlinear relationship between lost factor and strain is obtained. Liu obtained the data of lost factor and strain through the load varying experiments, and the quadratic curve of lost factor versus strain are got by means of the curve fitting. 3 With the rapid development of signal processing, the time frequency analysis technique has been used to identify the constant damping, but it is seldom used for the identification of the nonlinear damping.4–6
The aim of this paper is to present two time frequency methods for the identification of nonlinear internal damping of alloy. The rest of the paper is organised as follows: the Wavelet transform (WT) method and the short time Fourier transform (STFT) method for constant damping identification are introduced in the sections on ‘Constant damping computation using wavelet transform method’ and on ‘Constant damping computation using short time Fourier transform method’ respectively. In the section on ‘Computation of nonlinear damping using PLWT and PLSTFT methods’ the piecewise linear wavelet transform (PLWT) and the piecewise linear short time Fourier transform (PLSTFT) methods for nonlinear damping, are put forward. The section on ‘Simulation’ presents a numerical example to examine the performance of these two methods. The experimental investigation is carried out in the section on ‘Experiment’, in which the internal damping characteristics of a new kind of damping alloy Al–33Zn–6Si are studied. Conclusions are given in the last section.
Constant damping computation using wavelet transform method
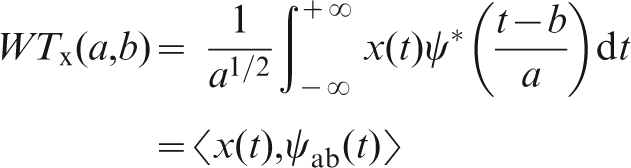
The continuous wavelet transform of a time domain signal x(t) is defined as
7
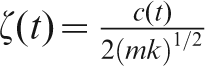
The free response signal of a SDOF system with constant damping can be expressed as
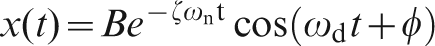
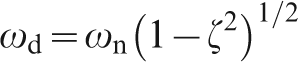 is the damped natural frequency, ζ is the damping ratio, and φ is the phase angle.
The wavelet transform of equation (2) is described as
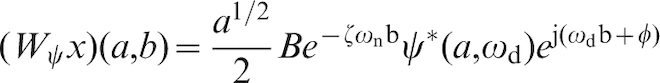
 .
.
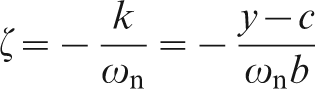
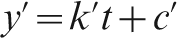
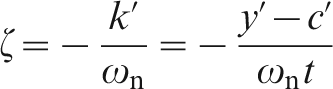
The relationship between y and the translation parameter b (or time t) is linear. Thus, the constant damping ratio of the SDOF system can be computed by the following equation
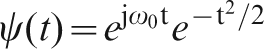
 , which satisfies the admissibility condition approximately.
Constant damping computation using short time Fourier transform method
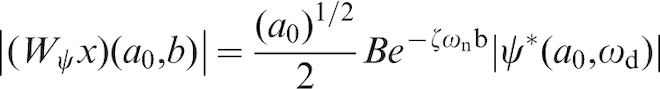
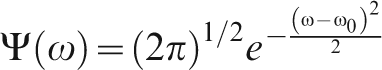
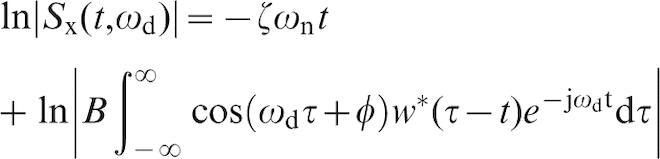
The STFT of equation (2) is defined as
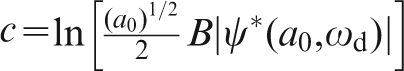
Take the natural logarithm of equation (9), and there is
 .
.
Therefore, the constant damping ratio can be computed from the slope k′, that is
Computation of nonlinear damping using PLWT and PLSTFT methods
When a vibration system with nonlinear damping is considered, the vibration amplitude of its free response is time varying. This will lead to the strain's variation with time during vibration. In addition, damping is a function of strain. Therefore, the damping of the system can be seen as a time varying parameter indirectly in the vibration.
Based on the constant damping computation procedure using the WT and STFT methods, the PLWT and PLSTFT methods are put forward to identify the nonlinear damping from a free response signal of the system. The procedure of the PLWT method is as follows:
the free response signal of a SDOF system with nonlinear damping is transformed by means of the wavelet transform. The modulus corresponding to the natural frequency of the wavelet transform is extracted. Then, taking the logarithm of the modulus, we can get a relationship curve of the logarithm of the wavelet transform modulus versus b, as shown in Fig. 1.
starting from the first point of the curve, a short straight line p1p2 can be got by connecting the adjacent point p1(b1, y1) and p2(b2, y2). Therefore, the slope k1 of the straight line p1p2 can be obtained. According to equation (7), the damping ratio ζ1 can be calculated out. Ascribing the damping ratio ζ1 to time b1, the first pair of data (b1, ζ1) can be obtained.
next, connecting the adjacent point p2(b2, y2) and p3(b3, y3), the damping ratio ζ2 can be obtained from the slope k2 of the straight line p2p3 using the same method. Thus, another pair of data (b2, ζ2) can be obtained. Repeatedly, a series of data (bi, ζi) can be achieved. The relationship curve of ζ versus b is obtained by plotting these data.
accordingly, the strain amplitude corresponding to each time can be computed based on the displacement amplitude. At last, the relationship between damping ratio and strain can be obtained.
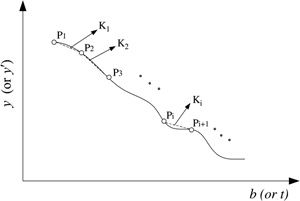
Schematic diagram of nonlinear damping computation using the PLWT and PLSTFT methods
The principle of the nonlinear damping computation using the PLSTFT method is similar to that using the PLWT method as described above.
Simulation
A simple SDOF system with time varying damping is considered here to verify the validity of the two nonlinear damping computation methods presented. The governing equation of the system is
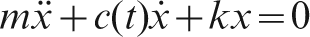
 and
and  are the displacement, velocity and acceleration of the mass, respectively
By introducing the damping ratio ζ and the undamped natural frequency ωn, equation (15) is rewritten as
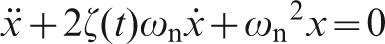
 , and
, and 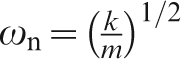 with m = 1 kg, and k = 4·3525×10
5
N m−1.
with m = 1 kg, and k = 4·3525×10
5
N m−1.
The damping ratio is set as a cubic function of time: ζ(t) = 3·5×10−3(1+t 3 ).
In addition, the Logarithmetic decrement (LD) method is a traditional time domain method that has been used to compute damping. In the method, damping is also identified through the peaks of the free response signal of the system. Its main mathematical description is
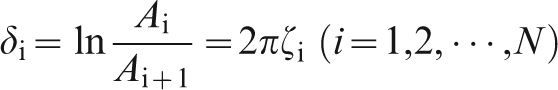
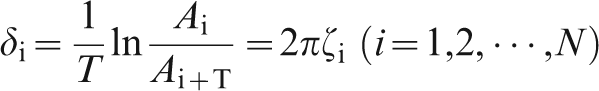
The detailed introduction about this method can be found in literature. 8 For the aim of comparison, damping estimated by the (LD) method is also given out in the simulation.
The free response signal of the SDOF system is obtained by solving the governing equation using the Runge–Kutta method. The sampling frequency is Fs = 1005 Hz. Without loss of universality, two kinds of signals are analysed:
ideal free response signal with no noise
free response with 60 dB signal noise ratio (SNR).
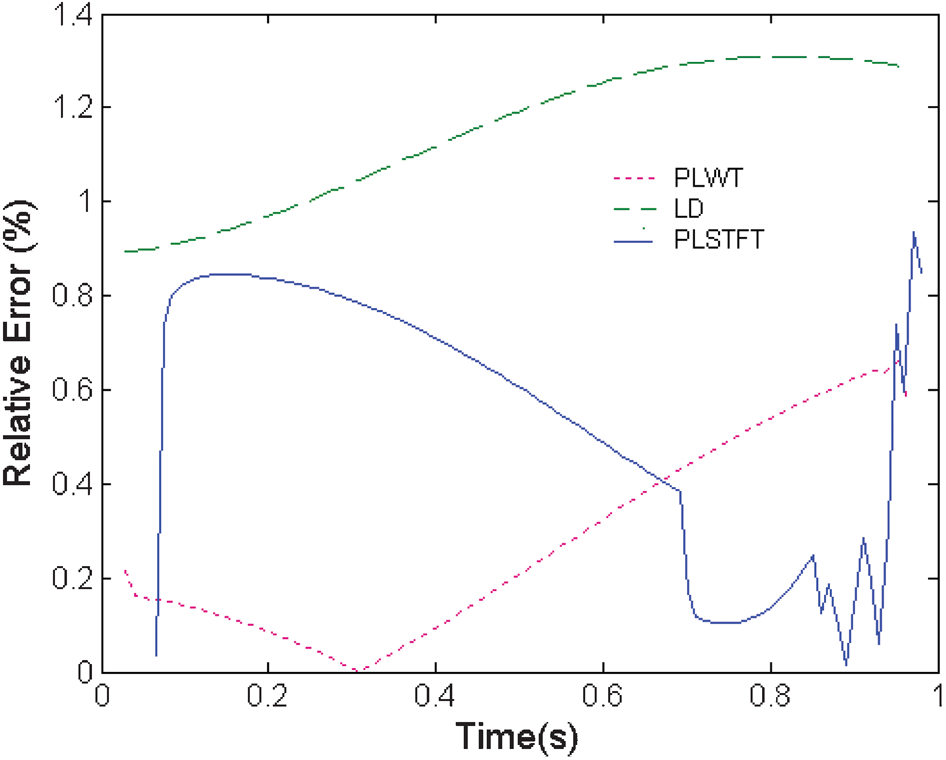
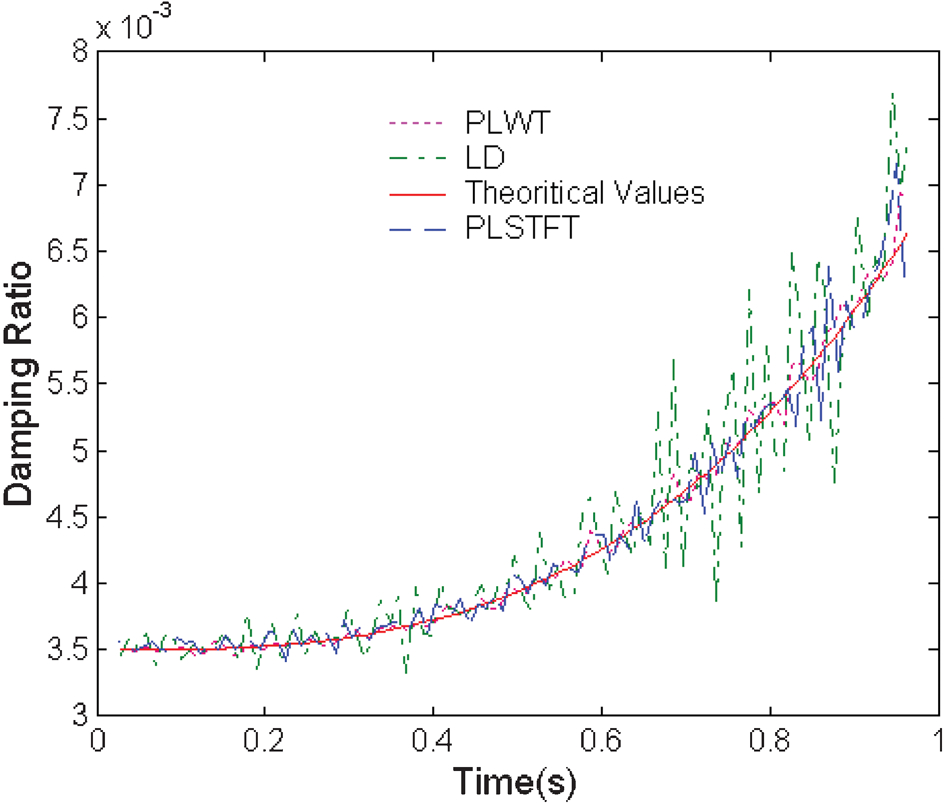
Combining with the two Matlab toolbox functions ‘tfrcw.m’ and ‘tfrstft.m’, 9 the PLWT and PLSTFT methods are realised. The obtained relationship curves of damping ratio versus time are shown in Figs. 2 and 3 respectively. The result computed by the LD method is also presented. Moreover, in order to illustrate the estimation accuracy, the relative errors are also given out in Figs. 4 and 5.
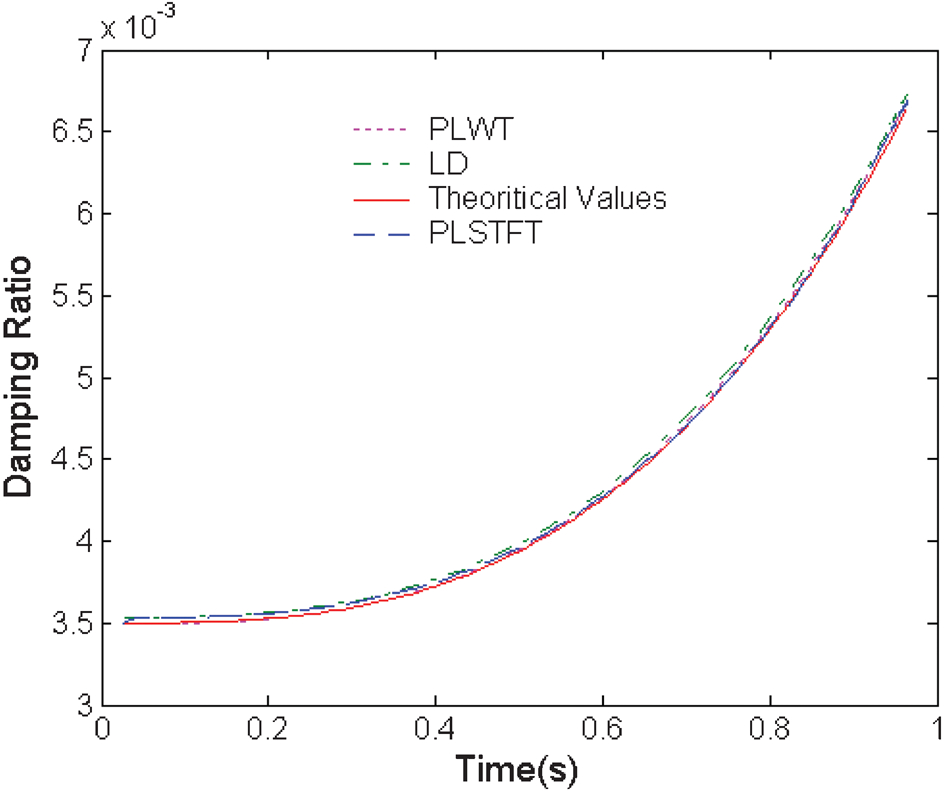
Relationship curve of damping ratio versus time using LD, PLWT and PLSTFT method with no noise
Relationship curve of damping ratio versus time using LD, PLWT and PLSTFT method with SNR = 60 dB
Relationship curve of relative error versus time using LD, PLWT and PLSTFT method with no noise
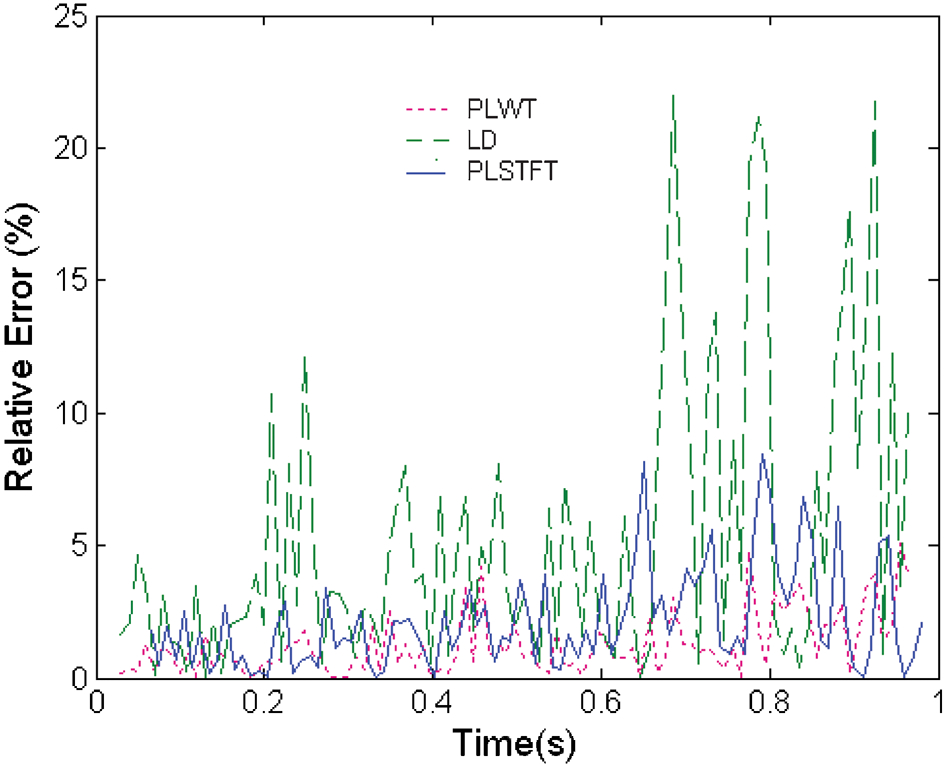
Relationship curve of relative error versus time using LD, PLWT and PLSTFT method with SNR = 60 dB
It can be seen from Figs. 2 and 4 that, without the noise's disturbance, the identified damping ratio values using the above three kind methods match the theoretical curve well. The maximum relative error is 1·3% generated by the LD method. In Figs. 3 and 5, when considering a certain noise, the results obtained by the PLWT and PLSTFT methods are still satisfied. However, the LD method does not work well. The maximum relative error reaches to 22%.
Relatively, the accuracy and antinoise ability of the PLWT and PLSTFT methods are better than the LD method. In the former two methods, the signal is thansformed from time domain to frequency domain, and the influence of the noise is reduced accordingly. The wavelet transform method has good local property both in time domain and in frequency domain. It also has an advantage of multiresolution analysis. Therefore, the estimation accuracy of the PLWT method is higher than that of the PLSTFT method.
Experiment
Damping alloy
In the experiment, the internal damping behaviour of the alloy Al–33Zn–6Si is investigated. 10 The geometry dimensions of the trapezoid beam specimen made of the alloy is shown in Fig. 6, and the parameters of the specimen are listed in Table 1.
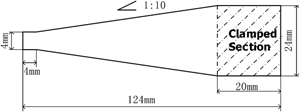
Trapezoid cantilever beam specimen
Parameters of specimen

The trapezoid cantilever beam mainly bears bending stress in the process of transverse vibration. The shearing stress is so weak in the whole stress field that it can be ignored. Therefore, the stress field of the beam during vibration can be seen as a quasi-uniform stress field approximately.
Measurements
The schematic diagram of the nonlinear damping experimental system is shown in Fig. 7. The experiment is carried out under the normal room temperature. The suspended length of the trapezoid beam is 104 mm. The clamped section of the trapezoid cantilever beam is shown in Fig. 6. In order to avoid local high stress and plastic deformation, a soft copper sheet is added to the clamped section of the beam. The clamping force is applied by using the moment spanner in order to prevent the clamped region from plastic deformation. The clamping damping is not considered.
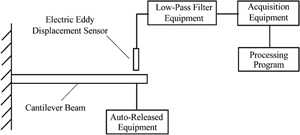
Schematic diagram of nonlinear damping experimental system
The initial displacement is applied to the beam through the autoreleased equipment at the free end, and the displacement is measured by using a noncontact electric eddy sensor. In the range of elastic deformation, the bending deflection of the beam is controlled as high as possible to obtain high stress. Data acquisition is accomplished by the INV306DF signal acquisition equipment whose resolution of A/D converter is 12 bits. The sampling frequency for the trapezoid beam is 1600 Hz.
Results and analysis
The sampled free response signal of the beam is shown in Fig. 8. According to the wavelet transform and the STFT, The relationship curves of damping ratio versus strain using the PLWT and the PLSTFT methods are shown in Fig. 9, in which x axis denotes the strain extremum in a vibration cycle.
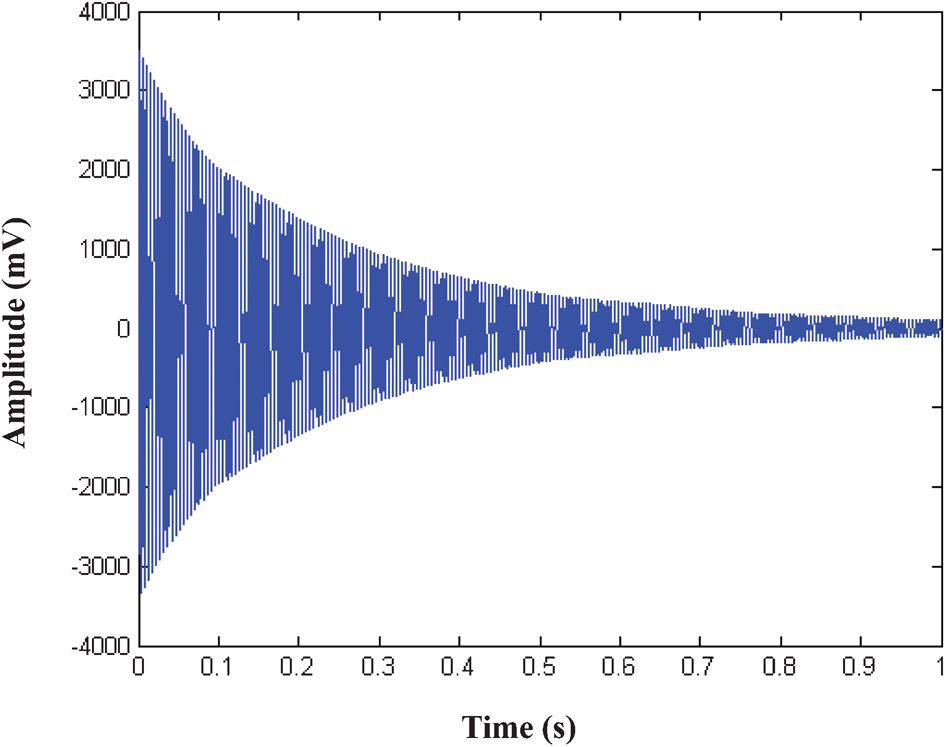
Measured free response of trapezoid cantilever beam
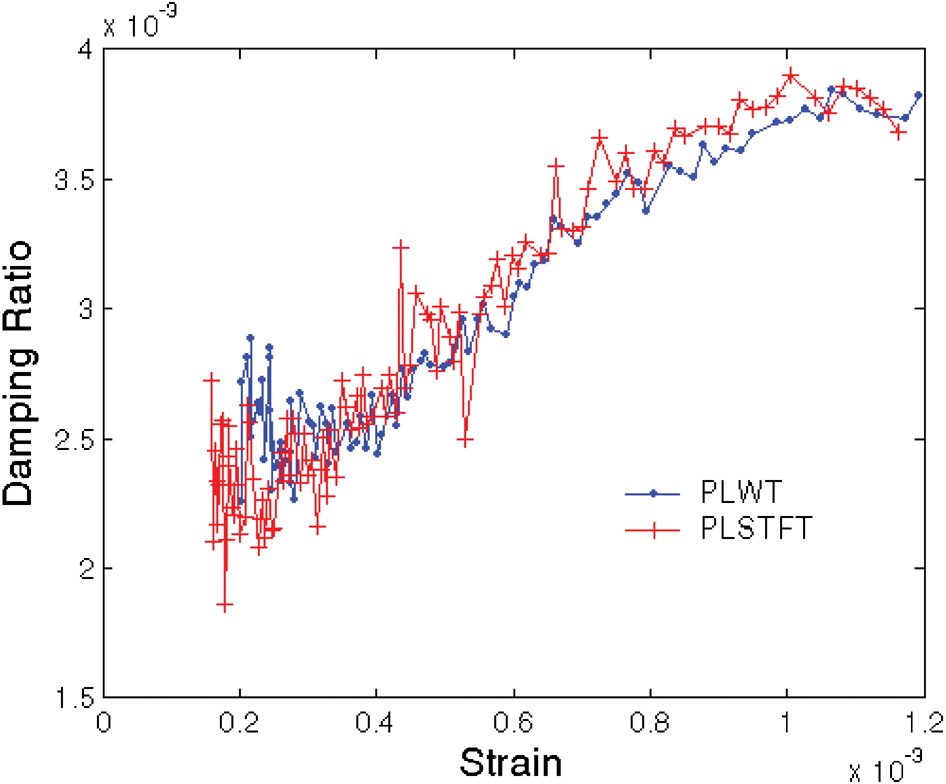
Relationship curve of damping ratio versus strain, Al–33Zn–6Si
It can be concluded from Fig. 9 that:
the relationship curves of damping ratio versus strain obtained by the PLWT and the PLSTFT methods are similar
the damping ratio of the researched alloy increases with increasing strain and appears nonlinear below the yield stress.
Conclusions
Two procedures for the estimation of nonlinear damping of alloy have been presented. One is the PLWT method, and the other is the PLSTFT method. Simulations show that the two methods are effective to compute damping from the free response signal of a system. Compared to the PLSTFT method, the PLWT method can give a better result, and it is more applicable to the nonlinear damping computation. The internal damping characteristics of the alloy Al–33Zn–6Si are researched in experiments. In order to study the damping characteristics accurately, the specimen with quasi-uniform stress is developed. The experimental procedure is based on the acquisition of the free response signal and enables the damping measurement simple. Experimental results show that the damping ratio of the alloy increases with the increasing strain amplitude, and appears nonlinear. The two methods presented in this paper are proved to be valid and feasible in the identification of nonlinear damping.