
Abstract
The plasma transferred arc technique has been used for the production of high nitrogen surfaces on 2205 duplex stainless steel substrates. Nitrogen was introduced into the melt using Ar+5%N2 and Ar+10%N2 gas mixtures. The nitrided surfaces are austenitic–ferritic and have a thickness of 1140±35 and 1650±31 μm respectively. The change of the austenite crystal lattice, due to the absorption of nitrogen, was determined by X-ray diffraction. Pin on disc tests showed that the wear resistance was increased. The corrosion in 3·5%NaCl and 1 N H2SO4 aqueous solutions was also slightly improved. Significant improvement was, however, observed in the pitting corrosion resistance of the nitrided surfaces, with regard to the 2205 duplex stainless steel substrate.
Introduction
Duplex stainless steels have a dual phase microstructure containing nearly equal amounts of austenite and ferrite. This class of materials exhibit the beneficial properties of both ferritic and austenitic stainless steels and have been found to be superior to them in terms of mechanical and corrosion properties. Critical components in the oil and gas, offshore and petrochemical industries are made from these alloys, since high resistance to corrosion is imperative1–3 in these applications.
It has been shown that nitrogen content affects strongly the microstructure and properties of duplex stainless steels. Nitrogen is an austenite (γ-Fe) stabiliser that occupies the octahedral sites in face centred cubic (fcc) lattice.4 It is an attractive alloying addition to stainless steels, due to the fact that it enhances their mechanical properties by interstitial solid solution strengthening5 and grain boundary strengthening (Hall–Petch effect),6 but it predominantly offers a remarkable improvement in their corrosion resistance, especially to pitting and intergranular corrosion.7–13 Corrosion resistance is improved by the presence of nitrogen in solid solution and although it delays the precipitation of carbides and other intermetallic phases,14 it may combine with chromium to produce chromium nitrides, which degrade the corrosion properties.15 Therefore, it is important to control the content and distribution of nitrogen in the microstructure of high nitrogen steels.
Nitrogen can be added to steel by several procedures. Pressure metallurgy is used in order to add nitrogen in liquid steel. The pressurised electroslag remelting process using Si3N4 slag under a pressure of 42 bar16 has been successfully used in the production of ingots of different grades. The arc slag remelting method is conducted under a pressure of 10 bar.17 For lower pressures (⩽4·5 bar), the plasma arc remelting technique has been used successfully.18 Nitrogen may also be introduced into a steel powder by diffusion or milling from nitrided powders.19,20 Solution nitriding is another method that enriches a subsurface zone of steel with nitrogen. Steels with sufficient nitrogen solubility were treated, in equilibrium with N2, at 1100–1150°C and 0·4–4 bar, for ∼24 h, to achieve a case depth of 3 mm.21
In the present investigation, the plasma transferred arc (PTA) technique was used in order to modify the surface of 2205 duplex (austenitic–ferritic) steels, by introducing nitrogen into the melt, using both Ar+5%N2 and Ar+10%N2 mixtures in the plasma and protective gas. The PTA alloying technique is advantageous for several reasons: the equipment may be portable and moved near the working site. On the other hand, the treatment may be applied strictly to the area where the wear or corrosion problem is situated and after the treatment, little machining, if any, is required. In the present study, the microstructure, wear and corrosion properties of the produced nitrided surfaces are investigated and discussed.
Experimental
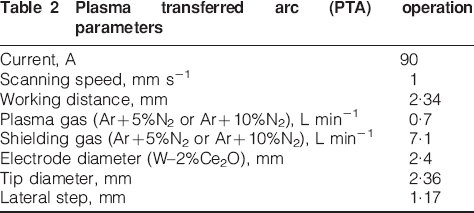
The chemical composition of the 2205 austenitic–ferritic stainless steel used as substrate material is presented in Table 1. Specimens in the form of plates (40×40×4 mm) were cut and polished with SiC abrasive papers down to 1200 grit. Afterwards, the specimens were cleaned and degreased with acetone, and they were placed on a copper plate and scanned with a PTA torch (PWA-3A; Thermal Dynamics, St Louis, MO, USA). The parameters of the process were chosen after preliminary tests in order to produce nitride free coatings of sufficient thickness and are presented in Table 2.
Chemical composition of duplex stainless steel substrate measured by mass spectroscopy

Plasma transferred arc (PTA) operation parameters
The microstructure of the nitrided surfaces was studied by scanning electron microscopy (SEM), equipped with electron dispersive spectroscopy microanalysis. X-ray diffraction (XRD) patterns were obtained using an X-ray diffractometer with Cu Kα (1·54056 Å wavelength) radiation. The absorbed nitrogen was measured by mass spectroscopy.
The microhardness of the nitrided surfaces was measured by an HMV-2000 Shimadzu tester. A Vickers indenter penetrated the cross-sections with a load of 100 g for 15 s. Ten indentations were made on each sample from which average hardness and standard deviations values were calculated. The measurements were carried out along the cross-section of the coatings in order to evaluate the possible variations of the hardness with depth.
Tribological tests were carried out on a pin on disc device at room temperature in the laboratory atmosphere, according to ASTM G99-95A standard. The relative humidity was constant throughout the experiments and it was ∼25%. Sliding velocities of the disc were set at 0·15, 0·30, 0·45, 0·60 and 0·90 m s−1 and applied loads were 4·9, 9·8 and 19·6 N. The sliding distance was 1000 m. The pins were Al2O3 spheres of 6 mm diameter. The dimensions of the tracks were measured with contact profilometry. The 2205 stainless steel substrate material was also tested as a reference material for comparison, in order to assess the wear behaviour of the nitrided layers.
Samples were also prepared for electrochemical corrosion tests in aqueous solutions of either 3·5%NaCl or 1 N H2SO4, the former representing a neutral environment (pH 6·8) and the latter representing an acidic environment (pH 0·3). Both solutions were open to air at room temperature. The corrosion parameters Ecorr and Icorr of the alloyed layers were electrochemically determined by cyclic polarisation experiments, using a scan rate of 0·5 mV min−1. EG&G flat cell was used with a saturated calomel electrode as a reference electrode, at room temperature, while a corrosion software from EG&G Princeton Applied Research was employed in the polarisation tests.
Pitting corrosion resistance of the specimens was further studied in 6%FeCl3.6H2O aqueous solution, as per ASTM G48 Method C. Specimens were weighed before and after each exposure for the measurement of corrosion susceptibility and the critical pitting temperature was determined. Optical microscopy was used in order to determine the pit depth. According to the standard, critical pitting temperature is defined as the temperature where the average pit depth is equal to ∼0·025 mm.
Results and discussion
Microstructure
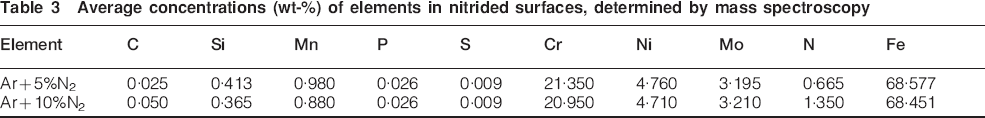
Figure 1 shows the cross-sections of the treated samples. The surfaces are sound, with no pores or cracks present. The thickness of the treated layer is 1140±35 μm for the samples fabricated with Ar+5%N2 (Fig. 1a) and 1650±31 μm for the samples fabricated with Ar+10%N2 (Fig. 1b). The higher penetration of the Ar+10%N2 mixture is due to the higher nitrogen content of the plasma gas, which improves the heat transfer from the arc to the metal bath. Nitrogen, as a diatomic molecule, decomposes to atomic nitrogen by absorbing energy from the plasma arc, which is further released to the bath during the inverse reaction.22 Mass spectroscopy measurements showed that nitrogen content is 0·65 and 1·35% for the samples fabricated with Ar+5%N2 and Ar+10%N2 respectively (Table 3). The heat affected zone between the nitrided coatings and the substrate is shown in Fig. 2. There was no evidence of intermetallic phases, such as sigma phase or nitrides in this zone, for both samples.
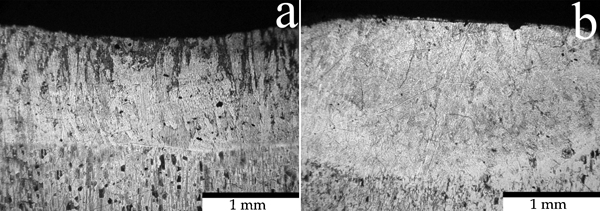
Cross-sections of nitrided surfaces fabricated with a Ar+5%N2 and b Ar+10%N2
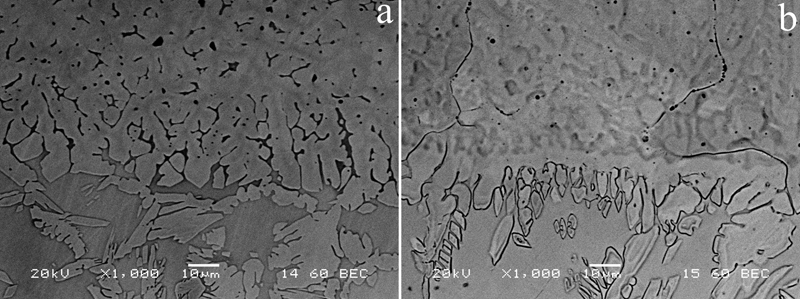
Detail of interface and heat affected zone of nitrided surfaces fabricated with a Ar+5%N2 and b Ar+10%N2
Average concentrations (wt-%) of elements in nitrided surfaces, determined by mass spectroscopy
Solidification behaviour of stainless steel liquid metal can be classified into four modes, designated as A, AF, FA and F modes, according to their microstructure.23 Usually, solidification mechanisms described in the literature for stainless steels, predict the solidifying mode with reference to the Fe–Cr–Ni ternary diagram or, as an alternative, using pseudo binary diagrams, such as the one shown in Fig. 3, and using the ratio (Creq/Nieq) of Cr and Ni equivalent weights.
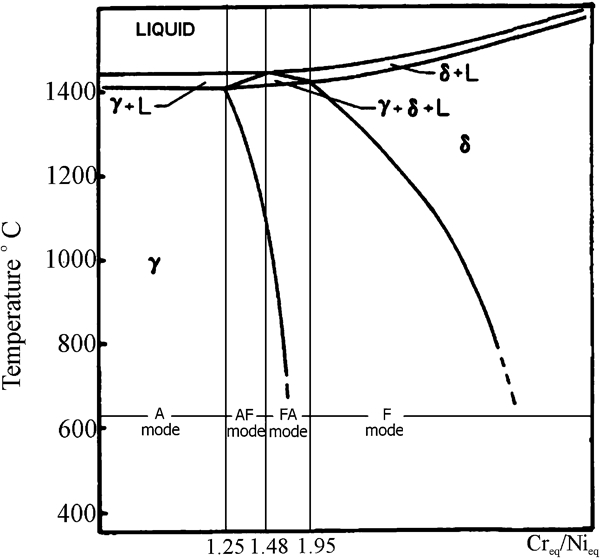
Prediction of solidification mode in stainless steels, using concept of Cr and Ni equivalent weights
In A mode, the liquid metal solidifies completely to austenite and no further transformation takes place during the cooling stage. For AF mode, austenite is the primary phase and ferrite solidifies from the rest of the melt. Solidification in FA mode welds is the inverse of this, ferrite being the leading phase and austenite solidifying from the rest of the melt. At lower temperature, the majority of the ferrite is further transformed to austenite. Finally, for F mode, weld metal solidifies completely to ferrite and in the case where the solidification enters in the δ+γ region; austenite is precipitated from the solid ferrite at lower temperatures.
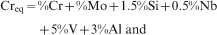
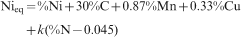
Many different formulae have been proposed for the calculation of Creq and Nieq, and it is noteworthy mentioning the disagreement concerning the coefficient of nitrogen in the Nieq formula, presented graphically in Fig. 4. DeLong24 studied the effect of nitrogen in 309, 310, 316 and 410 stainless steels and calculated the nitrogen coefficient as 30. DeLong's formulae for chromium and nickel equivalent weight percentages are


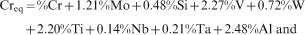
Values of coefficient of nitrogen used in formula of Nieq, as proposed in different investigations
Espy26 studied commercial stainless steel grades with 0·04–0·31% nitrogen and stated that the nitrogen effect as an austenite stabiliser decreases with increasing nitrogen content. He proposed the formulae
Finally, the Welding Research Council27 suggested in 1992, the equations


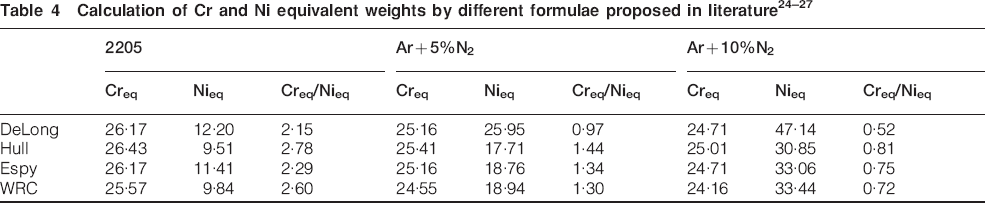
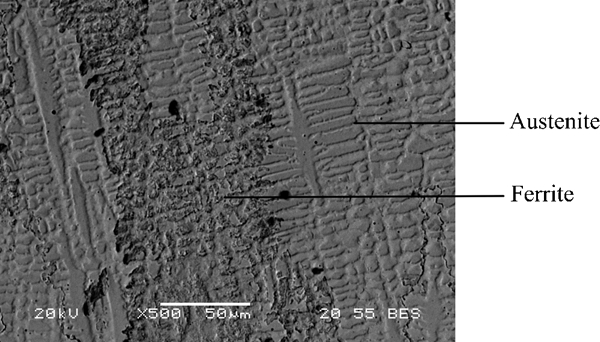
By inserting the calculated values of Creq/Nieq of Table 4 into the phase diagram of Fig. 3, it becomes evident that the surface fabricated with Ar+5%N2, with the exception of DeLong's formula, is predicted to solidify in AF mode. This is in agreement with the micrograph of Fig. 5, showing the typical microstructure of the modified layer, which consists of austenite, as well as of cellular and skeletal ferrite. As a matter of fact, during the primary solidification stage, austenite forms directly from the melt. As the solidification goes on, it reaches the three-phase L+γ+δ area of the phase diagram where cellular colonies of γ+δ appear among the primary austenite dendrites. The terminal solidification stage is the solid state δ→γ transformation. This transformation is controlled by diffusion and redistribution of γ and δ stabilisers between the two phases and it is incomplete because the diffusion is limited by the fast cooling process. Therefore, only some of the ferrite is transformed to austenite and the rest is retained as skeletal ferrite.
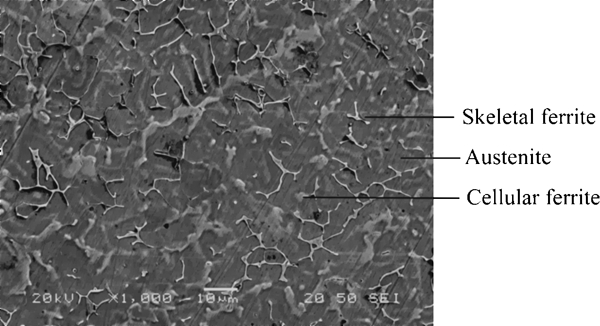
Typical microstructure of surface fabricated with Ar+5%N2
The modified surface fabricated with Ar+10%N2 is predicted by all formulae to solidify in A mode and its microstructure shown in Fig. 6 is in agreement with the prediction. The microstructure is almost completely austenitic; nevertheless, some minute grains of ferrite are present between the austenite dendrites, appearing as dark areas. In this case, the solidification started with separation of primary austenite dendrites, but due to strong segregation effects, the melt became rich in δ stabilisers, so that some δ-ferrite formed in the interdendritic spaces of austenite at the end of the solidification process.
Typical microstructure of surface fabricated with Ar+10%N2
XRD measurements
Figure 7 presents the XRD diagrams of the substrate and of the nitrided surfaces. Both nitrided samples (Fig. 7b and c) exhibit the γ-austenite and δ-ferrite peaks. The latter, in the case of the surface fabricated with Ar+10%N2, are very small but distinguishable. According to ASTM E975-95 and using the integrated intensity of the austenite and ferrite peaks of the XRD diagrams,22 the volume fraction of ferrite was found to be 46, 13 and 8% respectively, in the substrate and in the surfaces modified with Ar+5%N2 and Ar+10%N2 mixtures.
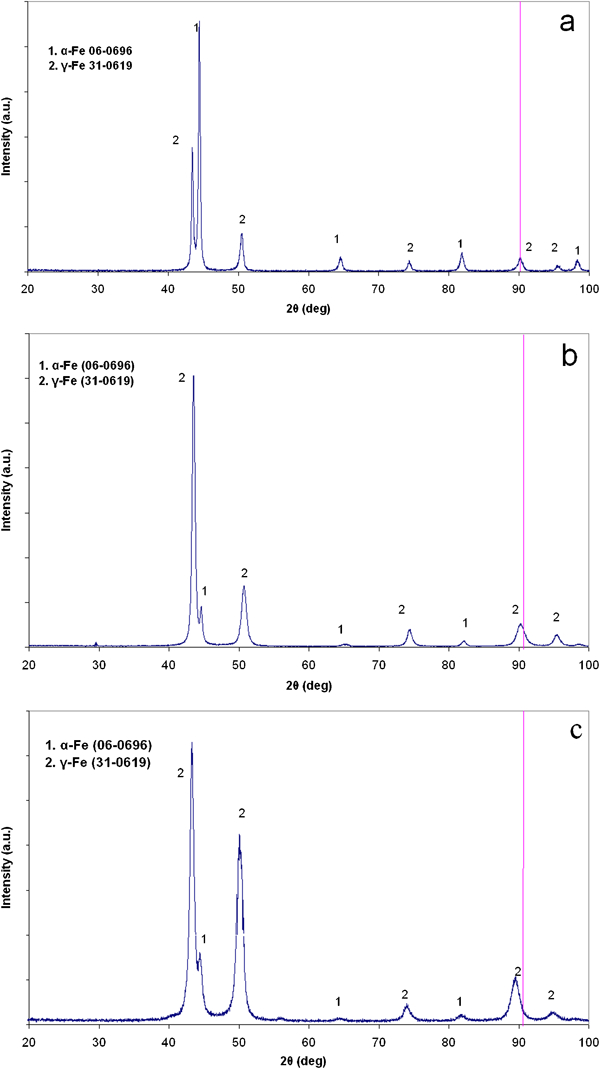
X-ray diffraction spectra of a 2205 duplex stainless steel substrate and of surfaces fabricated with b Ar+5%N2 and c Ar+10%N2
The (311) crystallographic plane distance was used in order to determine the lattice parameters of austenite for the 2205 duplex stainless steel substrate and for the nitrided surfaces. The experimental value of the d311 was calculated according to the Bragg's law using the angles of diffraction taken from the diffraction diagrams of Fig. 7. It was found that the lattice parameters of austenite was 3·602, 3·605 and 3·622 Å respectively for the substrate and for the surfaces modified with Ar+5%N2 and Ar+10%N2 mixtures. The change of the crystal lattice of austenite should be attributed to the combined effect of residual stresses from the thermal effect of the plasma transferred arc and of the presence of nitrogen in interstitial solution. It seems that most of the nitrogen was incorporated into the austenitic phase, as there is no displacement of the ferrite peaks from their original position.
Hardness
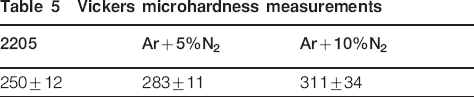
The average microhardness of the samples is presented in Table 5. The nitrided surfaces exhibit higher hardness than the 2205 substrate, due to interstitial solid solution strengthening by dissolved nitrogen. The standard deviation of the measurements is small; therefore, the microhardness does not have significant fluctuations with depth.
Vickers microhardness measurements
Pin on disc wear study
The friction coefficient and the wear rate of the nitrided surfaces against an Al2O3 counterbody, versus the sliding velocity for all applied loads, are depicted in Figs. 8 and 9 respectively. The values for the 2205 duplex stainless steel substrate against the Al2O3 pin are also given for comparison. The friction coefficient of the coatings does not change significantly with regard to the values obtained for the substrate, under similar load and sliding speed conditions. On the contrary, the corresponding wear rate is diminished by, at least, one order of magnitude. This is due to the solution strengthening effect of nitrogen28 in the fcc lattice, hindering the plastic deformation of the surface during sliding. For the same reason, the surface nitrided with Ar+10%N2 is slightly, but in all cases more resistant than the surface nitrided with Ar+5%N2.
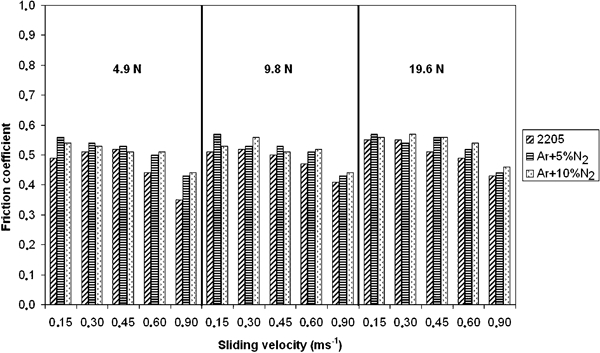
Friction coefficient of substrate and of nitrided surfaces against Al2O3 pin
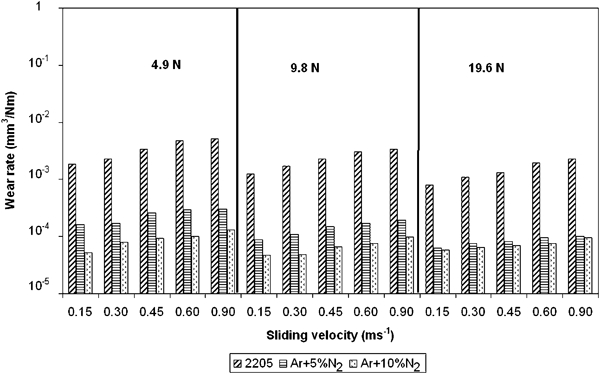
Wear rate of substrate and of nitrided surfaces against Al2O3 pin
As a matter of fact, the dominant wear mechanism is plastic deformation, as it becomes evident from Fig. 10, showing SEM images of the wear tracks for the applied load of 9·8 N and sliding velocity of 0·30 m s−1. Gouging of the wear track is clearly more deep and pronounced for the 2205 DSS substrate than for the modified surfaces.
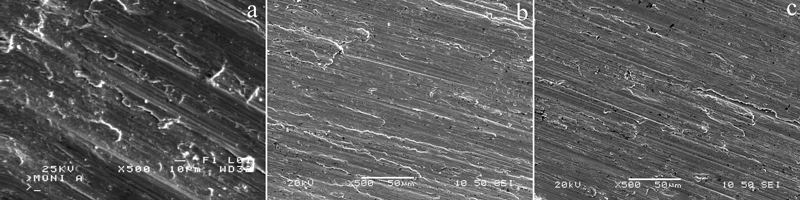
Wear tracks for applied load of 9·8 N and sliding velocity of 0·30 m s−1 of a 2205 duplex stainless steel substrate, b Ar+5%N2 and c Ar+10%N2 coatings
Corrosion properties
Cyclic polarisation scans in 3·5%NaCl and 1 N H2SO4
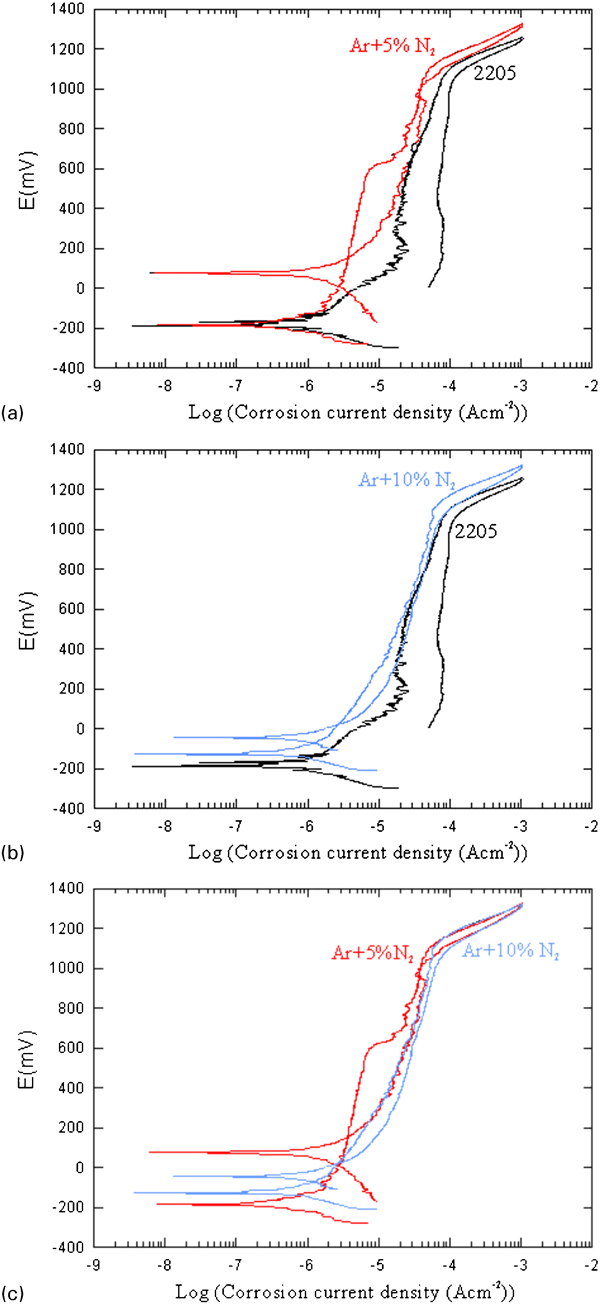
The cyclic polarisation curves of the 2205 duplex stainless steel substrate and of the nitrided surfaces in 3·5%NaCl are shown in Fig. 11. For reasons of comparison and clarity, the curves are presented in pairs. In the chloride solution, the duplex stainless steel reference material has a corrosion potential of −183·3 mV and a corrosion current density of 1·251 μA cm−2. After reaching a potential of ∼200 mV, the current density becomes almost stable due to the formation of a passive layer, which is presumably thick enough to protect the surface from further corrosion. It is well established in the literature29–34 that the passive film formed on the surface of Fe–Cr–Ni alloys consists mainly of chromium oxide with presence of molybdenum and low nickel content. Iron is selectively dissolved during passivation.34 The current density increases rapidly when the potential reaches the value of 1100 mV, indicating the onset of the transpassive region. During this stage, the passive film is disrupted by the synergistic effect of the localised attack of aggressive Cl− anions35 and the formation of chemical species in a valence state higher than that in the primary passive film.36 The breakdown of the protective passive film leads to the localised attack of the freshly exposed alloy surface by the Cl− anions.
Cyclic polarisation curves in 3·5%NaCl aqueous solution
The surface fabricated with Ar+5%N2 has approximately the same value of Ecorr as the 2205 duplex stainless steel substrate, whereas the surface fabricated with Ar+10%N2 exhibits a higher value of Ecorr. Furthermore, both surfaces exhibit lower corrosion current densities than the substrate (Table 6). The above observations lead to the conclusion that there is a slight increase in the corrosion resistance of the nitrided surfaces, compared to the substrate. The most pronounced effect is noticed on the size of the hysteresis loop between the forward and the reverse scan. The nitrided surfaces have a smaller loop, indicating a diminishing tendency to pitting corrosion. In addition, the anodic to cathodic transition (the potential where the surface becomes cathodic in the reverse scan) is nobler than the initial corrosion potential, showing that the protective film has not been completely dissolved. By comparing the curves of the nitrided surfaces in Fig. 11c, it is noticeable that the surface fabricated with Ar+5%N2 has a lower corrosion current density and a nobler anodic to cathodic transition than the surface produced with the use of Ar+10%N2. However, the latter has a smaller hysteresis loop, indicating the resistance of this sample against pitting corrosion.
Summary of Ecorr and Icorr values for studied surfaces
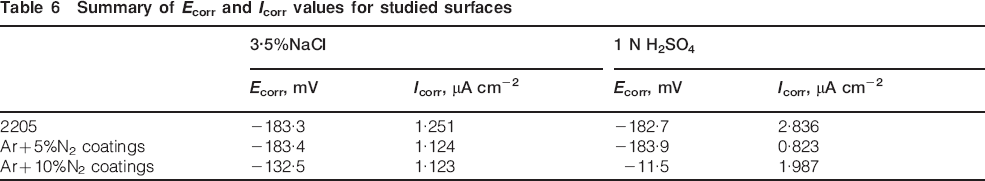
Figure 12 represents the cyclic polarisation curves in 1 N H2SO4 aqueous solution. For the substrate, the corrosion potential is −182·7 mV and the corrosion current density equals 2·836 μA cm−2. In this case, the passive region ranges from 100 to 700 mV. At higher potentials, the passive film suffers local breakdown but the surface repassivates, i.e. in the reverse scan, the current density is lower than in the forward scan. The anodic to cathodic transition is nobler than the initial corrosion potential, showing that the passive film is more resistant to this environment. In this acidic solution, the effect of nitrogen is more evident. The corrosion current density is lower for both nitrided surfaces. These surfaces maintain a stable passive film in higher potentials than the 2205 duplex stainless steel. The anodic to cathodic transition is nobler compared to the value of the 2205 duplex stainless steel, showing that the nitrided surfaces develop a more resistant passive film to this environment. In addition, the Ar+5%N2 surfaces have a lower value of current density during the anodic to cathodic transition than the Ar+10%N2, which implies a better repassivation.
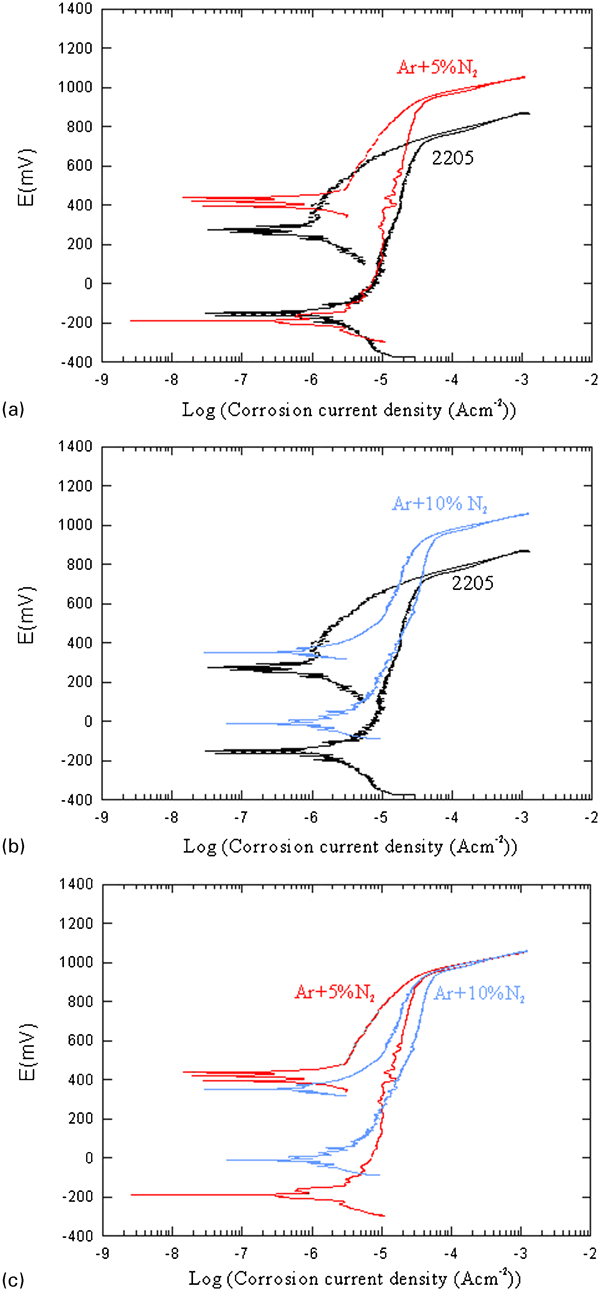
Cyclic polarisation curves in 1 N H2SO4 aqueous solution
Critical pitting temperature evaluation by immersion in 6% ferrous chloride solution
The critical pitting temperature (CPT) of the surfaces after immersion in 6%FeCl3.6H2O aqueous solution was found to be 53°C for the 2205 duplex stainless steel, 72°C for the surfaces produced with Ar+5%N2 and 76°C for the surfaces produced with Ar+10%N2. The increase of the CPT with higher nitrogen concentration is expected, as long as no nitrides or carbides are precipitated. As a matter of fact, neither intermetallic phases nor nitrides were detected in the modified surfaces, presumably due to their highly austenitic microstructure and to the high cooling rate after solidification. On the other hand, the effect of nitrogen on pitting corrosion resistance, although not fully clear yet, has been interpreted on the basis of two mechanisms:37
formation of ammonium ions increases the pH value inside the pits and inhibits the pit growth
concentrated nitrogen in the passive film or at the interface between the passive film and stainless steel stabilises the passive films.
The improvement of the pitting corrosion resistance in the modified surfaces of the present investigation may be predicted from the formula of the pitting resistance equivalent number (PREN),38 PREN = %Cr+3·3%Mo+16%N. In this respect, the original 2205 duplex stainless steel and the modified surfaces with Ar+5%N2 and Ar+10%N2 have PREN equal to 35·7, 42·5 and 52·4 respectively.
Conclusions
High nitrogen surfaces were produced on the surface of 2205 duplex stainless steel using the PTA technique. Nitrogen was introduced into the melt using Ar+5%N2 and Ar+10%N2 gas mixtures. The nitrided surfaces have a thickness of 1140±35 and 1650±31 μm respectively, and they are defect free. The microstructure of both surfaces is highly austenitic with nitrogen mostly dissolved in the austenitic phase.
The wear rate of the produced surfaces against an Al2O3 pin was one order of magnitude lower than the one corresponding to the substrate. The general corrosion behaviour, according to cyclic potentiodynamic tests, was slightly improved by the presence of nitrogen. Pitting corrosion resistance was, however, significantly improved.
Footnotes
Acknowledgements
The Hellenic State Scholarships Foundation (IKY) is gratefully acknowledged for financial support to Aikaterini Rokanopoulou.