
Abstract
The quasi-static fracture behaviour (J–R curves) of modified 9Cr–1Mo (P91) steel was studied. The J–R curves were established at 298, 653, 823 and 893 K, and fracture toughness J0·2 at 0·2 mm of crack extension was determined. The value of ∼J0·2 at 653 K was lower compared to that at 298 K followed by increases in J0·2 values at 823 and 893 K. The decrease in J0·2 at 653 K can be attributed to the influence of dynamic strain aging. At 893 K, a significantly higher (more than 200) J0·2 was observed, since plastic deformation of the net section, rather than crack growth, occurred in this condition.
Introduction
Modified 9Cr–1Mo (P91) steel is selected as the material for steam generator components of sodium cooled fast breeder reactors. Mechanical properties of this material, including fatigue and creep, have been extensively studied.1–4 The influence of thermomechanical treatments, chemical composition and heat treatments, including thermal aging, on the microstructure and the mechanical properties of this steel has also been investigated.5–10 Fracture behaviour of this steel has been found to be sensitive to the above factors.7–10 Studies on the quasi-static fracture toughness (J1C is the crack extension resistance under crack tip plane strain conditions) and, specifically, the J–R curves for P91 steel however have been limited. 11 11,12
In a previous study in the authors’ laboratory, the influence of long term aging on J–R curves for a P91 steel plate of 12 mm thickness was examined at test temperatures of 300, 653 and 803 K using 10 mm thick compact tension (CT) specimens.13 The validity of the J0·2 values for qualification as a thickness independent material toughness property JIc was examined in Ref. 13, and it was concluded that these values do not qualify as a thickness independent material property JIc. In view of these, further investigations were carried out on 20 mm thick specimens fabricated from another plate. In plain 9Cr–1Mo steel dynamic strain aging (DSA) has been reported14 to occur in the temperature range 523–723 K. The manifestations of DSA in tensile tests include serrations, negative strain rate sensitivity, a maximum or peak in variation of flow stress and workhardening rate with temperature and a ductility minimum.15 Previous investigations16–21 show varying effects of DSA on the fracture toughness of different materials. The possible effect of DSA on fracture toughness of P91 steel has been examined. Therefore, a campaign was taken up to establish J–R curves for the P91 steel at various temperatures in the range 298–893 K, which covers the operating temperature range.
Experimental
Material
The P91 steel plate of 24 mm thick was received after thermomechanical processing in normalised (1333 K for 60 min) and tempered (1053 K for 60 min) condition (NT). The chemical composition of the P91 steel is Fe–0·10C–0·41Mn–0·26Si–0·33Ni–0·018P–0·002S–9·27Cr–0·95Mo–0·21V–0·074Nb–0·013Al–0·044N (wt-). For metallography, the specimens were polished to fine diamond finish (∼0·5 μm) and etched with Vilella's reagent (45 mL glycerol+15 mL nitric acid+30 mL hydrochloric acid). Figure 1 shows the tempered martensite microstructure of the NT material.
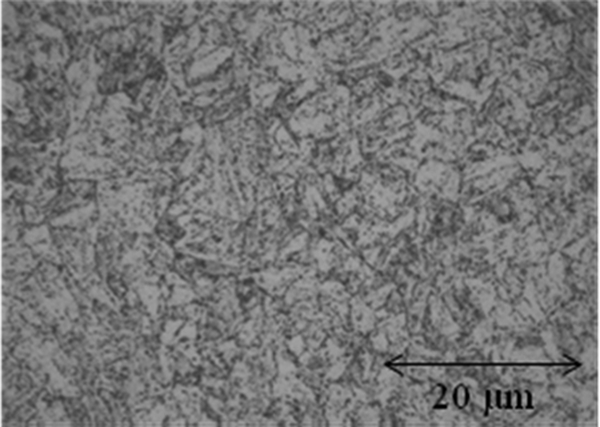
Microstructure of P91 steel showing tempered martensite
Tensile testing
Tensile tests were carried out on cylindrical specimens machined from the P91 plate having 28·6 mm gauge length and 4·0 mm diameter as per ASTM E822 standard at 298, 653, 823 and 893 K at a constant strain rate of 1·2×10−4 s−1. The fractured specimens were observed under scanning electron microscope (SEM) at magnifications of ×100 to ×500.
Fracture toughness testing
Compact tension specimens of 20 mm thick were fabricated in transverse-longitudinal orientation as per ASTM E399-9023 specification as shown in Fig. 2. The CT specimens were subjected to fatigue precracking at room temperature to obtain a sharp fatigue crack ahead of the notch using a resonant fatigue machine. The starting frequency of the load cycle was ∼106 Hz. The crack length at the end of precracking (initial crack length a0 for the fracture test) was targeted between 25 and 27 mm corresponding to an a0/W in the range of about 0·50–0·54, where W is the width of the specimen. The precracking was carried out in stress intensity factor K decreasing mode. An initial load in the range of 12–10 kN was employed and as the crack propagated stress intensity factor range ΔK ( = Kmax−Kmin) was gradually reduced such that the crack was grown at loads not exceeding (Pm) those prescribed by ASTM E1820.24
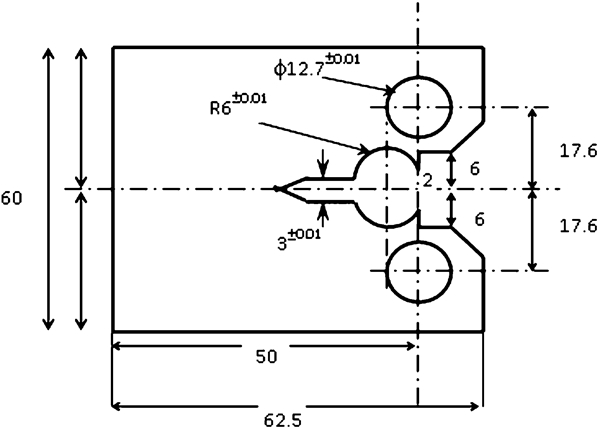
Schematic of CT specimen (all dimensions in mm)
Then, the test specimens were side grooved to 20 net depth (2 mm deep groove on either surface along crack growth path with 45° flank angle and 0·25 mm root radius) to restrict crack growth to the symmetry plane and to minimise the thumbnail crack growth. J tests were carried out using monotonic ramping at a constant stroke rate of 0·01 mm s−1 (strain rate of ∼10−4 s−1) in a 50 t servohydraulic machine, fully automated for test control and data acquisition. The load line displacement was monitored using high resolution crack opening displacement gages. For high temperature tests, the specimen temperature was held within ±1 K of the desired value. High resolution load P, load line displacement and crack length a data were recorded using the data acquisition software integrated with the test application. A suitably calibrated direct current potential drop (DCPD) device was used for online determination of crack length. The tested samples were held at ∼643 K for ∼30 min in order to heat tint the fracture surfaces to identify the crack extension regime in the fracture test. The samples were then pulled to fracture at a higher pulling rate at room temperature. The initial ao and final crack lengths af were optically determined using the nine-point average method prescribed in ASTM E1820, and it was verified that the crack length obtained from the DCPD are in close agreement with the optically measured values. The fracture surface was examined in SEM at magnifications of ×50 to ×1000 to understand fracture mechanisms and stretch zone width (SZW) features. The SZW was measured in SEM by nine-point average method at a magnification of ×100.
Results
Tensile test results
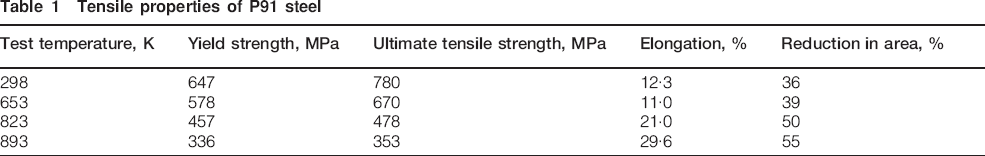
The strength–ductility values are mentioned in Table 1. The yield strength and ultimate tensile strength values decreased with test temperatures. The change in the per cent of elongation and reduction in area at 653 K was marginal compared to that at 298 K. At 823 and 893 K, an increase in elongation and reduction in area was observed. The fractographs of tensile tested samples are shown in Fig. 3. At all temperatures, the dimpled appearance of the fracture surface indicates ductile fracture by void nucleation and growth. With increasing test temperature, the number of larger cavities increased, indicating faster growth and coalescence of voids.
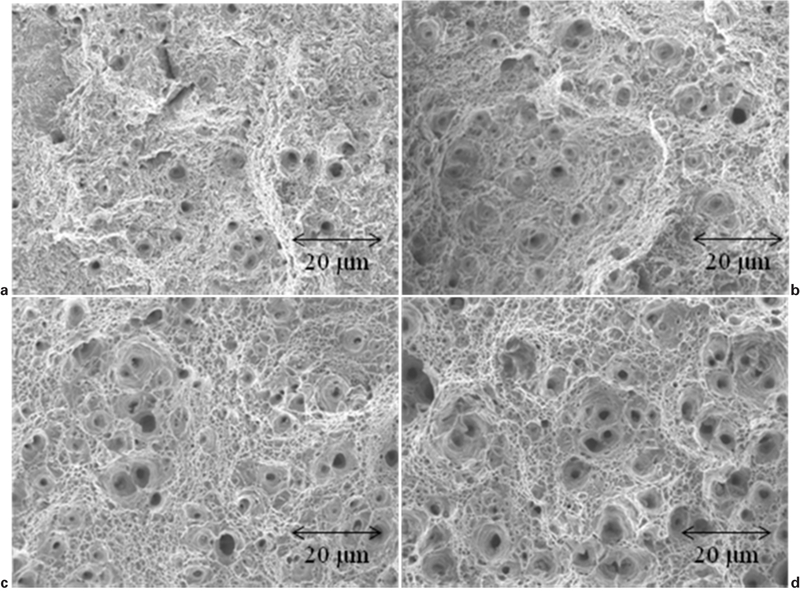
Fractographs of P91 steel tensile tested at a 298 K, b 653 K, c 823 K and d 893 K
Tensile properties of P91 steel
Fracture toughness test results
The J values were computed following ASTM E1820 using equations (1)–(5) (Section A2·4·2) as shown below

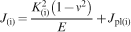


The J–R curves obtained at different temperatures are depicted in Fig. 4. For the initial crack blunting line, ASTM E1820 specifies, M = J/Δaσf = 2, though for high workhardening materials, a value as high as four is allowed, provided that it is justified by the data. In addition, the French code for design and construction of nuclear islands, RCC-MR,25 suggests a value of M = 4 for steels. Here, a value of four has been used for all the analyses. The values of J0·2 determined as the intersection of 0·2 mm offset (from blunting line) with the J–R curves are mentioned in Table 2. The SZW determined from SEM observations are mentioned in Table 2. Also mentioned in Table 2 are the J values (JSZW) determined (from Fig. 4) corresponding to the SZW values. The J0·2 value at 653 K was lower compared to the value at 298 K. An increase in J0·2 value occurred at 823 K compared to 653 K. The variation in JSZW values with temperatures is similar to that of J0·2 values.
J–R curves for P91 steel tested at a 298 K, b 653 K, c 823 K and d 893 K
Fracture toughness results of P91 samples
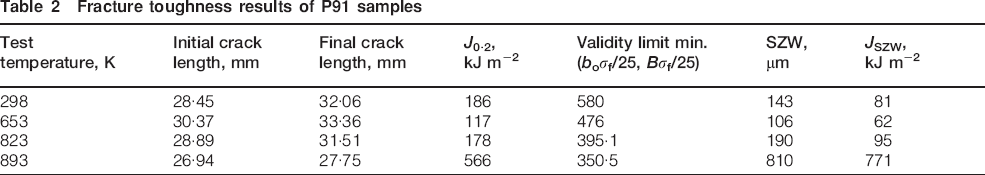
A very high value of J0·2 (566 kJ m−2) was observed at 893 K. The J0·2 value increased considerably more than 200 of that at 298 K. Similarly, the increase in JSZW was more than 400 compared to the value at 298 K.
The tearing resistance dJ/da values at different crack extensions are shown in Fig. 5. The dJ/da values were the lowest at 653 K, and the values were similar at 298 and 823 K. At 893 K, the dJ/da values were comparatively higher than those at other test temperatures and showed nearly a constant trend (Fig. 5).
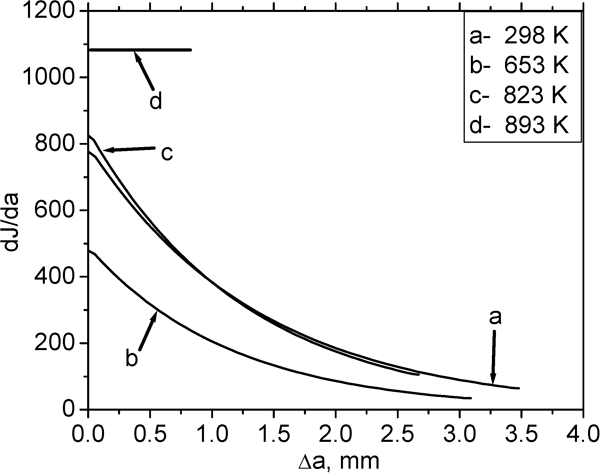
Tearing resistance comparison for P91 steel
The elastic–plastic fracture toughness JIc is a thickness independent material toughness property that corresponds to the highest crack tip constraint conditions characterised by the Hutchinson–Rice–Rosengren crack tip fields. The ASTM E1820 indicates that for qualification of J0·2 as elastic–plastic fracture toughness JIc, JIc = J0·2⩽min. (b0σf/25, Bσf/25). Applying this criterion, for P91 steel, the maximum allowable values for J0·2 to qualify as JIc are mentioned in Table 2. Thus, the J0·2 values do qualify as JIc for 298, 653 and 823 K, but not for 893 K, being higher by a factor of more than 1·6. A detailed SEM (fractography) study was conducted to understand the effect of temperature on fracture toughness.
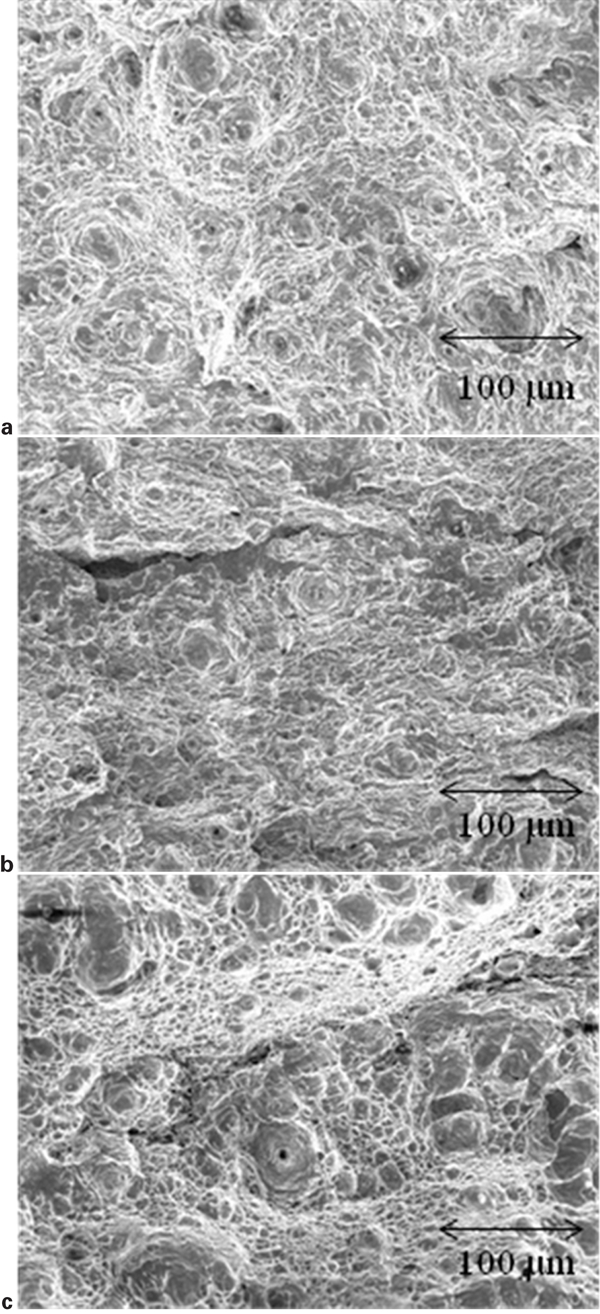
The macroview of fracture surfaces is shown in Fig. 6. The fractographs shown in Figs. 7 and 8 reveal precracked, stretched zone (SZ) and J tested regions. The width of SZ decreased at 653 K (Fig. 7b) compared to that at 298 K (Fig. 7a). An increase in SZW was observed at 823 K (Fig. 7c). At 893 K, for 0·81 mm of crack extension, the average SZW is 0·8 mm. Figure 8 shows that SZ and crack growth occurred in the same region. The fractographs for specimens tested at 298–823 K (higher magnifications) from J tested regions shown in Fig. 9 revealed dimples of varying sizes, with a large number of finer dimples and few large sized dimples. Figure 9b revealed both dimples and few cleavage features at 653 K. At 823 K, the presence of dimples of varying sizes was observed as shown in Fig. 9c.
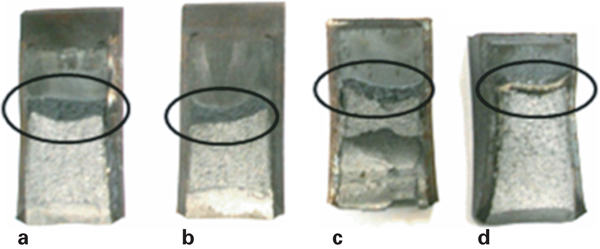
Macroview of P91 steel samples tested at a 298 K, b 653 K, c 823 K and d 893 K
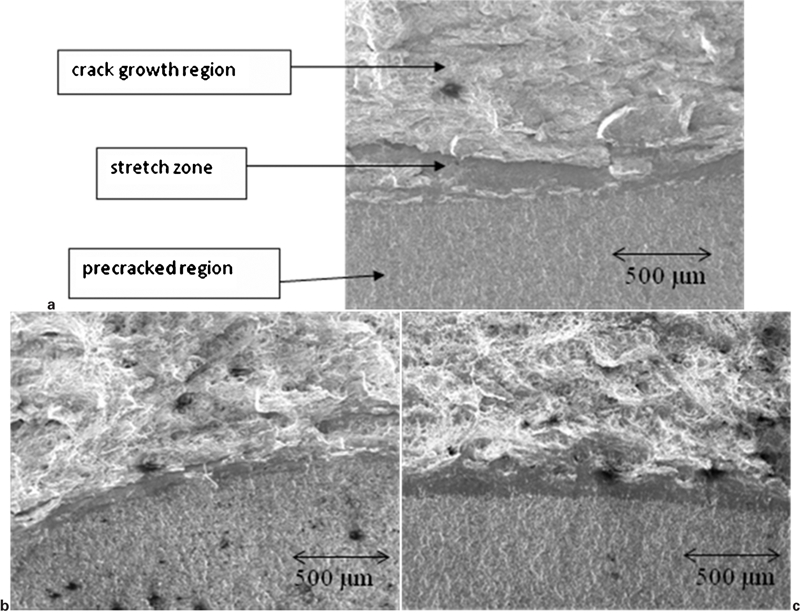
Fractographs of P91 steel samples tested at a 298 K, b 653 K and c 823 K
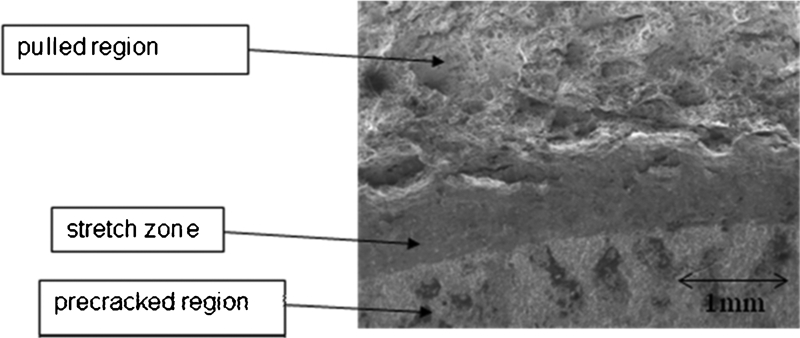
Fractograph of P91 steel samples tested at 893 K
Fractographs of P91 steel samples (J tested regions) tested at a 298 K, b 653 K and c 823 K
Discussion
The important observations in the present study are:
the differences in J0·2 values (J–R curves) from those in the previous study13
the decrease in J0·2 at 653 K.
These are further discussed below.
First, the J–R curves in the present study have been determined from single specimen (DCPD) method, whereas multiple specimen method was used in previous study. The reported13 J0·2 values at 300, 653 and 803 K were 290, 290 and 700 kJ m−2 respectively. In the present study, the J0·2 values at 298 and 653 K are lower than those reported previously. The validity of the J0·2 values for qualification as a thickness independent material toughness property JIc was examined, and the 20 mm thick CT specimens in the present study satisfied the criterion at 298, 653 and 823 K. However, the 10 mm thick CT specimens in the previous study did not satisfy the criterion. In the present study, at 893 K, the J0·2 value (566 kJ m−2) did not satisfy the thickness independent criterion. The NT material in the previous study13 exhibited pop-in crack extension at 653 K, whereas in the present study, it was not observed.
Second, the decrease in J0·2 at 653 K in the present study was followed by the increase in J0·2 at 823 and 893 K. In the previous work,13 pop-in crack extension was observed in the NT material tested at 653 K, which was possibly due to DSA, however, with no decrease in J0·2 value. In the present study, a decrease in the J0·2 value at 653 K along with a decrease in SZW (Table 2) clearly indicates a loss in toughness at this temperature. This combined with the observation that there is a decrease (Table 1) in tensile ductility (per cent of elongation), though marginal, points to the possible role of DSA.
Many austenitic and ferritic steels exhibit serrated flow at intermediate temperatures, which has been attributed to DSA.14,15,26–28 The temperature range in which this is observed depends on the strain rate and composition of the alloy. Dynamic strain aging was manifested by serrations in stress–strain curves in P91 grade steels28 containing different (0·4–1·8 wt-) Si contents in the temperature range 298–623 K for strain rates of 10−2, 10−3 and 10−4 s−1. For all the grades, a plateau in strength and a minimum in the ductility were observed in the temperature range of 423–673 K. In the present investigation, a clear plateau in the variation in strength with temperatures could not be observed, since the test temperature intervals were not close enough. However, a decrease in ductility was evident at intermediate temperature of 653 K, at which a decrease in toughness J0·2 was also observed.
In the present investigation, serrations were not observed in the stress–strain curves. However, it may be noted that the absence of serrations in stress–strain curves does not rule out the occurrence of DSA. For SS 316, even when the stress–strain curves do not exhibit serrations, other indications of DSA, namely, yield point transients on strain rate jumps29 and anomalies in workhardening under tensile29 and cyclic30 loading conditions, have been observed. Similarly, in low cycle fatigue tests on P91 steel at temperatures in the range 773–873 K, Nagesha et al.31 have observed that the absence of serrations need not necessarily rule out DSA.
Previous investigations16–21 show varying effects of DSA on the fracture toughness of different materials. Murty et al.16–18 have reported decrease in fracture toughness in commercial steels due to DSA, while a beneficial effect of DSA on fracture toughness J1C has been reported for Armco iron.19 Kim and Kim 20 20,21 reported 30–40 decrease in the initiation toughness Ji and dJ/da values in the DSA region compared to room temperature values for a grade SA 106 piping steel. However, the influence of DSA on J1C was not observed in A516 grade steel,32 as the toughness was observed to decrease continuously with test temperatures. These steels32 were tested by unloading compliance method (ASTM E1820). These differences can be explained by the variations in chemistry, test temperatures and influence of testing method. Kang and Kim33 observed that the DCPD method is more sensitive to changes in crack initiation toughness induced by DSA than unloading compliance method. This is consistent with the comparison between the observations in the present and previous work13 presented above. While DCPD method was used in the present study, the previous work13 used multiple specimen method, which is less sensitive as far as J0·2 determination is concerned. In the present investigation, the decrease in toughness at 653 K compared to 298 K can be inferred as the manifestation of DSA.
At 823 and 893 K, an increase in J0·2 was observed. This can arise from the absence of DSA in this temperature range, which is beyond the DSA regime (298–623 K) reported for P91 steels,28 and creep effects. It may also be noted that at 893 K, an anomalously high value of J0·2 was observed. Similar observations were made at 803 K for 12 mm thick P91 plate,13 and it was suggested that at these temperatures, C* (creep crack growth parameter) rather than J would be the more appropriate parameter to describe crack growth. However, it may be noted that at 893 K in the present study, the crack did not grow beyond blunting; the crack extension recorded and the J–R curve were nearly linear. Thus, plastic deformation of the net section rather than crack growth occurred in this test. Further investigations are required at various strain rates and temperatures (within DSA regime) to elucidate the combined effect of these factors on fracture toughness properties.
Conclusions
The quasi-static fracture behaviour (J–R curves) of modified 9Cr–1Mo (P91) steel was studied. The J–R curves were established at 298, 653, 823 and 893 K, and fracture toughness J0·2 at 0·2 mm of crack extension was determined. The fracture toughness J0·2 at 653 K was lower compared to that at 298 K followed by increases in J0·2 values at 823 and 893 K. The decrease in toughness at 653 K can be attributed to the influence of DSA. At 893 K, significantly higher (more than 200) toughness was observed, since plastic deformation of the net section, rather than crack growth, occurred in this condition.