
Abstract
Owing to the complicated three‐dimensional geometry and tool design, mass production of precision spiral bevel gears using conventional forging technology is impeded by a number of quality issues. Cold rotary forging, an innovative incremental metal forming process, has great potential to make up for the present situation owing to its flexibility and low tool load requirement. In the present study, the feasibility verifying the cold rotary forging process of a spiral bevel gear has been carried out via the finite element (FE) method instead of extensive and expensive ‘trial‐and‐error’ experiments. A three‐dimensional rigid plastic FE model was developed to simulate the cold rotary forging process of a spiral bevel gear from a simple workpiece to a complicated product under the DEFORM‐3D software environment. On the basis of this proposed FE model, the workpiece geometry was optimised in order to obtain the low damage risk and forming load requirement. Subsequently, the distribution and variation laws of different field variables, such as flow velocity and strain, were thoroughly investigated. The results of this research not only revealed the deformation mechanism of cold rotary forging of a spiral bevel gear, but also provided valuable guidelines for further experimental studies.
Introduction
Spiral bevel gears, as an indispensable element for momentum transfer between intersection axes, have been widely applied in automotive, electronic, aeronautical and astronautical industries owing to their high contact ratio, smooth transmission and excellent carrying capacity. To date, the overwhelming majority of spiral bevel gears are machined from blanks through hobbing followed by a finishing operation. These operations are technically demanding, and they produce large quantities of metal chips as waste. Consequently, precision forging, or the near net shape cold forging technique, has become increasingly popular. Nevertheless, due to the complex shape, complicated tool design and high load requirements, many of the new components, such as spiral bevel gears, have raised a formidable challenge to the current precision forging technology beyond its current level of sophistication. To satisfy the urgent requirement, there is a renewed interest in incremental forming, especially rolling type incremental forming processes.1
Cold rotary forging, as an innovative incremental metal forming process, is widely used for manufacturing of engineering components such as discs, rings and gears.2 – 5 In comparison with conventional forging technology, cold rotary forging has the predominant advantages of minimum material waste, high dimensional accuracy, lower level of noise and vibration, good surface finish and better mechanical properties of products. Owing to its inherent advantages and wide application prospects, investigating the cold rotary forging process has been receiving the close attention of researchers in many companies and institutions. Several researchers have conducted experimental and theoretical analysis in the rotary forging of cylindrical and ring workpiece. Most of these studies have concentrated primarily on measuring the pressure distribution in the contact area, 6 6,7 calculating and verifying the power parameters8 – 10 and analysing the metal flow.11 – 14 Although experimental and theoretical study is usually necessary, it is difficult to obtain the detailed information such as material flow characteristics during the forming process; meanwhile, the experimental cost is huge. By contrast, the increasingly popular finite element (FE) based numerical simulation is an effective tool to predict the material flow characteristics and interior field variable distributions, especially for complicated metal forming processes like cold rotary forging. In recent years, several researchers have attempted to use the FE method to analyse the cold rotary forging process. Wang et al. 15 developed a three‐dimensional (3D) rigid plastic FE code in the FORTRAN language to analyse the cold rotary forging process of a ring workpiece. Hua and Han16 – 20 adopted the 3D elastic–plastic dynamic explicit FE method to reveal the deformation mechanism of cold rotary forging by exploring the effects of the main processing parameters on the process.
All of these research results provide a significant basis for better understanding the deformation characteristics and mechanism of the cold rotary forging process. It should be noted, however, that all of these studies are based upon cylindrical or ring workpieces, the boundary conditions of which differ greatly from that of complicated rotary formed parts, inevitably suffering from a lack of practical significance. Therefore, the foregoing research findings cannot be utilised to guide he present work directly, otherwise there will be significant errors.
Consequently, the aim of the current work is to perform the numerical simulation of the cold rotary forging process of a spiral bevel gear based on the theory of rigid plastic FE method by FE software DEFORM‐3D. Through simulation, an optimised workpiece geometry is recommended and the deformation mechanism of cold rotary forging of a spiral bevel gear is revealed. The results of this research not only verify the feasibility of this process, but also provide sufficient guidelines for further experimental studies, including tool design and forming equipment selection in cold rotary forging of a spiral bevel gear.
Description of cold rotary forging process of spiral bevel gear
The working principle of the cold rotary forging press is shown in Fig. 1. The main difference between a rotary forging press and a hydraulic press is that the upper die is conical die which can oscillate around a vertical machine axis in the cold rotary forging press. Between the axis of the upper die and the machine there is an inclination angle γ. As can be also seen from Fig. 1, the contact area exhibits a very complex geometry shape due to the local contact between the upper die and the workpiece. During the cold rotary forging process, the upper die continuously oscillates around the vertical machine axis. Simultaneously, the lower die pushes the workpiece vertically at a constant feed rate v so as to cause it to be subjected to axial compression. Under the action of the oscillation of the upper die and the axial feed of the lower die, the workpiece is pressed repeatedly for several times, ultimately the desired gear shape will be completed perfectly.
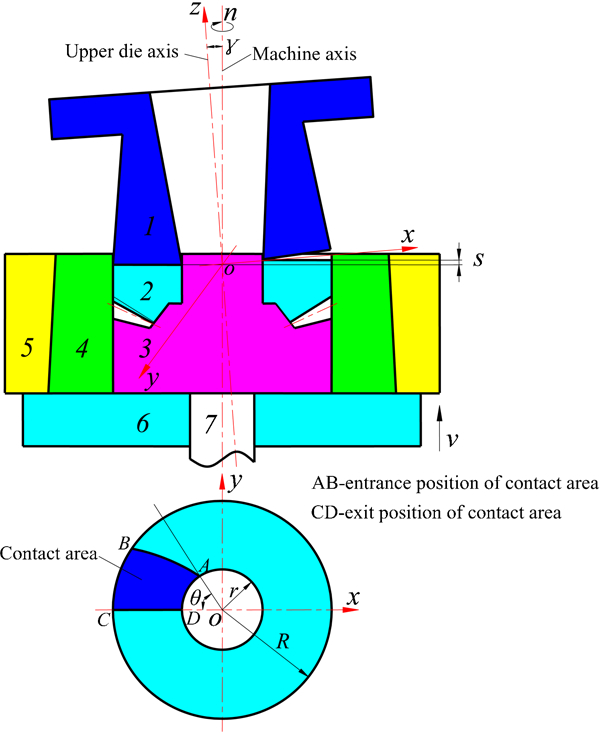
Schematic diagram of cold rotary forging of spiral bevel gear: 1, upper die; 2, workpiece; 3 die cavity; 4, lower die; 5, die holder; 6, lower die base; 7, ejector rod
From the above description, it can be seen that cold rotary forging is a complex metal forming process under coupled effects of multiple factors which cannot be settled satisfactorily only by using the analytical or experimental method. By contrast, numerical simulation has incomparable advantages, in that it can accomplish the omni‐directional virtual simulation and then obtain the exhaustive historical information in the forming process. In order to produce qualified spiral bevel gears using the cold rotary forging process, it is thus imperative to establish a sound 3D FE model to investigate and understand this process.
Finite element modelling simulation procedures
The cold rotary forging process by its nature, like other incremental forming processes, is exceptionally difficult to model because of its non‐linearity in geometry and boundary conditions. Consequently, modelling of the cold rotary forging process is inherently very time consuming and demands large computational resources compared with other forming processes. In order to realise the simulation of the cold rotary forging process of a spiral bevel gear, it is imperative to seek an efficient and competent FE software with unique and robust features to model this process. Moreover, during the cold rotary forging process, the plastic deformation is so large that the elastic deformation can be ignored by comparison. Based on the above analysis, the rigid plastic FE code DEFORM‐3D, which is specifically designed to analyse bulk plastic deformation, was adopted owing to its effective algorithm for numerical simulation of the forging process.
Geometry models and meshes
The spiral bevel gear used as a component of a mini automobile transmission is taken as an example, whose parameters are listed in Table 1. As the basis of die cavity design and quality certification for forgings, its forging drawing and geometric configuration are shown in Fig. 2.
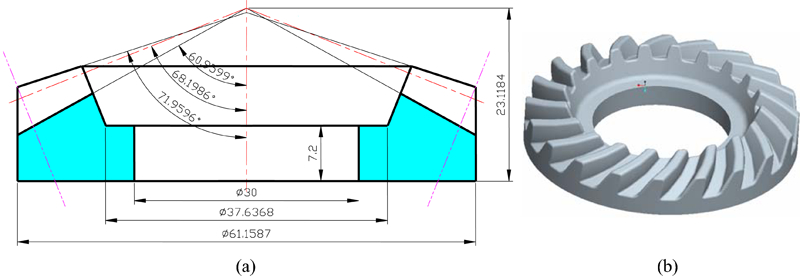
a cold forging drawing of product (unit, mm) and b its geometric configuration
Parameters of specified spiral bevel gear
According to the practical geometry shape and dimensions, 3D entity model of the workpiece and dies were established with the aid of general CAD software Pro/E and stereolithography model format files were loaded in DEFORM‐3D by its preprocessor. For convenience of assembly and modelling, the 3D FE model of rotary forging of a spiral bevel gear was simplified without influence on the result, as shown in Fig. 3. For the sake of decreasing computer CPU time, both the rotary forging dies are considered to be rigid. Tetra elements with four nodes are used to discretise the workpiece. As shown in Fig. 3b , the element size is improved through a finer mesh density corresponding to the forming areas of complicated gear shape with the intention of increasing accuracy and resolution of geometry and field variables such as stress, strain and damage that arises there. The mesh of the workpiece results in 150 000 elements and 33 000 nodes; these numbers are sufficient to ensure convergence. In order to ensure continuity of contact as nodal forces transfer from one element to the next and to reduce severe mesh deformation, a very small and appropriate time step of 0·025 s/step is chosen after several trials. During the forming process, the remeshing is automatically calculated in order to conveniently handle the remeshing of the workpiece when element distortion becomes excessive.
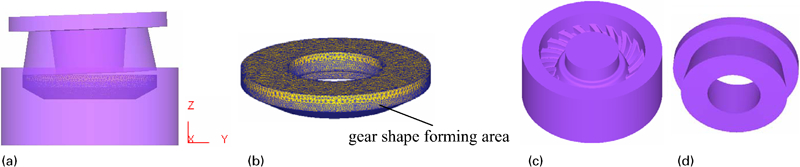
Three‐dimensional FE model of cold rotary forging of spiral bevel gear
Material models
The workpiece is assumed to be non‐linear strain hardening and plastic that ignores elastic deformation. The relationship of the flow stress with the effective strain is expressed in Hollomon–Ludwik form


Mechanical properties of workpiece
Boundary conditions and process parameters
Boundary conditions for an incremental, interactive simulation specify how the boundary of an object interacts with other objects and with the environment. The boundary contact conditions among the objects (workpiece, upper die and lower die) are expressed by means of contact nodes. During the process, the contact nodes are automatically drawn. Contact between the workpiece and dies using shear friction, which is used mostly for bulk forming simulations. The frictional force in the model is defined as
Processing parameters for simulation of cold rotary forging
Results and discussion
Optimisation of workpiece of spiral bevel gear
Currently, in the forming industry, workpiece geometry plays a critical role in the quality of finish forgings. The optimum geometry can be determined through FE simulation instead of extensive ‘trial‐and‐error’ experiments which are very costly. The schematic of workpiece is shown in Fig. 4, where D1, D2, D3, D4, H1, H2 and β are geometry parameters. Among these seven parameters, D1, D2, D3 and β are constant depending upon die geometry, whose values equal to 61 mm, 29 mm, 37·6 mm and 68·1986°, respectively. Other parameters are variables restricted by the volume constancy condition. The five designs are taken into account and the parameters are listed in Table 4. Besides, Fig. 5 illustrates the relative position of the initial workpiece and the lower die for different designs.
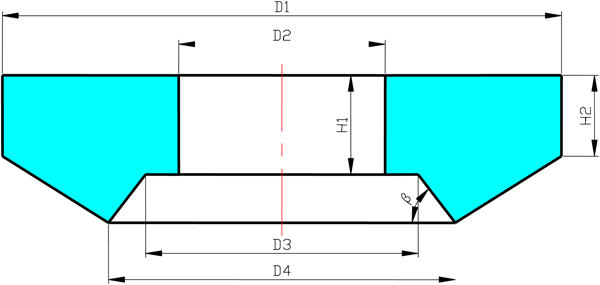
Schematic of workpiece
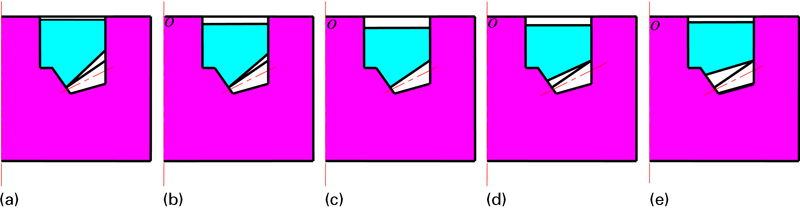
Relative position of workpiece and lower die for different designs
Variation of shape variables, mm
Influence of workpiece geometry on damage distribution along dedendum
(Dedendum is the depth of a tooth space below the pitch line. It is normally greater than the addendum of the mating gear to provide clearance. The addendum is the distance between the top land of the gear tooth and the pitch circle).
In many metal forming processes, it is frequently observed that ductile damage occurs by the appearance of surface or internal microscopic cracks. The damage factor can be used to predict fracture in cold forming operations. The damage factor increases as the material is deformed. At any time during the cold rotary forging process, only a small portion of the product is actually being formed under the local and heavy load, resulting in the formation of high strain localisation zones and consequently, the origination of internal or surface microdefects in gear shape areas, especially in the dedendum areas. Therefore, the risk of fracture in these areas correspondingly increases. Moreover, the different forming characteristics of convex and concave sides may occur as a result of the asymmetry of gear geometry. For these reasons, it is extraordinarily necessary to investigate the damage distribution along the dedendum.
With the point tracking method, detailed investigation of the effect of workpiece geometry on the damage distribution along two particular lines was conducted. The first line (line A) is located in the dedendum of convex side as shown in Fig. 6a , whose starting point and end point are in the small‐end and large‐end dedendum areas respectively. It can be seen from this figure that the workpiece geometry has a great influence on the damage located near the small‐end and large‐end dedendum areas. The damage factors of the small‐end dedendum are higher than those of the large‐end dedendum for design 1 and 2, and that of design 2 is the largest (D≈0·18) among the five designs. Nevertheless, the damage distribution along line A for the other three designs is quite different, i.e. their damage factors of the large‐end dedendum are higher than those of the small‐end dedendum, and that of design 3 is the largest (D≈0·26) among all designs, significantly greater than those of design 4 (D≈0·16) and design 5 (D≈0·09). The second line (line B) is the one passing through the dedendum of concave side as indicated in Fig. 6b . The trends of the damage distribution along this line are much the same as those presented along line A for different designs. However, totally different from the first line, the damage factor of the large‐end dedendum (D≈0·20) along line B for design 3 is higher than that of the small‐end dedendum (D≈0·15).
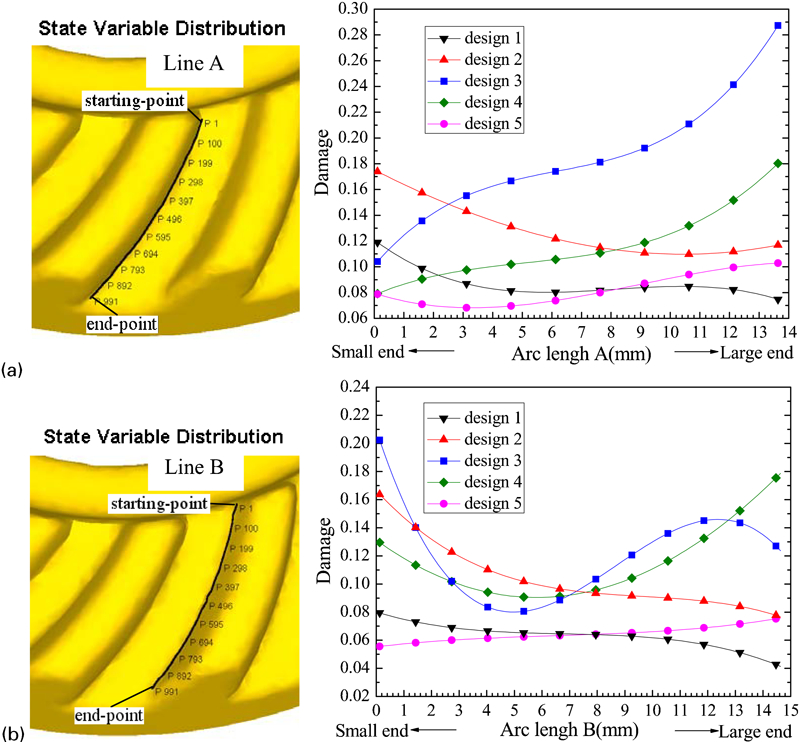
Damage distribution along two particular lines of dedendum
For a better evaluation of the different workpiece designs, the maximal damage factors of the dedendum are examined as shown in Fig. 7. It can be easily observed that the maximaum damage locating in the dedendum of design 3 is the largest in the five designs, that the maximum damage of dedendum in convex side is higher than that in concave side for all designs and that the disparity between them is the largest for design 3, less for designs 1 and 5, and the least for designs 2 and 4.
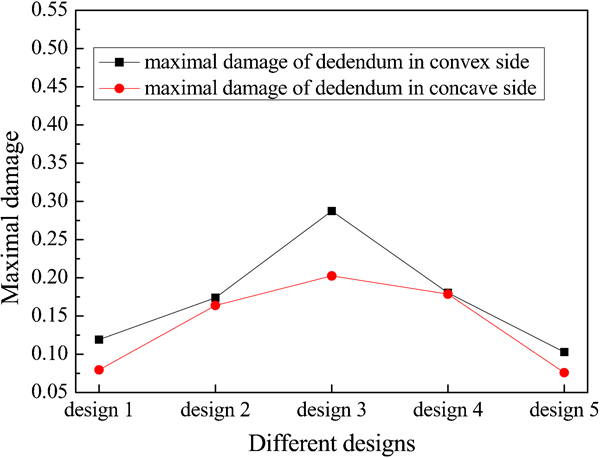
Comparison of maximal damage along dedendum in convex side and concave side
The results not only demonstrate the differences of forming characteristics between convex and concave sides, but also confirm the great influence of workpiece geometry on the damage occurrence for the cold rotary forging process of a spiral bevel gear.
Influence of workpiece geometry on axial forging force
Forming load is very significant for accurate design of dies, reasonable choice of equipment and proper determination of process specification. Figure 8 shows the variation curves of axial forging force versus stroke of lower die for different designs. For convenience of a more intuitive description of these curves, some typical corresponding views of gear formation are added. As shown in Fig. 8, all of these curves present a similar variation tendency, which are able to be divided into three stages: local upsetting, major tooth filling, and complete die filling.
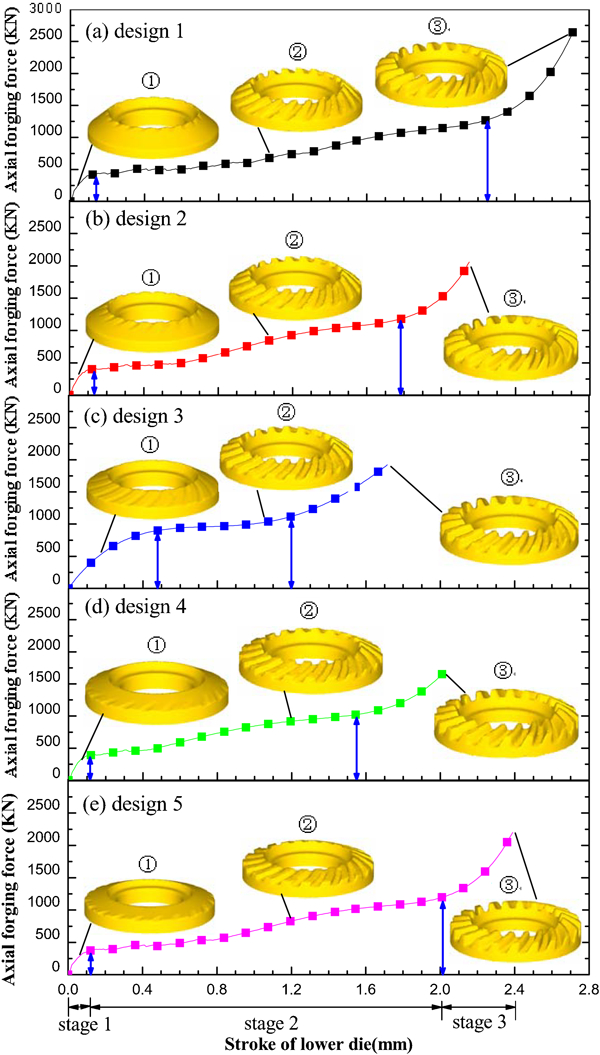
Axial forging force versus stroke of lower die and corresponding views of gear formation for different designs
At the first stage, the upper die contacts the workpiece, resulting in local plastic deformation in the contact areas between workpiece and dies (


In spite of similarities of variation tendency, some significant differences in the different designs can be seen in Fig. 8.
First, the strokes of lower dies for all designs are different because of the difference in the initial workpiece height. The initial workpiece height of design 3 is the least, corresponding to the smallest stroke as shown in Fig. 8c . In comparison, the die stroke of design 1 is the largest as shown in Fig. 8a .
Second, as illustrated by 
Third, the durations of stage 1 are not exactly the same due to the differences in forming patterns for different designs. The duration of stage 1 for design 3 is much more than those of the other four.
Figure 9 illustrates the maximum axial forging force for different designs. It is evident that the maximum axial forging force of design 4 is the lowest, whose value is ∼1600 kN. By comparison, design 1 demands the largest load requirement of ∼2600 kN.
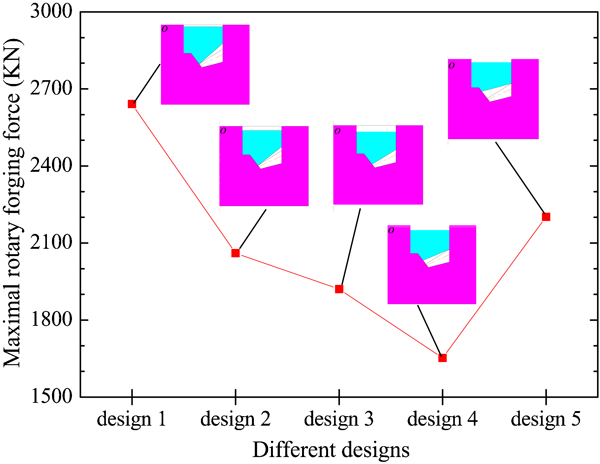
Maximum axial forging force for different designs
Design 4 was chosen to be the optimum one for ease of obtaining the relatively low damage risk and forming load requirement as stated above. Hence, design 4 of workpiece is adopted in the subsequent studies to reveal the deformation mechanism of the cold rotary forging process of a spiral bevel gear, anticipating providing valuable guidelines for further experimental studies.
Deformation mechanism of cold rotary forging of a spiral bevel gear
Based on the sound FE model of the optimum workpiece (design 4), the contact status between the dies and workpiece, and various field variables such as flow velocity and strain were investigated in detail. These research results thoroughly reveal the deformation mechanism of cold rotary forging of a spiral bevel gear.
Contact status between dies and workpiece
The contact status between the dies and workpiece has a significant effect on the cold rotary forging process. As can be seen in Fig. 10, the area with green nodes represents the contact area between the upper die and workpiece, and the area with blue nodes represents the contact area between the lower die and workpiece. This figure verifies the local deformation characteristics of cold rotary forging. During the cold rotary forging process, the contact area with complex geometry shape keeps changing in position and size owing to axial feed of the lower die and oscillation of the upper die.
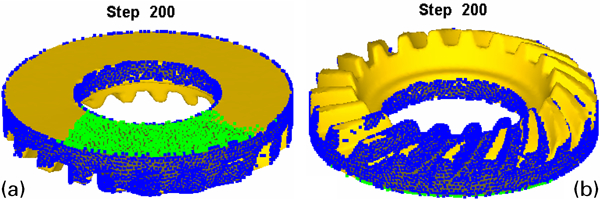
Contact status between different dies and workpiece in cold rotary forging a between upper die and workpiece and b between the lower die and workpiece
Figure 11 illustrates the variation curves of the contact area between the upper die and workpiece with time. It is evident that the contact area between the upper die and workpiece is much smaller than the total area of the upper surface of workpiece at any time in the process. Apart from this, it can be seen that the curve change is also composed by three stages. At the initial stage of the process, the upper die begins to contact the upper surface of the workpiece, hence the contact area between the upper die and workpiece increases rapidly from zero to a certain value, ∼8·4% of total area of the upper surface of workpiece.
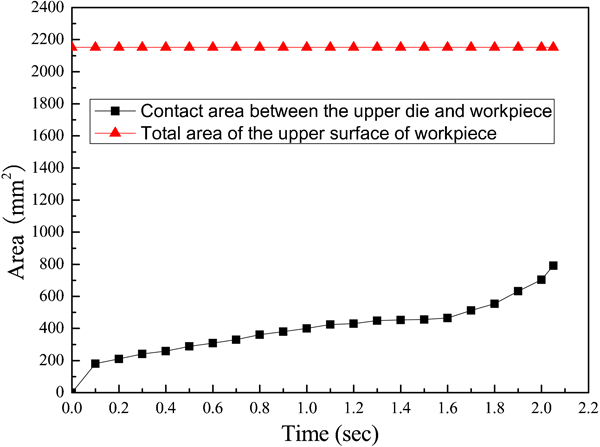
Contact area between upper die and workpiece in cold rotary forging
At the second stage, i.e. the major tooth filling stage, the contact area between the upper die and workpiece increases slowly over time until the gear shape is largely being formed. At the end of this stage, the contact area accounts for ∼21·6% of total area. As the die stroke proceeds, the metal material starts filling the corner of large‐end addendum. Because of the great metal flow resistance, the material near the large‐end addendum is no longer easy to complete filling of die cavity. Consequently, the material underneath the upper die gradually accumulates, resulting in that the contact area between the upper die and workpiece increases remarkably at the final stage of the process. At the end of the entire process, the contact area between the upper die and workpiece accounts for ∼36·8% of total area of the upper surface of workpiece.
Metal flow velocity fields in cold rotary forging process
Metal flow velocity fields, represented by line segment with arrows in the simulation, can directly reflect metal flow. Directions of arrows represent the directions of metal flow, and colours of arrows stand for flow velocities. In the cold rotary forging process of a spiral bevel gear, the workpiece under the local load can be divided into two areas: active deformation area contacting the upper conical die and passive deformation area separating with the upper conical die. Thus, the metal flow in cold rotary forging is more complex than that in conventional forging. In order to reveal the metal flow laws during the cold rotary forging process, the overall flow velocity fields are investigated in details, as shown in Fig. 12. As can be seen in this figure, the distribution of flow velocity fields at different times shows enormous differences and characteristics.
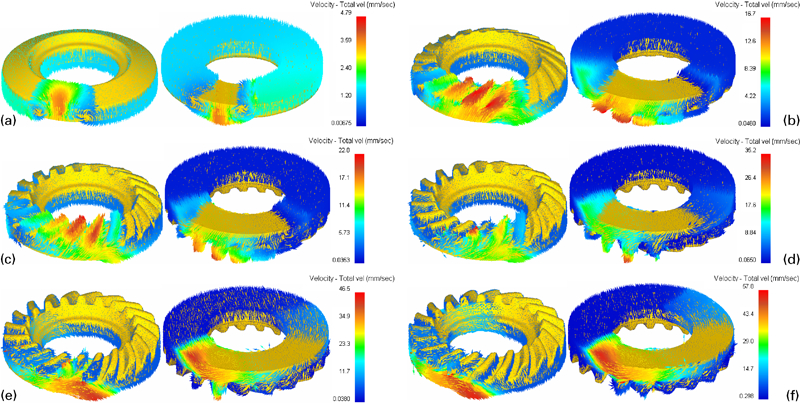
Flow velocity fields in cold rotary forging process
First, the metal flow directions in the active deformation area are different from those in the passive deformation area: at the initial stage of cold rotary forging, the metal material in the active deformation area flows into the die cavities due to the axial forging force, and axial flow is predominant (see Fig. 12a–c ); at the final forging stage, the metal flow directions change gradually from axial direction to tangential direction due to the great metal flow resistance of complete filling of die cavity (see Fig. 12d–f ). The passive deformation area is under lateral compression from the active deformation area, thus resulting in the metal flow in the opposite direction of deviating from the die cavities.
Second, the metal flow velocities in the active deformation area are different from those in the passive deformation area: during the entire cold rotary forging process of a spiral bevel gear, the flow velocities of metal material in the active deformation area are far greater than those in the passive deformation area. Under the action of axial feed of the lower die and oscillation of the upper die, the active deformation area is under local heavy load, thus resulting in severe metal flow in this area. By contrast, the metal flow velocities of the passive deformation are close to zero.
Third, the distribution of maximum flow velocity varies with time: at the beginning of forging process, the lower die contacts the area corresponding to large‐end gear firstly, resulting in local plastic deformation. So the metal flow velocity in large‐end area is larger than that in small‐end area (see Fig. 12a and b ). In the middle of the forging process, the small‐end gear cavity is easier to fill, so the metal flow velocity in small‐end area is the largest (see Fig. 12c ). As the die stroke proceeds, the small‐end of spiral bevel gear first achieve filling, accordingly the metal flow velocity in this area reduces to zero and contrarily the flow velocity in large‐end gear area regains the peek (see Fig. 12d ). In the end of forging process, the metal material is difficult to complete filling of die cavity with the sharp increase of flow resistance, which makes the tangential flow velocity in entrance position of contact area (see Fig. 1) the largest one instead of the metal axial filling of gear shape (see Fig. 12e and f ).
Fourth, the contact area between the upper die and the workpiece varies with time: from Fig. 12, it is clear that the active deformation area is getting larger and larger, i.e. the contact area between the upper die and the workpiece is increasing with time; at the final forging stage, the contact area increases significantly with material tangentially pilling up in front of the upper conical die, thus resulting in the unevenness of the upper surface of rotary forged gear. This, in another way, explains the conclusion described above (see Fig. 11).
Aiming to obtain the metal flow laws in the complicated gear shape area, three special points are tracked to monitor the flow velocity variation in the cold rotary forging process of a spiral bevel gear, as shown in Fig. 13. Point 1 locates in the large‐end gear addendum; point 2 locates in the middle of the gear addendum; point 3 locates in the small‐end addendum.
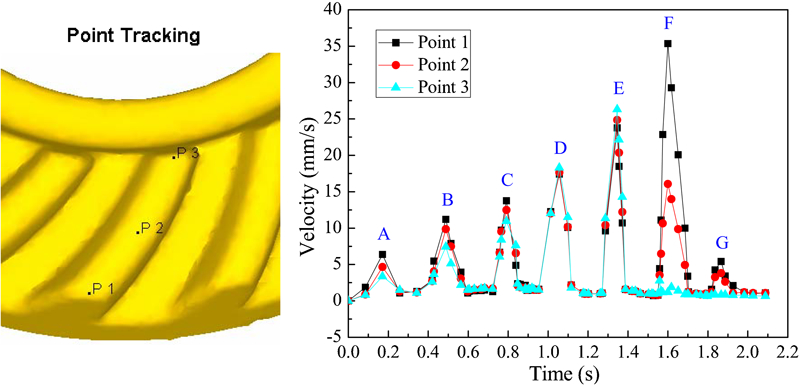
Velocity variations of tracking points along addendum with time (P1–P3 denote points 1–3 respectively)
From Fig. 13, it is clearly shown that the velocities of the tracking points present great fluctuations in serration, which is caused by repeated contact between the upper die and workpiece. Obviously, the seven serrations (marked A–G in Fig. 13) constitute the entire cold rotary forging process of a spiral bevel gear. When the upper die contacts the area including the examined points, their velocities increase sharply; when the upper die deviates from the area including the examined points, their velocities decrease to about zero rapidly.
Furthermore, it can be also seen that the peak velocities of all points firstly increase and then decrease with time. At the initial stage of cold rotary forging, the peak velocities of point 1 are the largest of the three, while those of point 3 are the least (see serration A, B and C in Fig. 13). Over time, the peak velocities of point 3 exceed those of point 1 (see serration D and E in Fig. 13). That is to say, the material in the small‐end addendum flows more acutely than that in the large‐end addendum from that moment. The peak velocity of point 3 in serration F is approximately zero, which forcefully indicates that the filling of small‐end gear shape precedes that of large‐end gear shape (see serration F in Fig. 13). In the final period of cold rotary forging, flow velocities of metal material in the gear shape area reduce to near zero (see serration G in Fig. 13), i.e. the filling of large‐end addendum is also about to be completed. The above analysis of Fig. 13 is in good agreement with the conclusions drawn from Fig. 12.
Effective strain distribution and effective strain history
Figure 14 illustrates the effective strain (PEEQ) distribution of the cold rotary forged gear with time. As described above, the lower die contacts the large‐end of the lower surface of workpiece first, so the metal in this area is easier to satisfy the yield condition to enter the plastic deformation state. Consequently, the plastic deformation zone is firstly formed on the lower surface contacting the lower die, as shown in Fig. 14b . Under the action of axial feed of the lower die and oscillation of the upper die, the plastic deformation zone gradually expands along the circumferential direction and along the gear tooth orientation. As the cold rotary forging process continues, the plastic deformation zone has penetrated the entire lower surface of the workpiece, as shown in Fig. 14c . The metal along the axial height of the workpiece yields subsequently as the die stroke proceeds, as shown in Fig. 14d . At the final forging stage, the total desired strain is achieved in the gear shape area, accordingly the gear shape is completed with the plastic deformation overspreading the cold rotary forged gear, as shown in Fig. 14e and f .
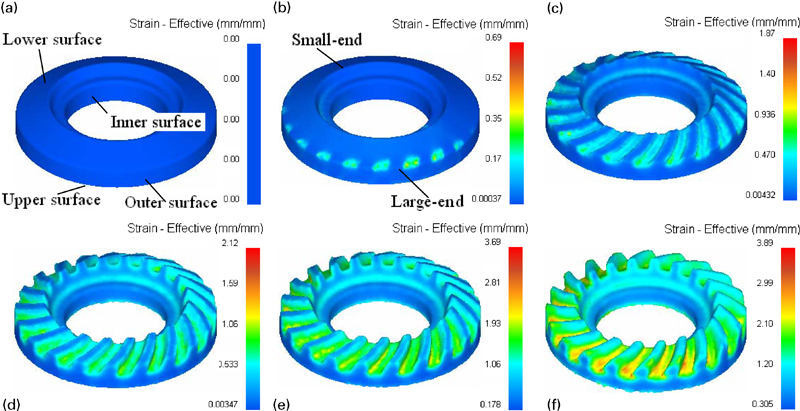
PEEQ distribution with time in cold rotary forging
From Fig. 14, it can be also seen that the PEEQ value in the large‐end dedendum areas is the largest at any time of the process, which indicates that this area has the greatest amount of deformation. That is because the metal material contacting the lower die is under the axial compressive deformation to form the dedendum, and simultaneously squeezes the surrounding metal to fill the die cavity. Furthermore, observation from Fig. 14a–f shows that the PEEQ distributes very inhomogeneously in the axial and radial directions, but very homogeneously in circumferential direction.
In order to investigate the PEEQ distribution laws and evolution histories in detail, some special points are considered as the tracking points to monitor the strain variation in the cold rotary forging process of a spiral bevel gear, as shown in Fig. 15. From Fig. 15, it can be seen that strain of every tracking point increases stepwise, mainly owing to the continuous transfer of the plastic deformation zone. Obviously, each step corresponds to one rotation cycle of the upper die. In other words, the level part of the step corresponds to the time when the upper die separates from the contact area including the tracking point, and the height of the step stands for the strain of the tracking point in the corresponding cycle. In addition to these similarities in evolution histories, however, some obvious differences in the various directions can be seen from Fig. 15.
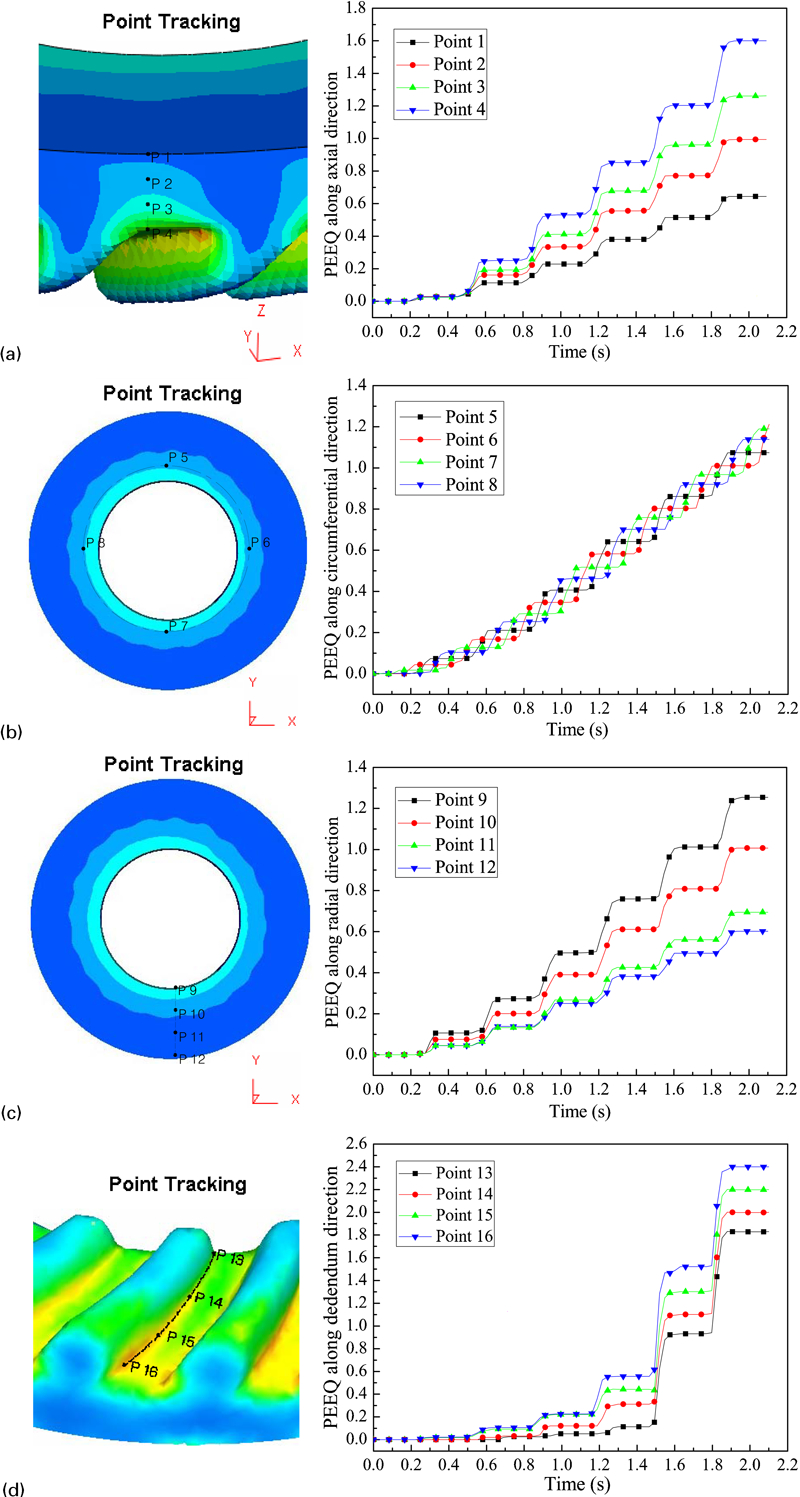
PEEQ varieties of tracking points with time a along axial direction, b along circumferential direction, c along radial direction and d along dedendum direction
First, Fig. 15a illustrates the PEEQ distribution along axial direction, in which points 1–4 are uniformly distributed along axial direction on the outer surface of the workpiece. It is clear that the PEEQ varies along the axial direction. Before 0·5 s, the four curves almost overlap, which indicates that the axial deformation is very homogeneous along the axial direction at the initial forging stage. After 0·5 s, the step height increasing in one single revolution has growing diversity with time among various points. The PEEQ of point 4 increases faster than those of other points, while point 1 has the slowest growth rate. That is to say, the most intense deformation exists in the area near the lower surface of the workpiece, and the smallest deformation appears in the area near the upper surface of the workpiece, which causes the inhomogeneous distribution characteristic along the axial direction.
Second, Fig. 15b shows the PEEQ distribution in the circumferential direction, in which points 5–8 evenly distribute along the circumferential direction on the upper surface of the workpiece. From this figure, it is interesting to see that the PEEQ variation curves of the tracking points weave regularly together like a ‘DNA’ chain, which is caused by their identical variation trend and time intervals. This, in another way, reflects that the PEEQ distributes homogeneously along the circumferential direction.
Third, Fig. 15c gives the PEEQ distribution along the radial direction, where points 9–12 are uniformly distributed along radial direction on the surface of the workpiece. It can be also seen that the PEEQ varies along the radial direction, and the non‐uniformity increases with time. As can be also seen from this figure, the PEEQ variation curve of point 11 is close to that of point 12, which indicates that the PEEQ distributes relatively homogeneously in the area close to the outer surface; whereas, the PEEQ distributes very inhomogeneously in the area close to the inner surface. The above analysis is in good agreement with the strain contours.
Fourth, Fig. 15d provides the PEEQ distribution along the dedendum direction, where the tracking points 13–16 locate in the dedendum areas of cold rotary forged gear. It can be seen from this figure that the PEEQ distribution also exhibits the inhomogeneous characteristic along the dedendum direction: the larger PEEQ concentrates in the large‐end dedendum areas; the smaller PEEQ resides in the small‐end dedendum areas of cold rotary forged gear. It can be also seen that the PEEQ value of point 13 begins to accumulate from about 0·7 s, the reason for which is that the small‐end area of the workpiece contact the lower die at last.
Conclusions
Based on the forming characteristics of the cold rotary forging process, a 3D rigid plastic FE model of cold rotary forging of a spiral bevel gear was developed under the DEFORM‐3D software environment. The research results thoroughly reveal the deformation mechanism of cold rotary forging of a spiral bevel gear by analysing the material flow characteristics and effective strain distributions in detail. The conclusions with the FE analysis can be summarised as follows.
An optimised workpiece geometry of a specified spiral bevel gear in the cold rotary forging process is recommended according to the damage risk and forming load requirement.
The workpiece can be divided into an active deformation area and a passive deformation area. The metal flow occurs primarily in the active deformation area: at the initial forging stage, axial flow of the metal material in this area for filling die cavities is predominant; over time, the metal flow direction changes gradually from axial direction to tangential one due to the great metal flow resistance of complete filling of die cavity. By contrast, the flow velocities of metal material at the passive deformation are almost zero. It can be also concluded through the analysis of the velocity field that the small‐end gear shape achieves the complete filling firstly, and the large‐end gear shape completes filling at last.
Cold rotary forging of a spiral bevel gear is a process of strain accumulation by a large number of small strain steps and thus it is considered to be an incremental metal forming technology. The PEEQ value in the large‐end dedendum areas is the largest at any given time in the cold rotary forging process, while the areas without gear shape have the relatively low PEEQ value. That is to say, the metal material in the areas of gear shape has experienced more intense deformation than those in the areas without gear shape. Moreover, the PEEQ distributes very inhomogeneously in the axial and radial directions, but relatively homogeneously in circumferential direction.
The feasibility of cold rotary forging of a complex spiral bevel gear has been verified through the economical numerical simulation method instead of expensive ‘trial‐and‐error’ experiments, thus expanding the capabilities of cold rotary forging.
Footnotes
Acknowledgements
The authors would like to thank the Natural Science Foundation of China for Distinguished Young Scholars (grant no. 50725517) for the support given to this research.