
Abstract
A new technique based on a combination of time resolved X‐ray diffraction and laser scanning confocal microscopy was developed for direct observation of morphological evolution and simultaneous identification of phases during thermal cycle of welding. Time resolved X‐ray diffraction data and laser scanning confocal microscopy images under the desired thermal cycles were measured simultaneously. As an example, the microstructural evolution in 15Cr–5Ni martensitic steel was observed to investigate the phase transformation kinetics under the thermal cycle of rapid heating and cooling.
Introduction
The microstructures of welds are formed through various thermal cycles and depend on the details of the welding path, including the heat input and composition; thus, it is difficult to determine the process of microstructure formation during the thermal cycle of welding. The crystal structure of low carbon steel undergoes two transformations (δ→γ→α) when it is cooled from the liquid phase to room temperature. This provides an opportunity to obtain various desirable properties of a weld [the weld metal and the heat affected zone (HAZ)] through microstructural control. Therefore, understanding the behaviour of phase transformation in the welding process is essential. The phase transformations occur during rapid heating and cooling cycles (several hundred degrees/second) at high temperatures; therefore, it is difficult to observe the phase transformation in detail during welding.
Over the past decade, two synchrotron based techniques have been developed at Lawrence Livermore National Laboratory (Livermore, CA, USA) for direct observation of phase transformations induced by welding: spatially resolved X‐ray diffraction (XRD), which was developed to map the phases that exist in the HAZ,1– 6 and time resolved XRD (TRXRD).
Elmer et al. 7– 12 showed that TRXRD could track phase transformation during welding in real time. Synchrotron radiation makes time resolved diffraction measurements possible in local areas; phases that exist in the HAZ and fusion zone of metal can be identified in real time. Using this technique to analyse the phase transformation during solidification of C–Mn steel, Babu et al. 10 verified the existence of non‐equilibrium phases directly in the rapid cooling cycle of spot welds. In addition, TRXRD can be applied to track the phase evolution in the HAZ. The formation of the microstructures of duplex stainless steel11 and C–Mn8 steel was observed in the thermal cycle of the HAZ using the TRXRD system. In experiments with duplex stainless steel, the phase balance between ferrite and austenite was estimated, and the precipitation of the detrimental phase in the thermal cycle of the HAZ was assessed. In TRXRD experiments with C–Mn steel, the effect of transformation strain on the diffraction pattern profile during martensitic transformation was discussed.
Our research group began TRXRD experiments on welding by developing a new technology for the system.13– 26 We focused on the details of the weld solidification phenomena in the directional solidification process under rapid cooling because the influence of a preferred orientation is important for observing directional solidification along the <100> direction towards the moving heat source. First, the solidification process was confirmed by spatially resolved XRD as a function of the distance from the weld pool, using quenched metals after welding.13, 14 However, the crystallisation at a lateral resolution corresponding to a time resolution of 0·1 s was impossible to observe. That is, because the microstructure is ultimately static, understanding the crystallography during heating and cooling is not possible. For instance, the eutectic microstructure is formed in the liquid phase during solidification; the displacement of interplanar spacing by thermal expansion and shrinkage could not be observed. Next, the phase transformation was dynamically observed along a specific direction in reciprocal space using an imaging plate.15– 17 A crystallinity change was observed with a temperature drop, and the growth of dendrites was captured. The discontinuous diffraction pattern recorded by the imaging plates along one direction of reciprocal space suggested a rotation of dendrites. Although peritectic growth of the heterophase on the primary phase was expected, eutectic growth in the remaining liquid phase was confirmed. Therefore, it was difficult to simultaneously observe the primary phase and the heterophase along a specific direction because interfaces have coherency and preferred crystal orientation.
With the availability of intense X‐ray beams from synchrotron storage rings, it is now possible to directly observe phase transformation and microstructural evolution in situ and in real time as a function of welding time. Therefore, we developed a two‐dimensional TRXRD system for real time observation of welding.18– 28 Rapid solidification of weld metal was then dynamically observed at a time resolution of 0·01–0·1 s.
In the study described above, monochromatic X‐rays are used as a probe and are incident from one direction. Thus, detecting a wider area of the Debye circle is very important. For analysing the solidification process, the weak and broad halo pattern is a clear sign of the existence of liquid. Thus, the beginning and end of solidification can be observed by detecting halo patterns with a high S/N detector.25 For example, Fig. 1 shows the diffraction patterns for the solidification process of martensitic steel during gas tungsten arc welding, as detected in our system. The broad and weak halo pattern, indicated by an arrow in Fig. 1a, corresponds to the liquid phase. The diffraction spot shown in Fig. 1a, circled by a dashed line, corresponds to δ‐ferrite. The austenite phase nucleated 0·08 s from the detection of the primary phase and grew as the secondary phase, as shown in Fig. 1b. If the detector width was half, the solidification sequence could not be determined. Figure 1c shows the disappearance of the halo pattern, indicating the end of solidification.
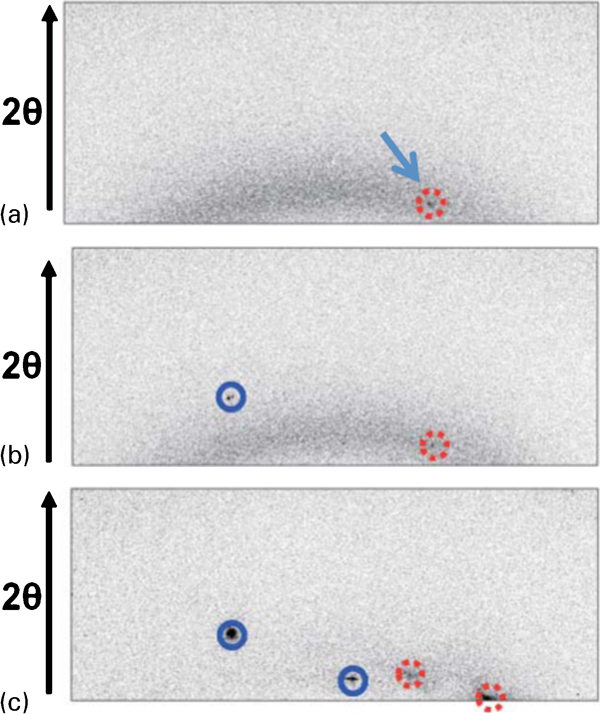
Diffraction spots for solidification during gas tungsten arc welding of martensitic steel (15Cr–5Ni)
A combination of analysis methods [the in situ phase identification system, morphological observation by high temperature laser scanning confocal microscopy (LSCM) and observation of the microstructure at room temperature using an optical microscope, a scanning electron microscope and a microdiffraction system] was suggested for analysing phase transformation during welding.20– 22
The TRXRD data obtained during welding need to be combined with the appropriate temperature history to obtain the phase transformation kinetic data. The high temperature LSCM technique can give us information, such as the morphological development of microstructures and precise temperature.
A new technique based on the TRXRD and LSCM systems was developed in the present study. As an example, the microstructural evolution in 15Cr–5Ni martensitic steel was observed to investigate the phase transformation kinetics under the thermal cycle of rapid heating and cooling.
In situ observation system in real and reciprocal lattice space
Overview of system
Figure 2 shows a photograph of the experimental set‐up on the 46XU beamline at SPring‐8 in Hyogo, Japan. The infrared furnace was set on the θ axis of a goniometer situated within the hatch of the beamline. In this system, the head of an LSCM was also set by fitting the θ axis, as shown in the photograph. The focus point of the LSCM is on the surface of the observed sample, which is set in the furnace. A two‐dimensional pixel detector was placed on the 2θ axis, as shown in the photograph. The incident beam, i.e. an ultra bright X‐ray, was introduced into the furnace, and the diffractions were recorded by the pixel detector with high time resolution. Simultaneously, the microstructural changes were observed through the LSCM in situ.
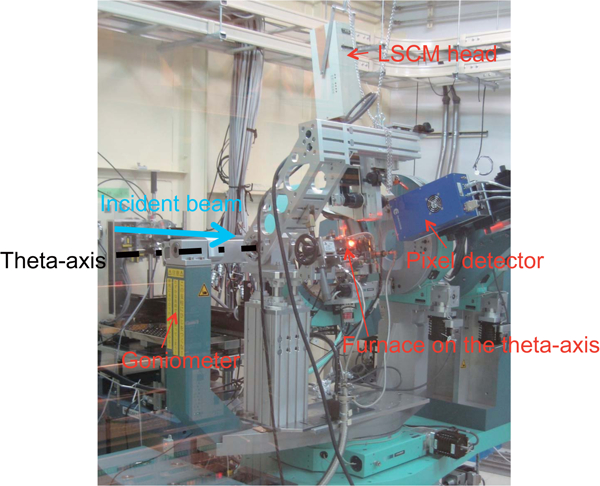
Photograph of experimental set‐up at 46XU beamline at SPring‐8 in Hyogo, Japan
Detailed experimental procedures
Figure 3 shows a schematic illustration of the control flow for the in situ observations in real and reciprocal lattice space. The specimens, 5 mm in diameter and 1 mm in thickness, were placed in a BN crucible in which the X‐ray absorption is quite small. The crucible was held by a platinum holder, which was inserted in the furnace. The temperature was measured by a thermocouple incorporated into the crucible holder. The specimens were placed at the focal point of a halogen lamp. The temperature controller, which was connected to a personal computer (PC), the thermocouple and the halogen lamp in the furnace were placed outside the beamline hatch. When the thermal cycles that simulate welding were programmed on the PC, the profiles were sent to the temperature controller, which reproduced the desired thermal cycles by switching the halogen lamp on and off, based on the measured temperature. Both the maximum heating and cooling rates of the system were 37 K s−1. The LSCM head enables in situ observations of microstructural changes at 30 frames/s at high temperatures.21, 22, 27 A charge coupled device camera was connected to the PC located outside the hatch, and the images were stored at a rate of 30 frames/s. The control program could trigger the temperature controller, the X‐ray shutter, the x–y–z stages on θ axis, goniometer axis control and the exposure of the pixel detector.
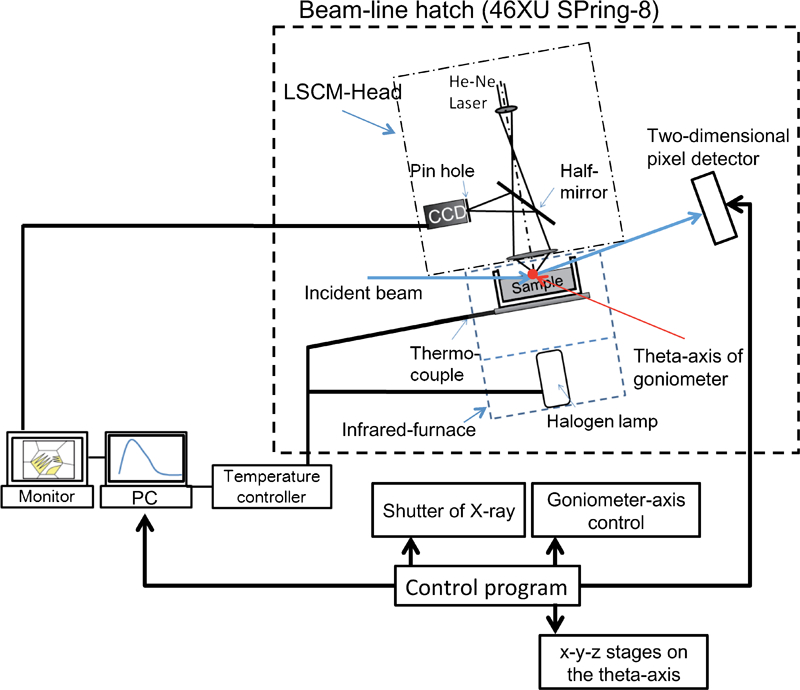
Experimental set‐up for in situ observation in real and reciprocal lattice space
Before the measurements, the specimen position was adjusted in the manner explained in the following section. Then, the θ axis was tilted to a fixed angle (10° in the present study). The temperature controller was then triggered at a set time, and the exposure of the detector was activated with the time resolution of 0·2 s. Time resolved XRD data and LSCM images under the desired thermal cycles were obtained simultaneously.
Scattering geometry of X‐rays in experimental set‐up
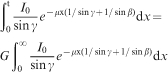
Figure 4 shows the scattering geometry of the TRXRD part of the system. The undulator beam was monochromatised by the double Si crystal, and 18 keV of X‐ray energy was used. The X‐ray was introduced into the hatch through a mirror; the incident beam is shown in Figs. 2 and 3. The X‐ray beam was shaped by the slit; the dimensions of the beam were 0·5×0·5 mm. Before the measurements, the position of the sample surface was adjusted. By controlling the z stage, the sample surface is forced to be the middle of the beam height as indicated by the dashed line in Fig. 4. The θ axis was then rotated by 10°. The resulting irradiated area was 1·4397 mm2. The penetration depth is derived using equation (1)29

Scattering geometry of X‐rays in experimental set‐up
Results and discussion
Figure 5a shows the thermal cycle applied to 15Cr–5Ni steel. As shown in the calculated phase diagram (Fig. 5b), the maximum temperature of 1378°C corresponds to the dual phase region of δ‐ferrite and γ‐austenite.
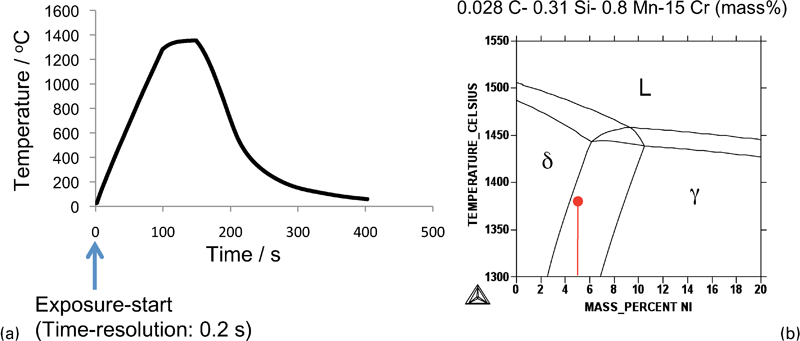
a time–temperature diagram for thermal cycles used in experiment and b calculated phase diagram for sample steel used (line shows thermal cycle applied)
Figure 6 shows snapshots of TRXRD data and LSCM images during the heating cycle at 50, 759 and 885°C. In the case of TRXRD data, the vertical axis is the scattering angle 2θ, and the horizontal direction corresponds to the diffraction ring, i.e. the same reflection. At 50°C, two reflections were identified for the martensitic phase (
 and
and
 ). Each diffraction pattern was wide, as shown in Fig. 6a. The broad weak patterns, indicated by the arrow, came from the crucible (BN). Before the measurements, the observed surfaces of the specimens were mirror polished. At this temperature, there was no contrast in the LSCM image.
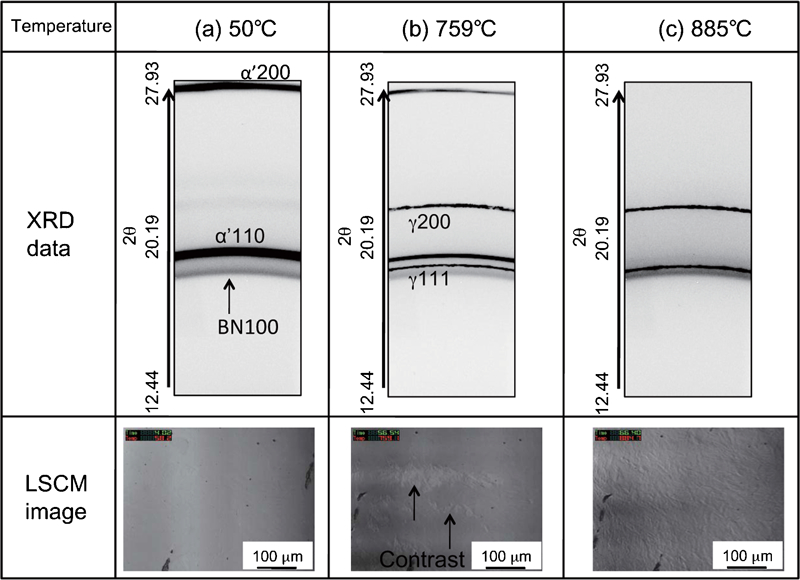
Snapshots of XRD data and LSCM images during heating at a 50, b 759 and c 885°C
As the temperature increased, the diffraction peaks of
 and
and
 shifted to lower scattering angles, and the line width decreased. At 759°C, the diffraction patterns for austenite phase (γ111 and γ200) as well as clear contrasts appeared in the LSCM image (Fig. 6b). The contrasts indicated by the arrow were formed by the shrinkage from a bcc (bct) to an fcc structure. At 885°C, the diffraction patterns for martensitic phase disappeared (Fig. 6c). Simultaneously, the contrast due to the formation of austenite phase covered the entire viewing region. Therefore, it could be inferred that the TRXRD data and LSCM images had good correspondence.
With further increase in the temperature, the diffraction pattern for the reflection of γ111 changed from a ring to spot pattern (Fig. 7a), and the diffraction spots corresponding to the δ‐ferrite phase could be detected. In addition, LSCM images show that the grain boundaries of austenite were decorated with new phases, i.e. δ‐ferrite (Fig. 7b). The decorating phases clearly indicate the grain boundary of austenite. One reason for the spot pattern for austenite reflection is that the large size of austenite grain (∼200 μm) reduces the number of crystals that satisfy the Bragg condition. The decoration developed with temperature, as shown in the LSCM images (Fig. 7c). It is difficult to identify the nucleation site during phase transformation from the TRXRD data, which is important in understanding the microstructural changes. Combined with LSCM, this technique enables a deeper understanding of the kinetics of phase transformations. A new phase nucleated and grew at the grain boundaries of austenite when the diffraction spots corresponding to δ‐ferrite appeared.
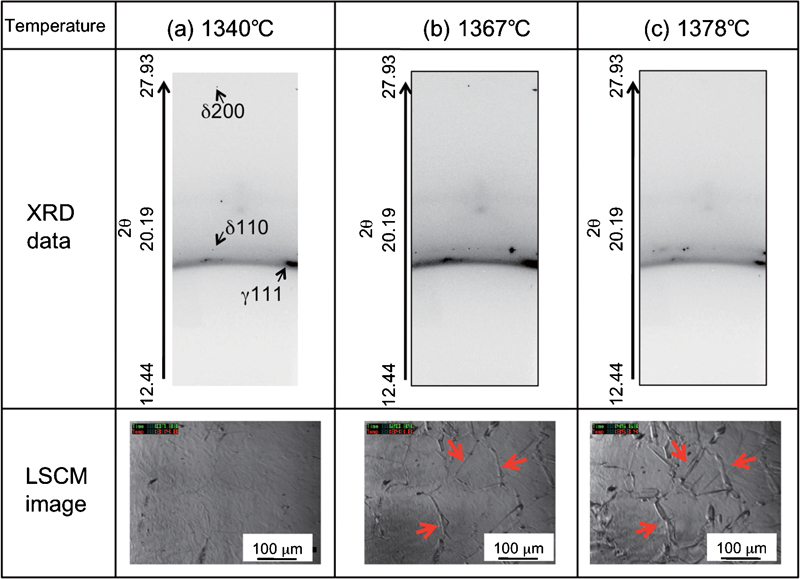
Snapshots of XRD data and LSCM images during heating at a 1340°C, b 1367°C and c 1378°C
The diffraction patterns during the cooling cycle are shown in Fig. 8 for 1375, 1290 and 1012°C. As temperature decreased, the diffraction spots for austenite phase increased. The diffraction spots for δ‐ferrite, however, did not fade away, indicating non‐equilibrium behaviour; some δ‐phase was retained. The morphology observed from LSCM images at 1012°C was complex; it is difficult to grasp the amount of retained δ‐ferrite from the images. The diffraction results in Fig. 8 enhance the change of diffraction patterns for δ110 reflection during the cooling cycle. The diffraction pattern shifted towards a higher scattering angle. It is difficult to derive the δ‐ferrite volume from the TRXRD data measured at room temperature. In the present study, the relationship of θ–2θ is maintained in the experimental set‐up, and the equation for double angle rotation is applied approximately for quasi‐quantification of the δ‐phase at 1012°C. After integrating the photon counts of diffraction spots for δ110 and γ111 diffraction patterns in the horizontal direction, the count ratio was used with K (based on the equation derived by Alexander and Klug31) to estimate the volume fraction. The measured value from the TRXRD data was used for the lattice parameter, and the volume fraction of δ‐ferrite at 1012°C was roughly estimated as 23% for 15Cr–5Ni martensitic steel.
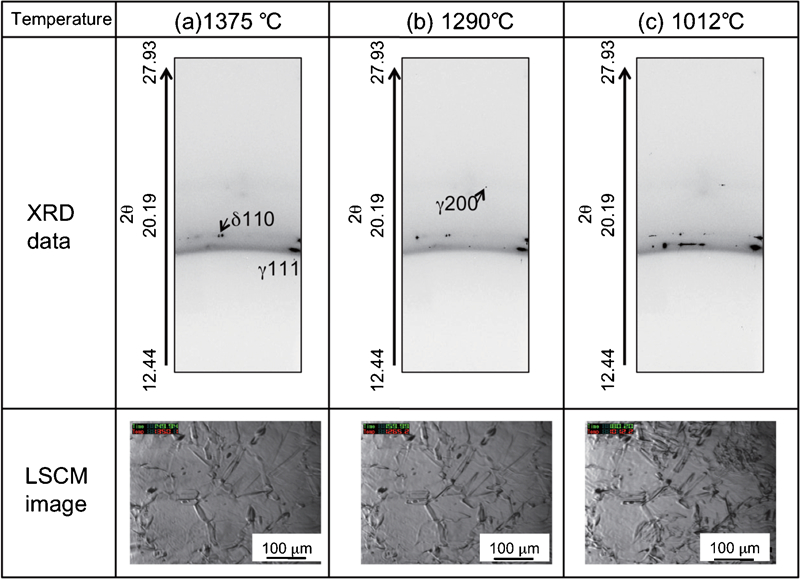
Snapshots of XRD data and LSCM images during cooling at a 1375°C, b 1290°C and c 1012°C
Figure 9 shows snapshots of TRXRD data and LSCM images during cooling cycles at 220, 177 and 76°C. At low temperature, the diffraction patterns of the same 2θ angle with δ110 reflection appeared with forming ring pattern (Fig. 9a). Simultaneously, a well aligned microstructure suddenly appeared, as indicated by the arrow in the LSCM image in Fig. 9a. This sensitivity to the transformation temperature is the characteristic of martensite. The wide diffraction pattern for martensite is similar to that shown in Fig. 5a. With further decrease in temperature, the width of the ring for the bct structure increased, as shown in Fig. 9b and c. Finally, the diffraction patterns for austenite disappeared (Fig. 9c), and the martensitic phase increased, as shown in the LSCM image.
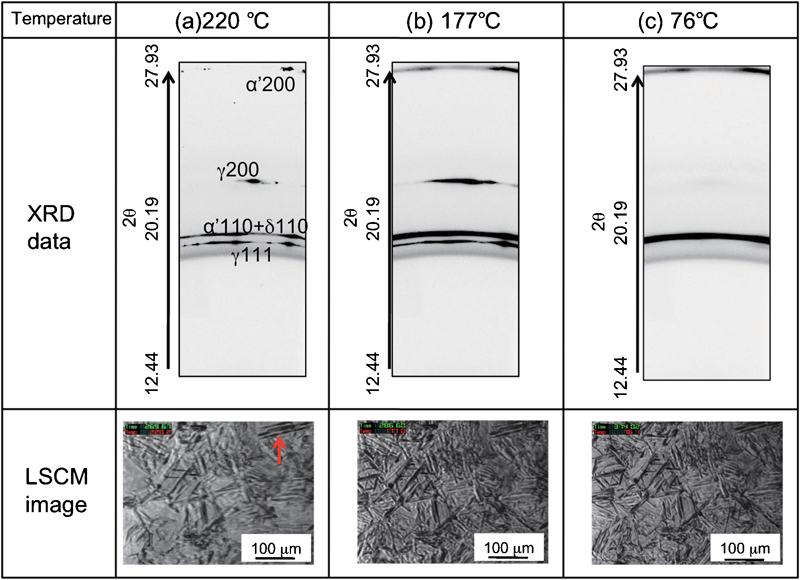
Snapshots of XRD data and LSCM images during cooling at a 220°C, b 177°C and c 76°C
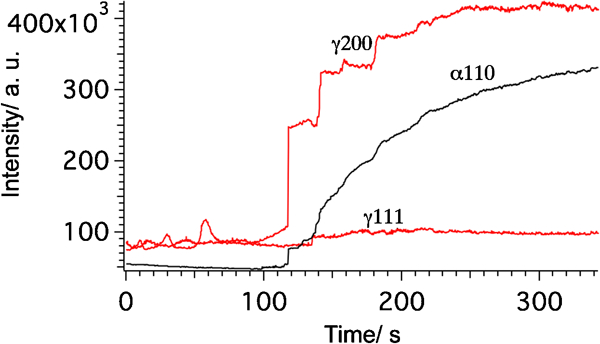
Figure 10 shows image representations of diffraction data under the cooling cycle (from 708 to 62°C) of the present experiments. It can be seen that the scattering angle of each reflection shifted towards a higher angle in the cooling process because of thermal shrinkage. Figure 11 shows the time series representation of the integrated intensity of reflections γ111, γ200 and α110 in Fig. 10 (from 708 to 62°C). When the martensitic transformation began, the integrated intensity for the α110 reflection suddenly increased, reflecting the formation of the martensitic phase. At the same time, the integrated intensity for γ111 and γ200 slightly increased, even though the amount of austenite phase decreased because of the martensitic transformation. After the increasing, the intensity of each austenite reflection began to decrease until reaching room temperature. Cr–Ni steel with 9 mass‐% nickel content (referred as 9Ni) was prepared for comparison, and diffraction data were acquired along the same thermal cycle as that in Fig. 10. Figure 12 shows the image representations of the diffraction data for the cooling cycle (from 350 to 32°C) with the 9Ni specimen: the driving force of transformation was insufficient at room temperature; thus, much austenite was retained. Figure 13 shows the time series representation of the integrated intensity for γ111, γ200 and α110 reflections in Fig. 12 (from 350 to 32°C). When martensitic transformation began, the integrated intensity for the α110 reflection suddenly increased, showing the same tendency as in Fig. 11. At the same time, the integrated intensity for γ111 and γ200 increased until room temperature was reached even though the amount of these phases decreased. Thus, the results in Fig. 13 suggest that the diffraction intensities for austenite cannot be used for quantity evaluation when a large proportion of austenite is retained at room temperature. Qiu et al. 32 showed the discrepancy of retained austenite contents among various measurement methods: electron backscattered diffraction, magnetisation and XRD. The discrepancy increased with the nickel content. Our in situ measurements directly detected the abnormal increase in the diffraction intensity of austenite when a large proportion of austenite was retained at room temperature. Our results explained the results provided by Qiu et al. 32 In the future, a modified equation will be presented for estimating the retained austenite contents from XRD data.
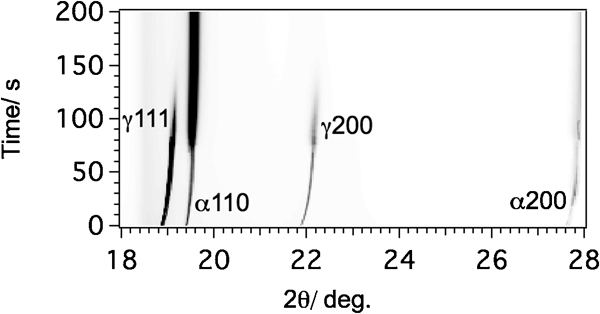
Image representations of diffraction data during cooling cycle (from 708 to 62°C) for 15Cr–5 Ni steel
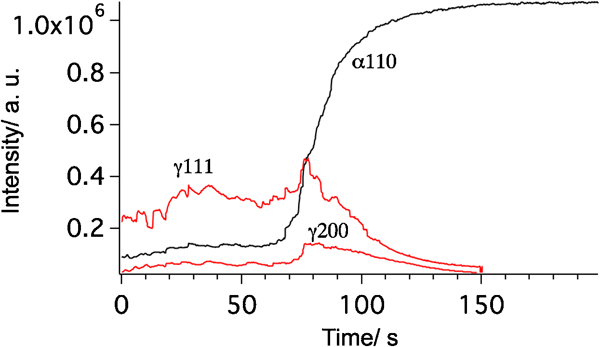
Time series representation of integrated intensity of reflections γ111, γ200 and α110 in Fig. 10 (from 708 to 62°C)
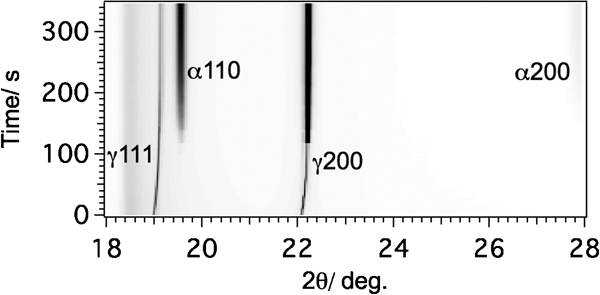
Image representations of diffraction data during cooling cycle (from 350 to 32°C), with 9Ni specimen
Time series representation of integrated intensity of reflections γ111, γ200 and α110 in Fig. 12 (from 350 to 32°C)
Summary
A new technique based on a combination of TRXRD and LSCM was developed for direct observation of morphological evolution and simultaneous identification of phases. Time resolved X‐ray diffraction data and LSCM images under the desired thermal cycles were measured simultaneously. As described above, the combination of LSCM and TRXRD is effective in investigating the phase transformation kinetics during thermal cycles of rapid heating and cooling. The system can be applied to the analysis of microstructural changes for improved control of properties in welds.
Future works
Synchrotron based XRD techniques combined with high temperature LSCM provide new and powerful tools for the study of phase transformations and microstructural evolution during welding. An excellent historical review of TRXRD by Elmer et al. 33 describes several limitations of their experimental setup: the size and geometry of the samples and the speed and resolution of the detectors and linear detector.
For an areal detector, a uniquely sensitive, two‐dimensional pixel detector, called PILATUS,34, 35 was developed by the SPring‐8 detector team in collaboration with the Paul Scherrer Institute36, 37 in Switzerland. The counters can be read out digitally with a frequency of 10 or 100 MHz. The 100 MHz counter fetches the maximum frame rate of 30 Hz with a readout time of 6·7 ms. This provides increased accuracy in monitoring phase transformations during rapid heating and cooling. Detecting a wider area of the Debye circle is very important. Mounting several detectors on the arm of the diffractometer increases the detection range for a part of the Debye circle. Continual improvements in synchrotron based methods can only increase the ability to monitor these transformations at higher spatial and temporal resolutions during welding. When combined with additional experiments and modelling, these techniques enable a deeper understanding of the kinetics of phase transformations.
Footnotes
Acknowledgements
The synchrotron radiation experiments were performed at SPring‐8 with the approval of the Japan Synchrotron Radiation Research Institute (JASRI) (proposal nos. 2008B2135 and 2009A1944). The authors are grateful to Dr Sato and Dr Toyokawa, JASRI, for profitable discussion. This study was conducted as part of the research activities of ‘Fundamental studies on technologies for steel materials with enhanced strength and functions’ by the Consortium of The Japan Research and Development Center of Metals. Financial support from the New Energy and Industrial Technology Development Organization is gratefully acknowledged.