
Abstract
Owing to the good thermal response of an infrared image furnace, the thermal cycle of welds (weld metal or heat affected zone) can be reproduced, while a laser scanning confocal microscope has a suitable light source and optical geometry for observing metal irradiated at high temperatures. The combination of an infrared image furnace and a laser scanning confocal microscope provides a useful tool for determining the microstructural changes in metals at the micrometre scale during the thermal cycle of welding. The technique of using such a combined system is called high temperature laser scanning confocal microscopy. Both macro‐ and microviews expand the understanding of the microstructural formation of welds and are useful in developing microstructure control methods. This is the first part of a report on the application of laser scanning confocal microscopy to observe microstructural changes for various types of steel samples and thermal cycles. The micro‐ or macroviews of different microstructural formations are presented, including the solidification cell, austenite from δ‐ferrite, pearlite, martensite, Widmanstätten ferrite and bainite.
Introduction
The microstructure of welds is formed through various thermal cycles and depends on the welding path, including composition, heat input and post‐weld heat treatment. Therefore, it is difficult to determine the microstructure formation during the thermal cycle of welding, although it is known that the origin of microstructures exists at high temperatures. In the case of steel, the nucleation sites of ferrite plates during the austenite–ferrite transformation have a large effect on the weld properties, which are attributed to the microstructures. Therefore, techniques for direct tracking of microstructural changes during thermal cycles of welds are essential for designing a microstructure with good mechanical properties.
High temperature laser scanning confocal microscopy (LSCM) is a candidate for such a tracking technique. The microscopy system consists of a laser scanning confocal microscope and an infrared furnace. The use of this combination enables time resolved observation of microstructures at high temperatures for various materials. The system is used to observe the solidification behaviour1–3 and sulphide formation in steel,4–6 determine inclusion solubility,7 derivate the interface migration rate during phase transformations of steel,8 observe morphology of the interface during phase transformations of steel,9 track the dissolution behaviour of inclusions in slag liquid10 and so on. Our research group uses an LSCM system to track microstructure formation during thermal cycles of welds.11–15 Laser scanning confocal microscopy images provide a comprehensive view of microstructural changes at the micrometre scale under the rapid heating and cooling cycle of welds.
In this study, LSCM images of various steel samples and thermal cycles are provided to verify the ability of LSCM to observe microstructure changes at high temperatures and under rapid temperature changes.
High temperature LSCM system
In situ observations of phase transformations were conducted using LSCM. A schematic illustration of the system used for LSCM is shown in Fig. 1. In confocal microscopy, laser light is focused by an objective lens onto the specimen. Using a confocal pinhole, only light incident from the focal plane is permitted to pass through to the photon detector. Hence, an extremely thin optical section is created, providing a high resolution image. Because thermal radiation is also blocked by the confocal pinhole, only the polarised reflection of the high intensity laser beam reaches the image sensor, resulting in a sharp image. The specimens, 5 mm in diameter and 1 mm in thickness, were placed in an alumina crucible and held in a platinum holder, which was inserted into the furnace. The temperature, measured by a thermocouple incorporated into the crucible holder, was displayed on a monitor and simultaneously recorded along with the image, which was recorded at a rate of 30 frames/s. The infrared light focus in the furnace covers a volume 10 mm in diameter and 10 mm in height. The position of the specimen in the furnace is set in this volume.
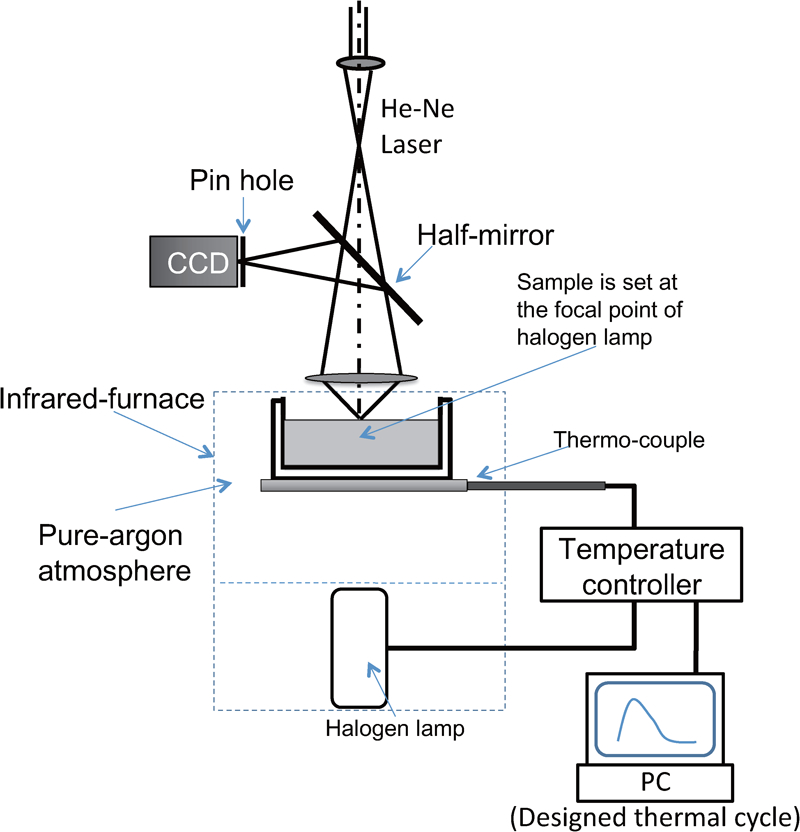
Schematic illustration of infrared furnace and laser scanning confocal microscopy (LSCM)
After evacuating the air, the inert gas is continuously injected into the furnace, such that it flows through the volume of the specimen during the experiments. A check valve maintains the atmospheric pressure. During experiments, decarburisation might occur if the purity of the inert gas is poor, and when this happens, the surface and bulk microstructures are different. In our experience, this is especially enhanced in the case of allotriomorph, compared to bainite or martensite; thus, 99·99996% argon is always used as the inert gas. Simulated thermal cycles of welds are designed and input to the controller via a personal computer. A temperature controller (proportional–integral–derivative controller) reproduces such a designed thermal cycle by adjusting the on–off signal of a halogen lamp by monitoring the substrate temperature. The infrared furnace is suitable for simulating the thermal cycles of welds owing to its highly temperature responsive nature. Examples of LSCM images for various steel and thermal cycles are provided in the following section.
Solidification and δ→γ transformation in carbon steels
Figure 2 shows snapshots of LSCM observations for the solidification of high strength steel (0·05C–0·16Si–1·65Mn–0·011Nb, mass‐%) at a constant temperature of 1544°C. The solidification phase was δ‐ferrite in the cell structure. It is difficult to show the solidification process of welding with the current set‐up, from the viewpoint of controlling the temperature gradients within the specimen; however, it can represent solid state transformations.
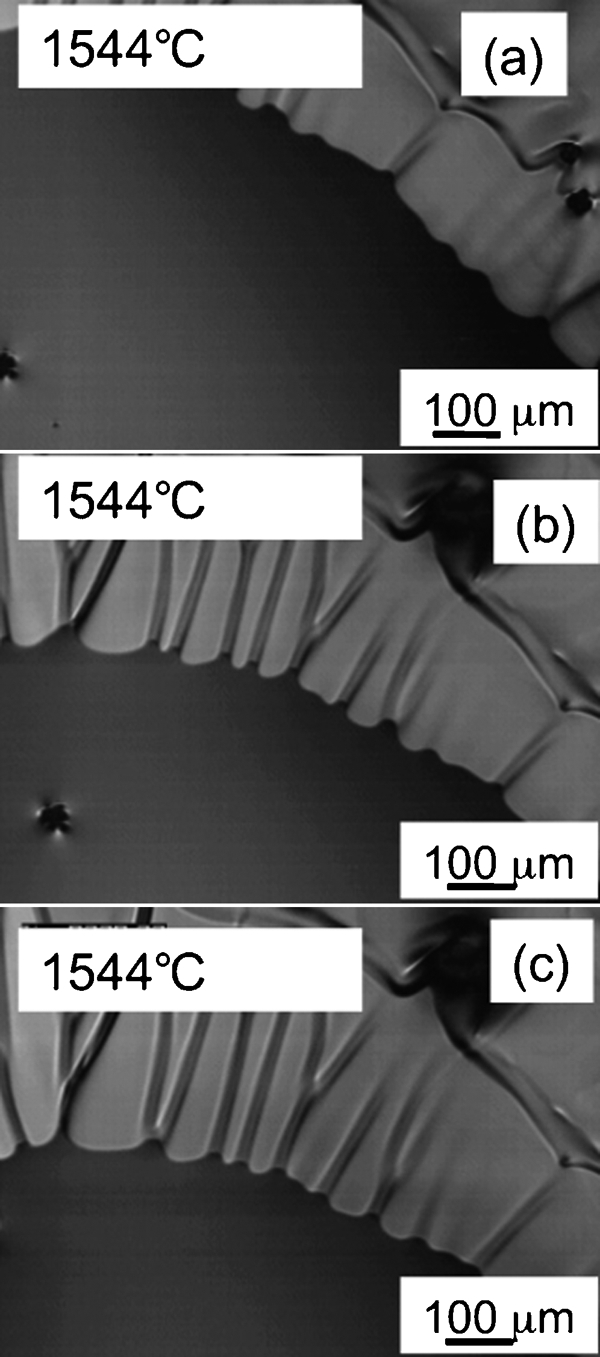
Snapshots of LSCM observations for solidifications of high strength steel at constant temperature of 1544°C
Figure 3 shows snapshots of LSCM observations for the solid state transformation process (δ–γ) of high strength steel (0·05C–0·16Si–1·65Mn–0·011Nb, mass‐%) during the cooling cycle. The δ‐ferrite grain boundary due to thermal etching at high temperatures was clearly observed, as shown in Fig. 3a. As the temperature decreases, a morphology with a wavy pattern developed, as shown in Fig. 3b with weak contrast, and austenite grains formed. As Schmidt et al.16 pointed out, the migration of the grain boundary of the monophase (δ‐ferrite phase) was difficult to identify, and its grain boundary of δ‐ferrite was discretely identified because of the thermal grooving, as shown in Fig. 3a. On the other hand, migration of the interface during phase transformation was easy to identify. The volume difference of the transformation phase produced image contrast, as shown in Fig. 3b. Immediately after the phase transformation, inclusions were formed at the grain boundary of austenite, as shown in Fig. 3d. Composition analysis of inclusions revealed that they were manganese sulphides.
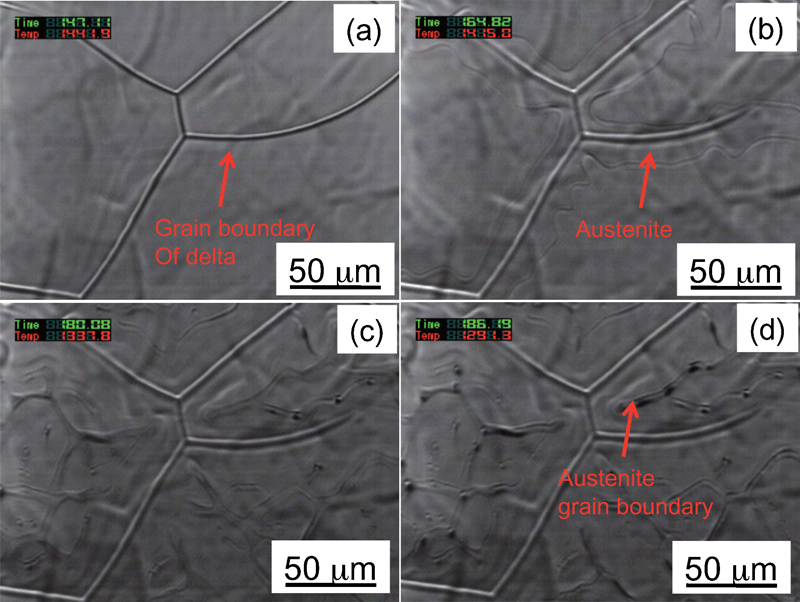
Snapshots of LSCM observations for solid state transformation (δ–γ) of high strength steel during cooling cycle
Solid state phase transformations in carbon steels
Figure 4 shows snapshots of LSCM observations for hypereutectoid carbon steel (0·8C) during a simulated thermal cycle of welding: heating process (Fig. 4a and b) and cooling process (Fig. 4c–f). As shown in Fig. 4b, the specimen was partially melted during heating and then cooled to room temperature at a rate of −22°C s–1. The pearlite nucleated and grew at the triple point of the austenite grain boundaries, as shown in Fig. 4c and d. As the cooling rate was relatively high, the austenite around the pearlite was stable, as shown in Fig. 4d. The stability of austenite suddenly collapsed at 207°C, i.e. the martensitic transformation occurred, as shown in Fig. 4e. The surface relief of the martensitic phase resulted in sharp contrast images.
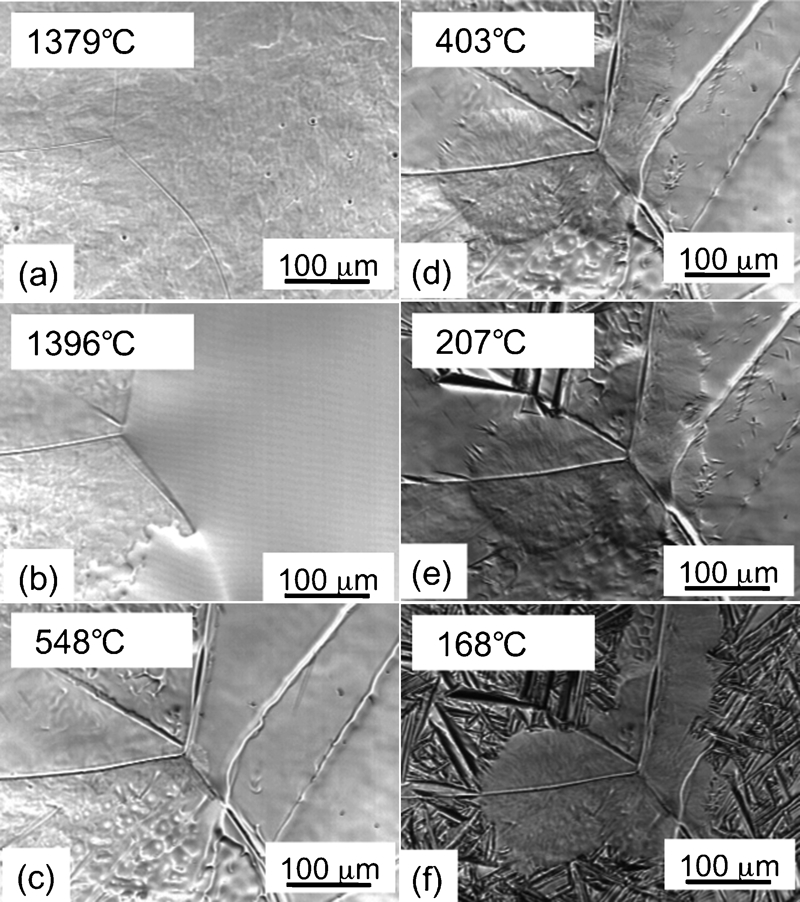
Snapshots of LSCM observations in Fe–0·8C steel during thermal cycle of welding
Figure 5 shows snapshots of LSCM observations for Fe–0·12C steel during the cooling cycle (−1·7°C s–1). At ∼720°C, allotriomorphic ferrite developed along austenite grain boundaries. The contrast of the allotriomorphic ferrite was very weak compared to that of microstructures with surface relief. After that, at ∼690°C, the morphology of the interface changed, and well aligned ferrite plates (Widmanstätten ferrite) developed, with austenite retained between the plates. Using an electron backscatter diffraction technique, Schmidt et al.16 clearly showed that the well aligned ferrite plate has a misorientation relative to the parent allotriomoph. The balance of anisotropic interface energy and segregation behaviour of solute elements determines the growth behaviour of the ferrite plates.17
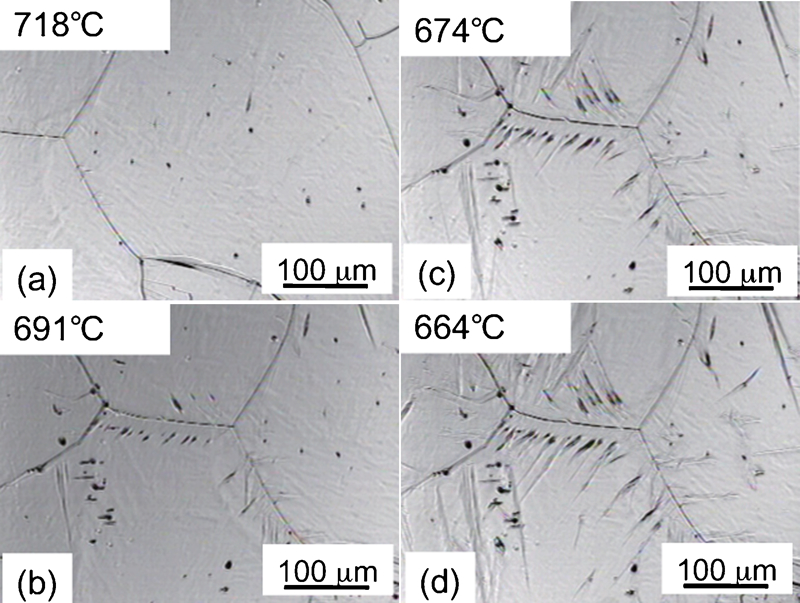
Snapshots of LSCM observations in Fe–0·12C steel during cooling cycle (−1·7°C s–1)
Figure 6 shows the in situ observation of the nucleation of bainitic ferrite in Fe–0·15C steel during the cooling cycle (−8°C s–1). The transformation begins at the grain boundary, as shown in Fig. 6b. Austenite grain boundaries are effective nucleation sites for bainitic ferrites. Figure 7 shows the in situ morphological evolution of bainite transformation during a cooling cycle (552–467°C). It is noteworthy that the nucleation sites of bainite can be classified into the following two categories: grain boundaries and inclusions, where primary bainitic ferrite nucleates, and the surface of primary bainitic ferrite, where sympathetic nucleation occurs. As shown in Fig. 7b, the bainitic ferrite nucleated at the inclusions. Then, the bainitic ferrite nucleated sympathetically on the surface of the primary bainitic ferrite and grew in the same direction parallel to each other; a typical example is shown in Fig. 7c. The bainitic ferrites increased rapidly by sympathetic nucleation, finally resulting in impingement between them. Their interlocking nature and impingement are directly shown in Fig. 7d. As shown in the figure, the bainitic ferrites causing impingement were parallel to each other and grew in the same direction as the primary bainitic ferrite.
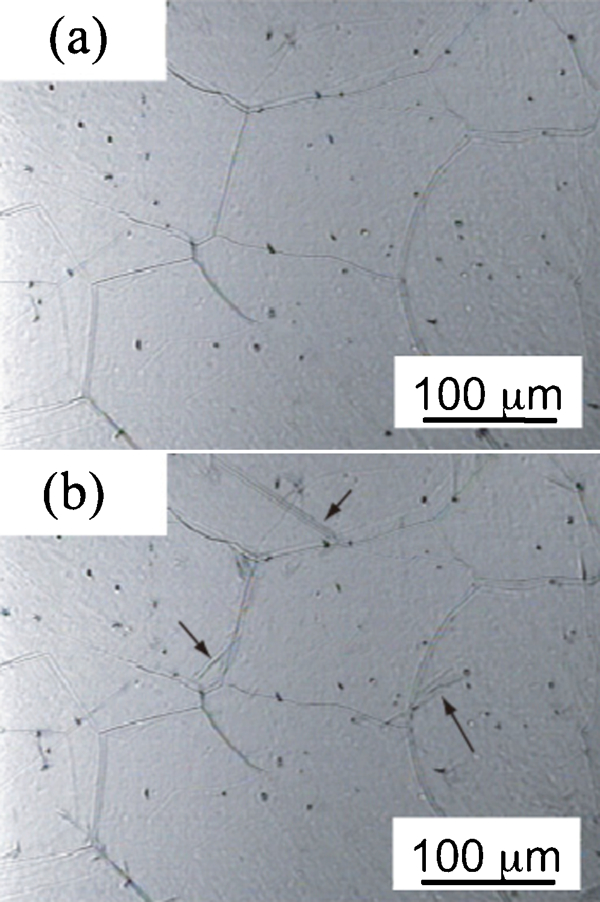
Snapshots of LSCM observation of nucleation of bainitic ferrite in Fe–0·15C steel during cooling cycle (−8°C s–1)
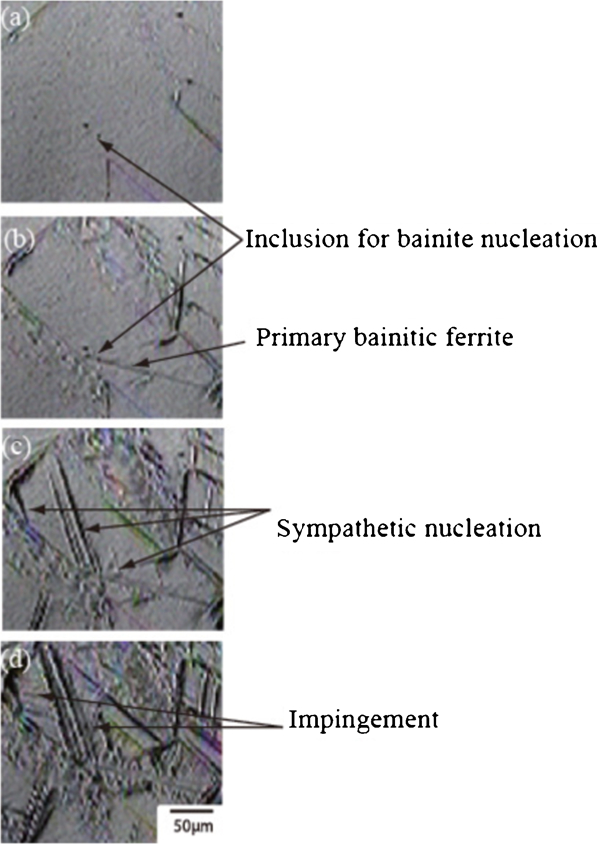
Snapshots of LSCM observations of sympathetic nucleation of bainitic ferrite in Fe–0·15C steel
Conclusions
In this study, the system and techniques of high temperature LSCM were explained in detail for tracking the microstructural changes in steels under various thermal cycles. Snapshots of microstructural changes for the solidification cell, austenite from the δ‐ferrite, pearlite, martensite, Widmanstätten ferrite and bainite were presented as observation examples. Laser scanning confocal microscopy was shown to be suitable for in situ observation of morphological changes in the phase transformations due to rapid temperature response during welding heat cycles. Advanced usage of LSCM for weld research is reported in Part II of this report.