
Abstract
High power ultrasonic technology can currently count on a number of industrial applications. Ultrasonic welding, which is a standard joining technique in many applications on plastics, has few but well established metal applications, such as copper wires, pipes and connectors welding, or, considering spot welding of aluminium thin sheets, is attractive for the automotive industry field, where it could represent a possible cost effective alternative to resistance spot welding, clinching or self‐pierce riveting. The present experimental study is addressed to this kind of application in order to evidence the effects of welding parameters and, most of all, their interactions on the tensile strength of tensile–shear spot welded lap joints. Relevant results have been achieved by dedicated and non‐conventional instrumentations applied to the welder for measuring and controlling the process parameters. The best static performance has been taken as an input for the second part of the study regarding the fatigue behaviour and the joints failure modes.
Keywords
Introduction
The present paper reports the first part of a research carried out by the authors about the application of ultrasonic metal welding (USMW) to lap joints made of AA6022‐T4 thin sheets. The obtained results, together with their own importance, are also the starting point for the second part of the research,1 devoted to the fatigue behaviour and the failure modes of the joints.
USMW is a welding process, which allows joining similar or dissimilar materials:2, 3 the USMW process is successfully applied to plastics, where welding produces a local fusion of the parts, and to metallic alloys, where most of the researchers point out that the solid state is always maintained4– 8 (see the section on ‘Formation of ultrasonic metal spot welded joints’ for details). Ultrasonic welding of plastics is a quite common operation in many fields, from biomedical to automotive, from toys to domestic appliances, packaging and textiles.9– 14 This welding process can be considered as the current standard in many plastic applications for its reliability (plants work continuously at a very high throughput), technical performance (e.g. ultrasonic welded vessels can undertake high pressure) and low cost.
The ultrasonic technique is particularly suitable also for bonding non‐ferrous soft metals and their alloys, such as copper, aluminium, brass, gold and silver. Other materials, such as steel, proved to be weldable by USMW,2 but too long time and too much energy are required to obtain good joints even on thin sheets, preventing the convenience of the process.
Ultrasonic welding is a standard application for light alloys in specific fields, such as electrical wire connections, welding and sealing of copper pipes in air conditioning plants and production of electronic components; USMW has recently become interesting also for the automotive field, where resistance spot welding, usually adopted for steels, is not appropriate for aluminium due to the high thermal conductivity of this material.15, 16
Two different machine configurations are actually applied in the field of USMW: ‘wedge reed’ and ‘lateral drive’.3, 17 Both configurations are widespread in the market. The present study deals with the lateral drive configuration, simpler but only suitable to weld low thickness specimens due to its lower rigidity. Moreover, even if various types of joints can be obtained by USMW (line welds, continuous seam welds and ring welds2, 18), the typical welding layout is more suitable to obtain spot welded lap joints from two or more overlapped thin sheets (usually up to 3 mm of total thickness). This joint configuration is studied in the present paper.
USMW was born in the 1950s in the USA,16– 18 and it was mainly developed in the USSR during 1960s and 1970s.3, 17 The results achieved in those years were obtained using ultrasonic metal welders remarkably different from the current ones since they were based on magnetostrictive transducers.3, 5, 19 The low efficiency of this kind of technology made it inconvenient to produce commercial ultrasonic welders, and this fact probably reduced the interest of researchers in the ultrasonic welding technique. During the last 20 years, this scenario is completely changed by the introduction of piezoelectric transducers, characterised a good efficiency, which allows welds absorbing less than 10 kW and taking less than 2 s.
The research reported in the present paper aimed to contribute to the explanation of the USMW process, carried out by piezoelectric welders, investigating the effect of the technological parameters on the static performance of spot welded lap joints. Starting from the specific literature,4, 6, 8, 15, 17, 19, 20 the present study aims to improve knowledge being designed to statistically evaluate the interactions among process parameters. Such a characteristic makes it more comprehensive and objective in defining and modelling the parameters role.
At the end of this paper, some considerations on the target material have been drawn: a 1·2 mm thick AA 6022‐T4 aluminium alloy is selected because of its wide application in the automotive industry as a structural material for luxury and sport cars15 where, as other types of aluminium alloys, it presents significant challenges due to low and scattered joint strengths when resistance spot welding is applied, and large joint thickness and weight in the case of self‐pierce riveting.
Architecture of employed USMW system and relevant technological parameters
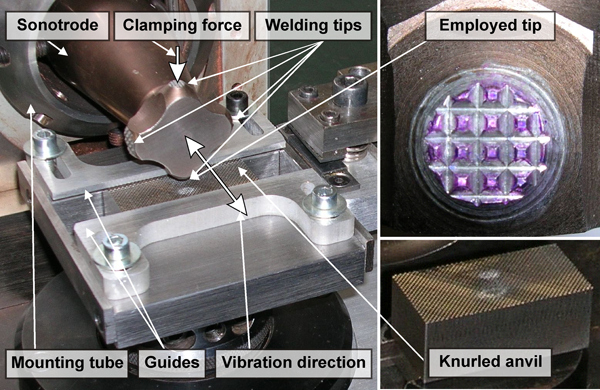
A lateral drive ultrasonic metal welder, as the one employed for the present study, is mainly composed of a power supply and a welding head. The power supply transforms the electrical signal from the network into one characterised by high voltage and high frequency (3 kV and 20 kHz respectively in the studied case). Such a voltage excites a piezoelectric transducer, which turns it into a mechanical vibration with the same high frequency. The produced mechanical vibration passes through a mechanical amplifier, the so called booster, and reaches the welding tool called sonotrode (Fig. 1). Transducer, booster and sonotrode are mechanically connected composing the so called vibrating group, which applies the mechanical vibration and the clamping force to the parts to be welded. It is worth noting that the vibrating group is placed inside the welding head of the welder by means of a clamping system (‘mounting tube’; Fig. 1) designed to avoid the transmission of vibrations to the machine frame.
Lateral drive USMW system available at Politecnico di Milano
The tip of the sonotrode, usually knurled, drags the top plate during the welding process, while the bottom plate is held up by a knurled anvil (Fig. 1). This produces a relative motion between the plates to weld. Moreover, the knurled surfaces of the tip and the anvil penetrate into the plates producing a typical surface texture due to the application of the normal load. In order to determine the correct alignment of the plates, it is also necessary to equip the system with a couple of guides. The whole set‐up of the welder is depicted in Fig. 1.
The relevant process parameters for the employed welder are as follows (Table 1):4, 6, 8, 15, 17, 19
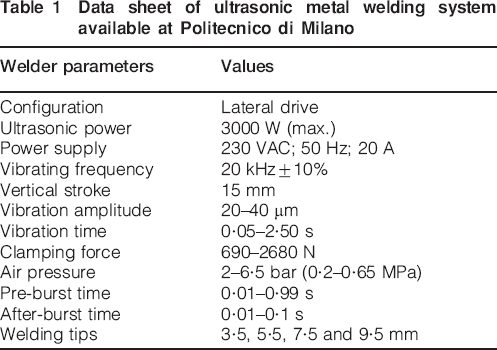
Data sheet of ultrasonic metal welding system available at Politecnico di Milano
the ‘vibration amplitude’
the duration of the ultrasonic vibration (‘vibration time’)
the energy required for a welding cycle (‘vibration energy’). The employed welder allows setting the vibration energy or the vibration time; all the experiments in this work are performed setting the vibration time
the ‘clamping force’ applied to the parts to join. The clamping force can be set to adjust the air pressure in the pneumatic plungers which vertically move the vibrating group
the ‘pre‐burst time’, the period of time between the application of the normal load and the beginning of the vibration
the ‘after‐burst time’, the period of time between the end of the application of the clamping force and a brief ultrasonic impulse, useful for cleaning the sonotrode tip and detach any possible material waste from it.
Researchers agree about the role of the energy transferred to the joint on welding results: USMW is particularly attractive for the automotive field since it requires less energy compared to resistance spot welding (∼5% less) and riveting (∼20% less).15 USMW usually takes ∼1 s to produce a spot weld, and the tool life is particularly attractive (10 000 spots on aluminium and 30 000 spots on copper15). Low amplitudes and low clamping forces require longer times to achieve the maximum weld resistance.19 Optimal process parameters should produce strong plastic deformation without causing cracks and overstressing the target material; relatively high values of clamping forces allow applying higher amplitudes and to achieve a better joint resistance.4 The present study is targeted to objectively evaluate this kind of interactions among parameters.
Formation of ultrasonic metal spot welded joints
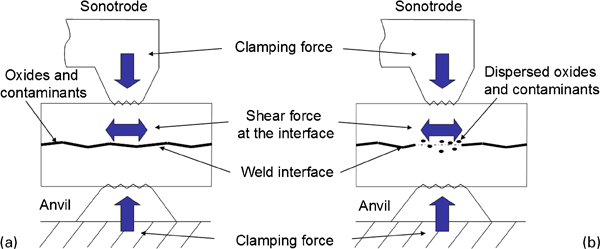
USMW produces a spot welded joint by means of high frequency vibrating shear forces exchanged between the sheet metals being joined while held together by a static clamping force2 (Fig. 2). The interface between the workpieces to join changes during a welding cycle.2, 4, 7, 17, 21
Formation of ultrasonically spot welded joint
The welding process can be subdivided in four main phases:
a static clamping force is applied by the sonotrode to the sheet metals to be joined: protuberances of the two surfaces come in contact, but oxides and contaminants still prevent the parts from bonding
the ultrasonic vibration starts, and the protuberances in contact undergo a shear deformation (Fig. 2a). These contact areas, at first localised in correspondence to very few irregularities, grow in number and size during the ultrasonic vibration, and the friction coefficient increases in this phase20
this process breaks the contaminant layers, and metal to metal contact and adhesion can occur (Fig. 2b). The plastic shear deformation produces heat,4, 15 continuously lowering the yield strength of the material while the weld area grows. Material softening occurs not only due to temperature but also to preferential absorption of acoustic energy at the material dislocations:6, 22 the ultrasonic wave, in fact, is efficiently transferred by a regular metal lattice, but it tends to be absorbed where it presents defects, as in the case of dislocations
at the end of the welding cycle, the contact area and the adjacent areas are completely plastically deformed and composed by recrystallised grains: metallic bonding takes place all over the weld zone under the sonotrode; solid state diffusion between welded specimens can also be observed.2, 3 Figure 3 shows a transversal section of a joint characterised by a deeply deformed welding interface and very small grains: the penetration of the plastic deformation allows a good performance of the joint in terms of tensile strength.
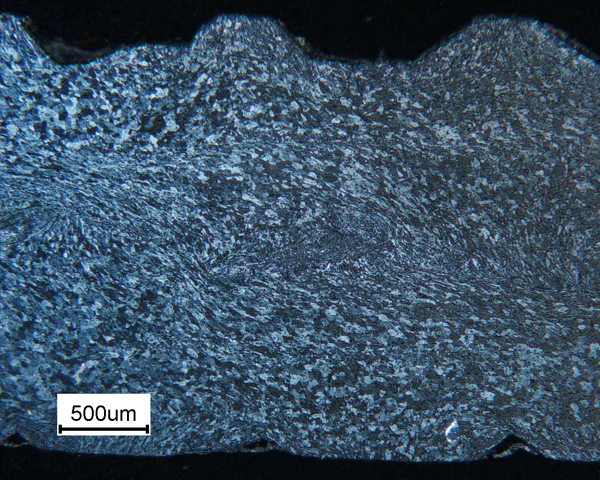
Joint transversal section micrograph after Barkel etchant (×25, polarised light). Welding parameters: vibration amplitude, 40 μm; vibration time, 1·2 s; clamping force, 1130 N; tip diameter, 5·5 mm; vibration direction, transversal; sheet metal preparation, untreated
This description of the ultrasonic welding phenomenon, drawn by de Vries,17 is in accordance to Rozenberg,3 which provides a microstructural interpretation. He indicates how, during the destruction of oxide films (phase iii), the contact surfaces of the specimens appear like amorphised layers with a large number of point and line defects, which give them a high internal energy in terms of gripping propensity. Such gripping, i.e. the formation of metallic bonds, is also promoted by an increase in the probability of coincidence of crystallographic grain orientations on the surfaces to be joined. Moreover, dislocations act as ‘active centres’ in the subsurface layer.
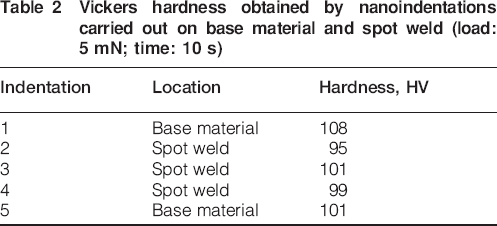
Considering the mentioned welding phases, researchers do not always agree about the role of temperature at the interface. According to many studies, the temperature grows up in the welding zone due to friction and promotes the plastic flow that yields the weld but remains under the melting point.2, 3, 5– 8, 17 This reason makes USMW inherently different from ultrasonic plastic welding, where fusion is responsible for joining. Some other studies indicate that the involved metallic materials locally reach the melting temperature during welding operations, even if they are not able to prove this assumption19 or they base it on the fact that only fusion, followed by resolidification and recrystallisation, can produce the existing fine crystallographic structure at the interface.23 The reason why these studies observed local fusion could be the wrong selection of technological parameters, for example low values of clamping force produce a ‘friction type’ welding and a strong heat formation.6, 24 In any case, it is commonly accepted that USMW can count on a great advantage compared with fusion welding because it seems that no wide heat affected zones (HAZs) take place. In order to experimentally check the validity of this statement, a spot welded joint (made of AA 6022‐T4 aluminium alloy and obtained using the best technological parameters described in the next sections) was sectioned along the longitudinal direction and subjected to a series of nanoindentations on both the base material and the spot weld, so to derive the local profile of the Vickers hardness HV. It is worth mentioning that indentation 4 in Fig. 4 is slightly outside the spot area, while indentations 2 and 3 are close to the spot centre, in order to test the spot hardness in different representative points. The indentations were carried out applying a load equal to 5 mN for 10 s. Table 2 shows the obtained experimental values. It can be seen that it is not possible to observe significant differences between the base material and the weld: the mean value of the local hardness resulted to be ∼101 HV (standard deviation equal to 4·4 HV), very similar to the typical value (80–100 HV) for unwelded aluminium alloys. Even if USMW produces grain refining (Fig. 3), which typically increases the hardness value, it seems that the temperature achieved during the welding operation is sufficient to soften the target material and, probably, to increase the precipitates size inside aluminium grains, preventing them to pin dislocations and consequently increase hardness. This conclusion supports the absence of relevant HAZ, but could also give some indications about the fact that no significant variations in the mechanical behaviour between the base and the welded material take place. The ultimate tensile strength is in fact directly related to HV.
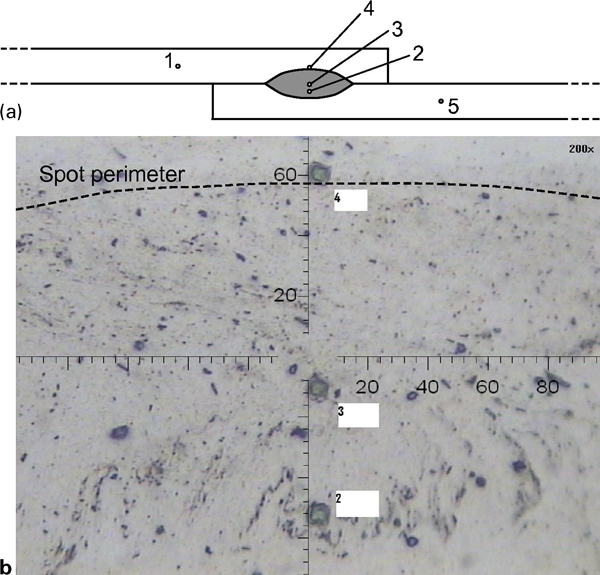
Nanoindentations carried out on lapped longitudinal section of ultrasonic spot weld made of AA 6022‐T4 aluminium alloy
Vickers hardness obtained by nanoindentations carried out on base material and spot weld (load: 5 mN; time: 10 s)
Experimentation
The experimental plan carried out in the present part of the research has the aim to evidence the effect of the most important USMW process parameters (vibration amplitude, vibration time and clamping force) and their interactions on the static mechanical performance of the spot welded joints in terms of ultimate tensile–shear strength. Even if various studies can be found in the literature having a similar purpose,4, 8, 17, 19, 20 none of them present objective results that are able to indicate also the effect of the interactions among parameters, since only one parameter is usually varied at a time. Preliminary tests evidenced how these interactions seem to be very important on the joint mechanical behaviour, so a dedicated experimental factorial plan is designed and carried out.
Specimens for the experimentation are obtained from 1·2 mm thin sheets of AA 6022‐T4 aluminium alloy, typically adopted for structural parts of luxury and sport vehicles.15 The basic mechanical behaviour of the material was derived from five tensile tests carried out on dog bone prismatic specimens obtained from the 1·2 mm sheets. The mean results were as follows: elastic modulus E = 67 212 MPa (standard deviation: 1413 MPa), yield stress Rp 0·2 = 146·8 MPa (standard deviation: 0·84 MPa), ultimate tensile stress = 264·4 MPa (standard deviation: 1·14 MPa) and elongation at failure A = 27·2% (standard deviation: 0·52%).
The drawing of the adopted specimens is reported in Fig. 5. In particular, the overlap between thin sheets is 15 mm, and the spot diameter considered in the present research is always the one obtained from the sonotrode tip having a diameter of 5·5 mm. It is also interesting to note the application of suitable dummy plates to avoid the introduction of secondary bending moments due to the structural misalignment of sheets during tensile–shear tests. Such tests are carried out according to ISO 14273:200325 and ISO 14329:2003,26 regarding destructive tests of resistance spot welds on steel specimens, because no specific standard is found about ultrasonic welding of aluminium. The employed test facility is a servohydraulic MTS ALLIANCE RF/150 equipped with a 5 kN load cell. Tests are carried out under displacement controlled conditions (crosshead speed set at 1 mm min−1). All the tests are performed centring the welded spot between the clamps.
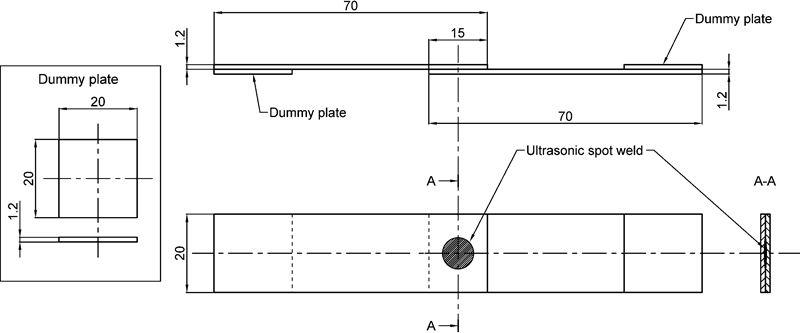
Specimens layout (spot weld diameter≈sonotrode tip = 5·5 mm)
The ranges for the relevant process parameters inside the carried out factorial plan (vibration amplitude, vibration time and clamping force) are first screened considering suitable evaluation criteria:
all experimental conditions have to produce ‘good’ joints (Fig. 6), without typical damages such as ‘sticking’, a condition characterised by a deep deformation or extrusion of the top plate, subsequently welded to the sonotrode tip (Fig. 7)
all welded joints have to resist the operation of clamping on the tensile strength testing machine without breaking
the parameter ranges have to be as large as possible in order to characterise the welding process over the maximum application field.
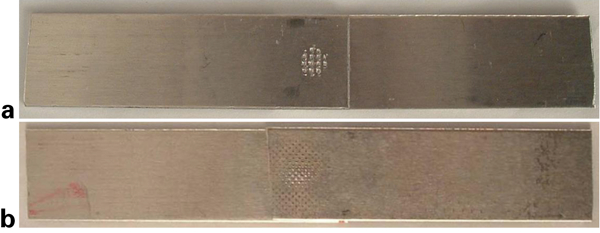
Typical ultrasonic spot welded joint (vibration amplitude: 35 μm; vibration time: 1·4 s; clamping force: 910 N)
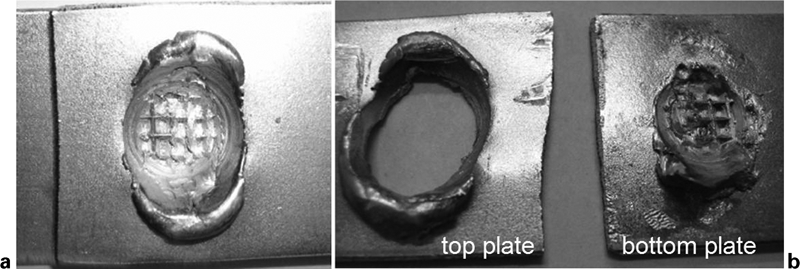
Extruded specimen in case of a sticking, and b drilled top plate and damaged bottom plate
Some preliminary tests allowed quantifying the ranges of the variable parameters (Table 3) and the values of constant parameters (Table 4).
Variable welding parameters of experimentation
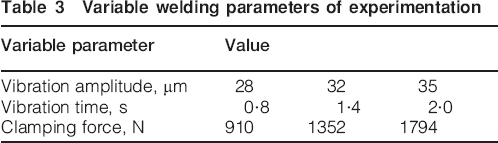
Constant welding parameters of experimentation
Considering the constant parameters, pre‐ and after‐burst times result not to be influent on the joint strength in the preliminary tests; hence, they are fixed at the mean value of such trials. Moreover, the vibration direction is transversally applied (Fig. 1 and Table 4), since this configuration is the most widespread for lateral drive welders in the case of long specimens. Furthermore, specimens are welded without surface pretreatments (such as degreasing and lubricating) since previous studies proved the good resistance of joints obtained in this condition.27, 28 This choice is also supported by some authors who point out that USMW is less sensible to surface preparation than other joining techniques.15, 20 This fact allows reducing costs in the case of welding of untreated workpieces.
Considering variable parameters, three different levels are set for each one of the varying factors. Each combination is then repeated three times, in a random order, for a total of 81 experimental tensile–shear tests.
Particular attention is paid to the repeatability of the experimental conditions during tests through a calibration of different quantities characterising the welding operation on the employed welder. Instantaneous vibration amplitude is measured in real time by a suitable laser triangulation system, developed by the authors in previous studies,29 which is employed to calibrate its actual mean value at the tip of the sonotrode in function of the adimensional value set at the controller. The air pressure producing the clamping force is calibrated before the experiments according to manufacturer's instructions by means of a dedicated load cell. Finally, the vibration time is set at the welder controller and verified for all trials analysing the amplitude signal acquisitions, from which the starting and the ending instants of each welding operation is clearly detectable.29 The mentioned calibration procedures make the experimentation repeatable on other welders.
Results
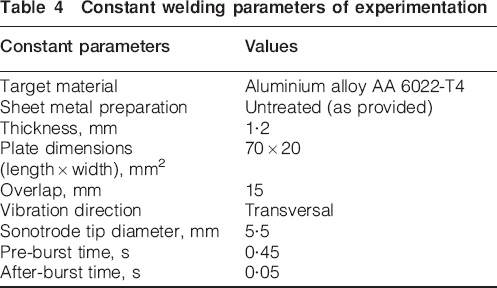
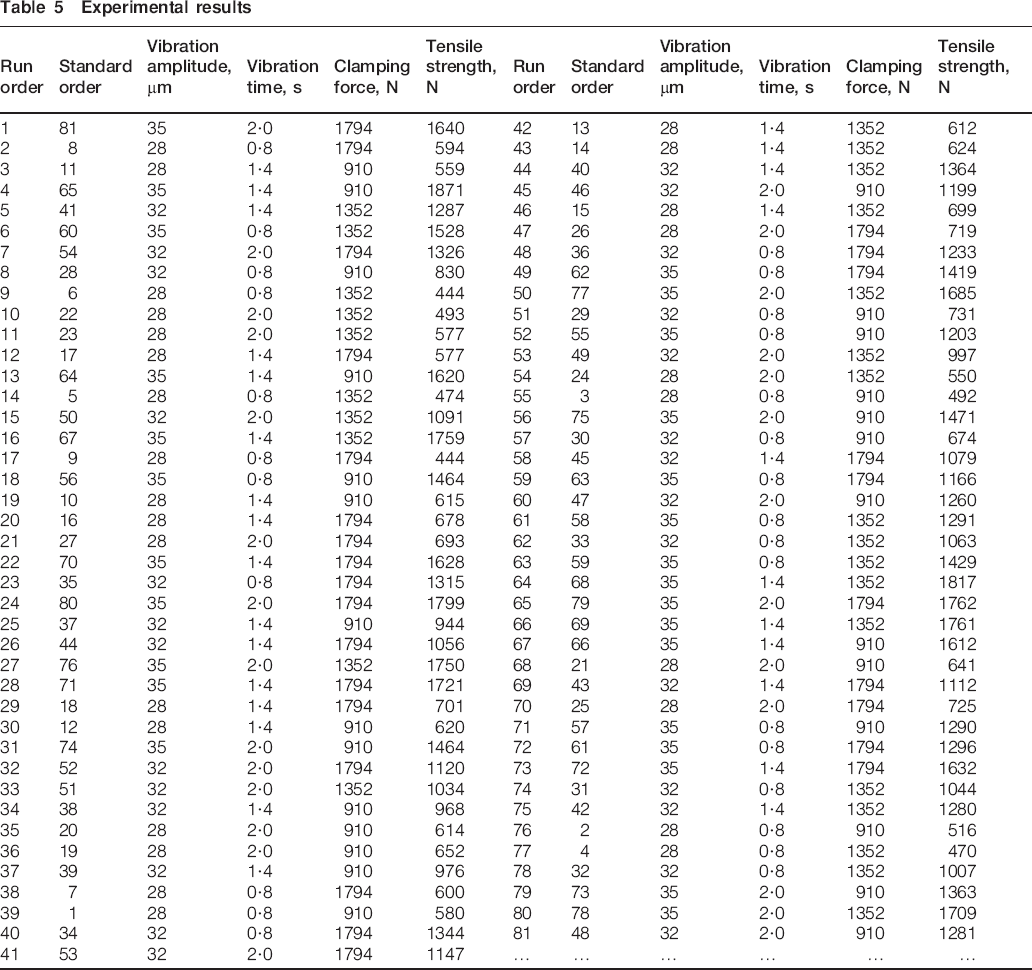
Experimental results for all the carried out tests are reported in Table 5. Load–displacement curves are recorded for each experimental run. Figure 8 depicts one curve per experimental condition of the carried out plan, together with the condition, presenting the maximum tensile strength (run order: 4; vibration amplitude: 35 μm; vibration time: 1·4 s; clamping force: 910 N).
Load–displacement curves at different vibration amplitudes: one curve per each experimental condition of plan (Table 3) is reported, together with maximum strength curve (condition 4)
Experimental results
Some considerations can be drawn:
the load–displacement curve for the best condition presents a ductile behaviour of the joint indicating how this behaviour could be suitable to achieve good joint strengths. This consideration is confirmed by the other curves found in Fig. 8; in fact, it is possible to notice how conditions which reach the highest values of tensile strength show also a ductile behaviour
the best experimental condition in terms of tensile–shear strength is not obtained for the highest value of the considered process parameters (Table 3), which means that the combination presenting the maximum energy content is not the best in terms of joint resistance; this fact could indicate possible interactions among process parameters or nonlinear effects
the vibration amplitude seems to be effective on the tensile strength: Fig. 8 shows how, by grouping curves by the vibration amplitude, it is possible to clearly detect the tensile strength relationship with this process parameter; the following statistical analysis objectively proves this observation.
Analysis of variance (ANOVA)30 is applied to statistically evaluate experimental results. It is a statistical method useful to determine the effect of the factors (vibration amplitude, vibration time and clamping force in this case) on the response variable (tensile–shear strength in this case) by partitioning the experiment total variability into its component parts.
The carried out experiments have been arranged in a factorial plan with three levels of each factor (Table 3). All factors in the plan are fixed since their levels are selected by the authors. This way, conclusions only apply to such levels; in the case of fixed factors, it is easy to formulate and test hypotheses about the main effects (defined as individual effects of each factor or as change in the response produced by a change in the factor level) and interactions (which can be thought as the failure of one factor to produce the same effect on the response at different levels of another factor). For a fixed effect model, test statistics for each main effect and interaction may be constructed by dividing the corresponding mean square MS (defined as the factor sum of squares SS divided by the factor degrees of freedom (df), where the first term is the sum of squares of differences between factor level means and overall mean) by the mean square error (estimate of the variance due to random errors). Large values of this ratio (showing an F distribution) imply that data do not support the null hypothesis, which, in the ANOVA method, is that the factor effects and interactions are equal. In other words, the factor is significant.
The number of degrees of freedom df for any main effect is the number of levels of the factor minus 1 (2 in this case), and the number of df for an interaction is the product of the number of df associated with the individual components of the interaction (4 in this case). The total number of df is 27 (number of conditions) multiplied by 3 (replicates) minus 1, i.e. 80; as a consequence, the error has 62 df (Table 6). In order to complete the description of Table 6 contents, the following parameters are defined:30 S is the estimate of the standard deviation of observations [S = square root of the error MS = (12 286)1/2 = 110·844], and Rsq is the proportion of the variability in the data ‘explained’ by the ANOVA; therefore, it always increases as terms (factors) are added to the model [Rsq = (total SS−error SS)/total SS = (14 821 695−761 757)/14 821 695] and Rsq(adj) reflects the number of factors in the model; therefore, it is useful to evaluate the impact of increasing or decreasing the number of model terms (factors). When Rsq and Rsq(adj) differ dramatically (which is not the case of the presented experimentation), there is a good chance that non‐significant terms have been included in the model.
Experimental tensile–shear strength ANOVA analysis results (values in newton; F, value of Fisher statistic30)
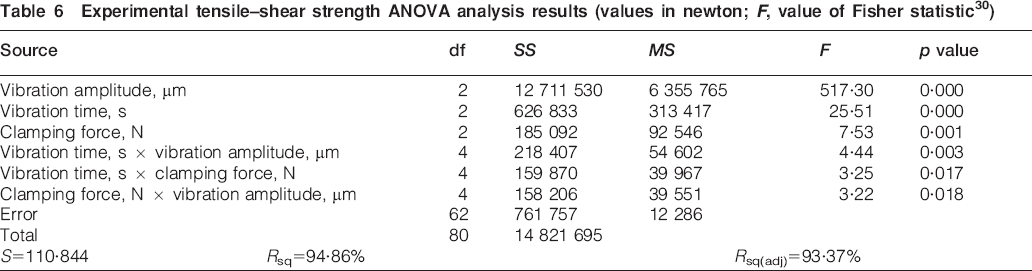
A significance level α = 0·05 is set to evaluate the F tests results; however, since six tests are simultaneously carried out (Table 6), it is divided by 6 when a single test is considered (Bonferroni method); α represents the probability of the type I error, i.e. the probability to reject the null hypothesis when it is true, i.e. to conclude that a factor is significant when it is not. The p value is the smallest level of significance that would lead to rejection of the null hypothesis, i.e. the smallest level α at which the data are significant. The smaller the p value, the stronger the rejection of the null hypothesis, which means that the factor is more significant.
Considering the obtained results (Table 6), the ANOVA of the acquired tensile–shear strength values evidence how the vibration amplitude factor is the most effective process parameter in the studied ranges, even if vibration time and clamping force are also significant. This fact is confirmed also by the main effects plot, the plot of the means at each factor level, as shown in Fig. 9.
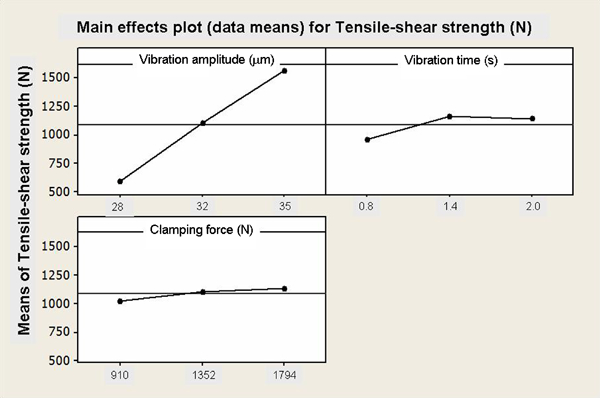
Main effects plot for experimental tensile–shear strengths
The interaction between vibration time and amplitude is actually significant (p<α/6), while the other two interactions are not, even if they are close to the threshold. This confirms that vibration amplitude and vibration time not only play a separate role on the tensile strength but also interact for the determination of the strength results. It is worth noting that such interaction is negative at high values of vibration time, since the tensile–shear strength reduces more than expected considering the main effects of vibration amplitude and vibration time separately (Fig. 10). This fact indicates how high values of vibration time are not useful or even detrimental, in accordance with the literature,4 where it is pointed out as high values of parameters may cause cracks in the produced joint, thus reducing its strength.
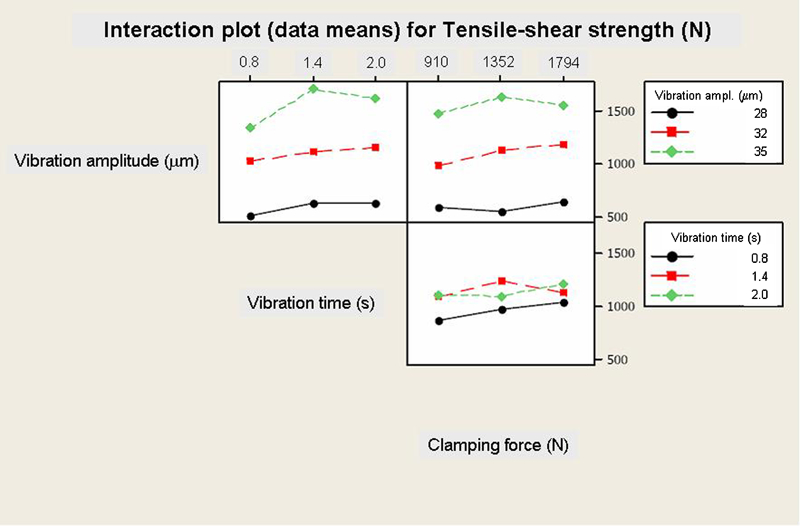
Interaction plot (means for each factor level with level of second factor held constant; useful to judge interactions) for experimental tensile–shear strengths
Carrying out the Tukey's test,30 which is a mean multiple comparison test allowing examining which means are different and to estimate by how much they are different, the experimented factor level means are checked, concluding that, in order to increase the joint tensile–shear strength, it is useful to increase the vibration amplitude at its maximum level (35 μm) since the difference with the other two levels (28 and 32 μm) is statistically significant (see also Fig. 8). Considering the other two factors, it is not useful to increase them to the maximum tested value since no significant difference is revealed comparing to the first mean; hence, it is possible to obtain the maximum tensile–shear strength without pushing on the applied normal force and keeping the cycle time low. These considerations are important since lower times mean higher productivity and lower clamping forces mean lower stress on the welder components.
The present experimental results confirm the importance of keeping into account interactions among parameters, as the reference literature points out, without reporting objective statistical analyses (see the section on ‘Architecture of employed USMW system and relevant technological parameters’). Unfortunately, it is not possible here to compare the tensile–shear strength results to the ones reported in the literature since many results of the papers cited in the present study are obtained adopting different welder configurations (wedge reed instead of lateral drive or magnetostrictive transducer instead of piezoelectric transducer) and/or different target materials and/or specimens dimensions.
Conclusions
The present paper aims to contribute to the basic studies on ultrasonic spot welding of metals by means of the objective statistical analysis of the tensile–shear strength results obtained from 1·2 mm thick AA 6022‐T4 spot welded lap joints. The results can be summarised as follows:
Ultrasonic metal welding, contrarily to fusion welding, does not seem to introduce relevant HAZ. In particular, the HV nanohardness values of the base and welded materials are similar and correspond to the typical values of unwelded aluminium alloys.
The vibration amplitude shows the maximum influence on the tensile–shear strength of welded joints but also the effect of the vibration time and clamping force are generally significant, even if their magnitude is lower.
All possible interactions between parameters seem to play a relevant role on the tensile–shear strength: in particular, the interaction between vibration amplitude and time is the strongest one in the studied ranges. This proves that it is not correct to carry out experimentations where only one welding parameter is varied at a time.
The welding parameters repeatability is introduced and developed in the present study using careful welder calibration and monitoring. This makes the obtained results generally applicable even to other studies or literature as long as the experimental conditions, such as welder type, target material and specimen geometry, are coherent to the present study.
The results obtained in this first part of the research are the starting point for the second part,1 which is focused on the fatigue behaviour and the failure modes of tensile–shear ultrasonically spot welded lap joints.
Footnotes
Acknowledgements
The authors are grateful to F. D'Errico, N. Lecis and D. Ferrari for their invaluable support.