
Abstract
Neutron diffraction is an important tool for residual stress measurement in welded structures. The calculation of stresses from measured lattice spacings generally requires the stress free lattice spacing a priori. For dissimilar metal welds common to nuclear reactor pipeline systems, the stress free lattice spacing is a complex function of position due to the chemistry and microstructure inhomogeneity in the weld region, and its experimental determination can be both time consuming and unreliable. An improved approach is developed to calculate the residual stress field without the use of stress free lattice spacing. Its applicability is examined and justified in two multipass dissimilar metal welds made of 304L stainless steel plate and nickel alloy 82 filler metal using different heat inputs. The spatial variation in stress free lattice spacing is qualitatively discussed using the weld metal dilution mechanism. The improved approach is shown to be simple and practical for residual stress determination in dissimilar metal welds.
Keywords
Introduction
The intense heating and cooling cycles experienced during welding alter the microstructure of the base material and induce residual stresses.1, 2 Weld residual stresses have crucial influence on the structural integrity, such as stress corrosion cracking and high cycle fatigue.3 Over the past decades, there have been significant advances in understanding and controlling residual stresses through experimental measurements4– 11 and computational modelling.12– 14
This paper focuses on neutron diffraction for the determination of weld residual stresses.
8
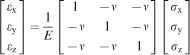
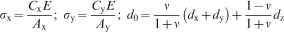
8,9 In the experiment, the lattice spacing (d spacing) for a particular crystallographic plane (hkl) is measured at a given location in three orthogonal directions (designated as the x, y and z directions). The elastic strains at that location are calculated as the changes in d spacings from the stress free to the stressed state8, 9

The residual stresses can be calculated using Hooke's law of linear elasticity written in matrix form8, 9
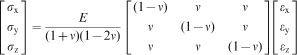
Equation (1) shows that d0 is a prerequisite to determine the residual stresses. Generally speaking, d0 depends on the microstructure and chemistry of materials. In a dissimilar weld, the filler metal and base metal have different chemistries, and the resulting weld composition and microstructure change considerably from location to location. Therefore, d0 can differ considerably from the weld metal to the base metal. Researchers in the past recognised the importance of d0 in neutron diffraction for residual stress measurement and used different approaches to address it. Holden et al. measured d0 in comb shaped reference samples taken from a companion weld.16 By assuming a plane stress state, Staron et al. calculated the residual stresses across the friction stir welded aluminium sheet.17 Woo et al. developed a procedure to decompose thermal and elastic strains from the measured d spacing changes.18 Withers et al. provided a comprehensive discussion on methods for obtaining d0.19 There are a few published works on determining residual stresses in multipass dissimilar metal weld without the use of d0.
Among different techniques, direct measurement of d0 distribution in reference comb cut from a notionally identical companion weld is perhaps considered to be most applicable for weld residual stress and has been used in several studies.16, 19 Although conceptually simple but experimentally time consuming, creating such an identical companion weld can often be practically impossible due to the randomness nature of the welding process. For instance, Elmer et al. reported that the fusion line can fluctuate ±0·25 mm side to side in carefully controlled gas tungsten arc welding.20 In the case of dissimilar weld, the mixing and dilution of filler metal and base metal with distinctly different chemistries are expected to amplify the local random variations in two welds or even in different segments of the same weld. Therefore, the d0 in the companion weld may not represent that in the main weld.
In this study, an improved analysis procedure for computing residual stresses from neutron diffraction data without the use of d0 is developed. It is applied to calculate the distribution of longitudinal and transverse residual stresses in dissimilar metal welds made of 304L stainless steel (SS) base metal and nickel alloy 82 filler metal.
Analysis procedure
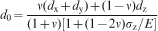
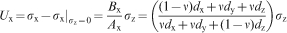
The present analysis procedure is based on the assumption that one of the stress components is known, including the cases where its value is zero or negligible compared to the other stress components. It only requires the measurement of three d spacings (dx, dy and dz) at the stressed state. Without losing generality, let the normal stress component σz to be known. This makes it possible to determine the two in-plane stress components σx and σy and d0 using equations (1) and (2). Rearranging those two equations results in


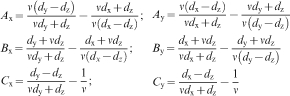
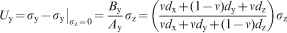
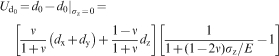
It is noted that equation (4) is valid as long as σz is known. Comparing equations (4) and (6), it is possible to quantify the uncertainty (or error) in the calculated in-plane stress components σx and σy and d0 due to the simplification of zero normal stress. These uncertainties are given as
 are the uncertainties in σx, σy and d0 respectively.
Welding experiments
Figure 1 illustrates the configuration of dissimilar metal welds fabricated on 304L SS plate. The longitudinal x direction is the same as the welding direction, and the normal z direction is the plate thickness direction. The 304L SS plate had a thickness of 15·2 mm (0·6 in), a width of 279·4 mm (11 in) and a length of 355·6 mm (14 in). An upside down trapezoid shape groove with a depth of 10·2 mm (0·4 in) was machined, and gas metal arc welding using alloy 82 filler wire was used to fill up the groove. The SS plate was heavily constrained to an aluminium backing plate during welding and in the neutron diffraction measurement later on. Two welded plates are considered in this study. The first plate, designated as P-3, used 11 passes with an average heat input of 1132 J mm−1. The second plate, designated as P-4, used seven passes with a higher average heat input of 1940 J mm−1. The cross-sections of P-3 and P-4 welds are shown in Fig. 1.
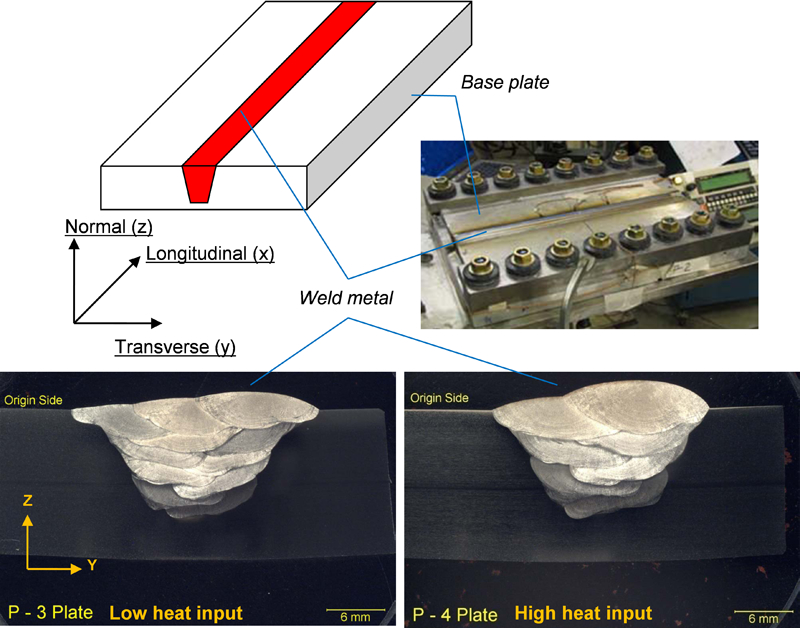
Dissimilar metal weld of nickel alloy 82 filler metal on 304L SS plate
Neutron diffraction measurement
The neutron diffraction measurement was carried out at a high flux isotope reactor facility in Oak Ridge National Laboratory as a part of the Electric Power Research Institute and the US Nuclear Regulatory Commission Joint Welding Residual Stress Validation Program.21 Figure 2a shows the measurement locations on a transverse plane, located halfway between the weld start and stop, for the P-4 plate. The measurements were done at seven vertical lines in the normal direction, where line 4 was positioned at the centre of the groove (i.e. Y = 0 mm). At each location, the d spacings in the longitudinal, transverse and normal directions were determined. The gauge volume, schematically represented as diamond, was about 2×2×2 mm. The dark coloured diamonds represent the measurements in the base metal. The light coloured diamonds correspond to the measurements in the weld metal, where the composition depends on the extent of weld pool mixing between the base and the filler metal. A nearly identical scanning pattern was used for the P-3 plate. In addition, d0 distributions were determined in the stress free combs electrodischarge machined from the companion welds to P-3 and P-4.
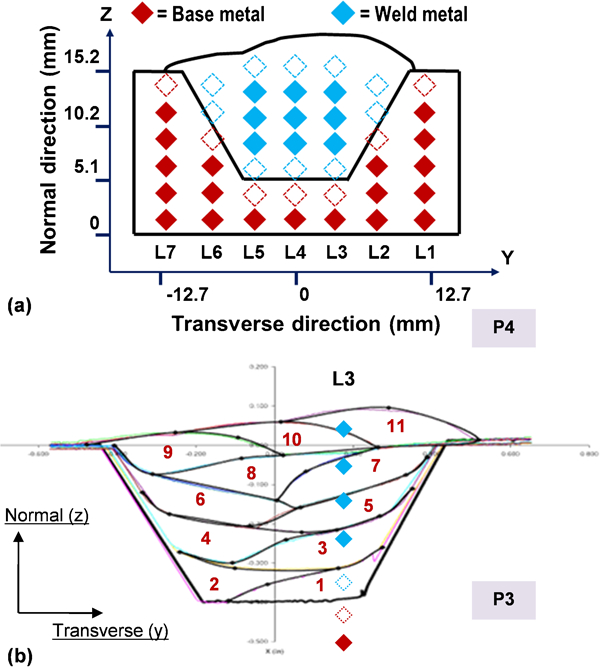
a schematic drawing of measurement locations in P-4 dissimilar weld and b laser profilometry data showing welding pass sequence for P-3 and measurement locations in line L3
In Fig. 2a, dashed hollow diamonds highlight two groups of measurements with relatively high uncertainty in d spacing. The first group is near the top surface, where the uncertainty is due to the challenge in precisely positioning the gauge volume near the surface. The second group is near the fusion line, where the uncertainty is caused by the overlapping diffraction peaks of the base and weld metals co-existing in the gauge volume (both have face centred cubic crystal structure at room temperature). Since the purpose of this study is to validate the improved procedure for calculating residual stress without d0, only the measurements shown as solid diamonds are considered to minimise the error due to the uncertainty in measured d spacings.
Results and discussion
Stress free lattice spacing
Figure 3 plots the d0 distribution in the two dissimilar metal welds. The calculated d0 is obtained using equation (6) from the three measured orthogonal d spacings in the dissimilar welds (with residual stresses). The measured d0 was obtained from the stress free combs, where the upper error bar, lower error bar and solid dot correspond to the maximum, minimum and average d0 values of the three orthogonal measurements respectively. The calculated d0 is highly consistent with the measured d0 for P-3. For P-4, the calculated d0 is on the lower bound of measurement, and the consistency is slightly worse. Also noted is the larger scattering in the measured d0 for P-4 than P-3.
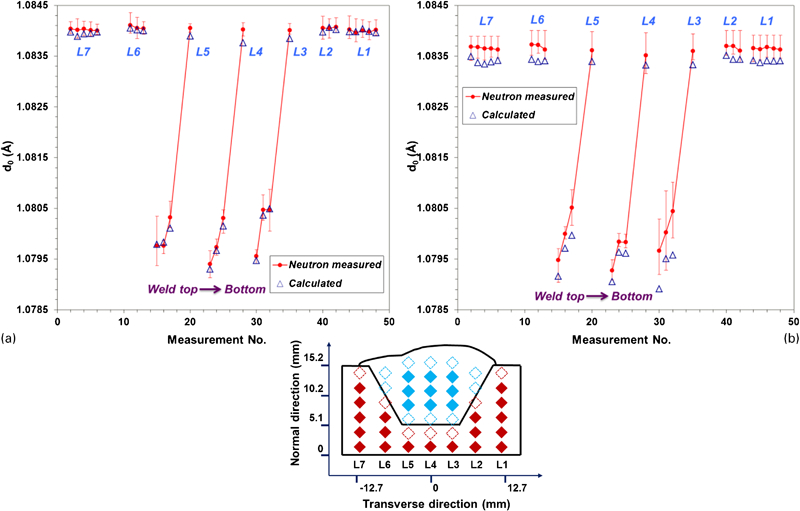
Comparison between measured d0 using neutron diffraction in reference comb and that calculated using equation (6) in a P-3, low heat input and b P-4, high heat input
Figure 3 shows that the minimal d0 of 1·079 Å was near the top surface of weld metal, the maximum d0 of 1·084 Å was in the base metal and d0 decreased continuously from the bottom to the top. This seemly small variation, i.e. 0·005 Å, can correspond to a change of several hundreds of mega pascal in the calculated residual stresses, as indicated by equation (2). The d0 variation can be explained using the following weld metal dilution mechanism. Figure 2b shows the cross-section of P-3, where the welding sequence is highlighted. The deepest measurement location for line 3 was positioned inside the base metal, and d0 at that location is the same as 304L SS. As the measurement location moved upward, it crossed passes 1, 3, 5, 7 and 11. The chemical composition for each weld pass depended on the amount of melted base metal versus that of the deposited filler metal, as the weld pool was well mixed due to vigorous circulation.22 The later a pass was deposited, the closer its composition was to the filler metal (i.e. less dilution), since a smaller amount of base metal was melted into the weld pool. Hence, d0 increasingly approached that of alloy 82 as the depth decreased. The above discussion implies that alloy 82 has a smaller d0 than 304L SS. This is consistent with the literature data: Panneerselvam et al. 23 and Boeuf et al. 24 reported the (100) lattice parameter of 3·546 and 3·610 Å for alloy 82 and 304 SS respectively at room temperature.
Figure 3 shows a similar distribution of d0 in the two dissimilar welds, suggesting that the heat input may have a small influence on the d0 variation. This observation is supported by the above dilution mechanism, since the extent of dilution is likely to be comparable in the two welds due to the similar amount of filler metal added into the groove.
Weld residual stresses
The distributions of longitudinal residual stresses for P-3 and P-4 are plotted in Fig. 4a and b respectively. These plots compare the conventional approach based on Hooke's law with measured d0 on combs against the improved approach of equation (6). In general, the stresses determined using the two approaches are consistent. For both P-3 and P-4, high tensile stress ∼400 MPa is observed near the weld top surface, and it drops to almost zero near the bottom surface. The influence of heat input on longitudinal stress is not pronounced. Figure 4c and d compares the distributions of transverse residual stresses calculated using the two approaches, which show slightly better agreement than the longitudinal stress distributions. The transverse stress varies from around +300 MPa (tensile) near the top to −400 MPa (compressive) near the bottom. Its distribution also does not exhibit strong dependence on the heat input based on the two plates studied.
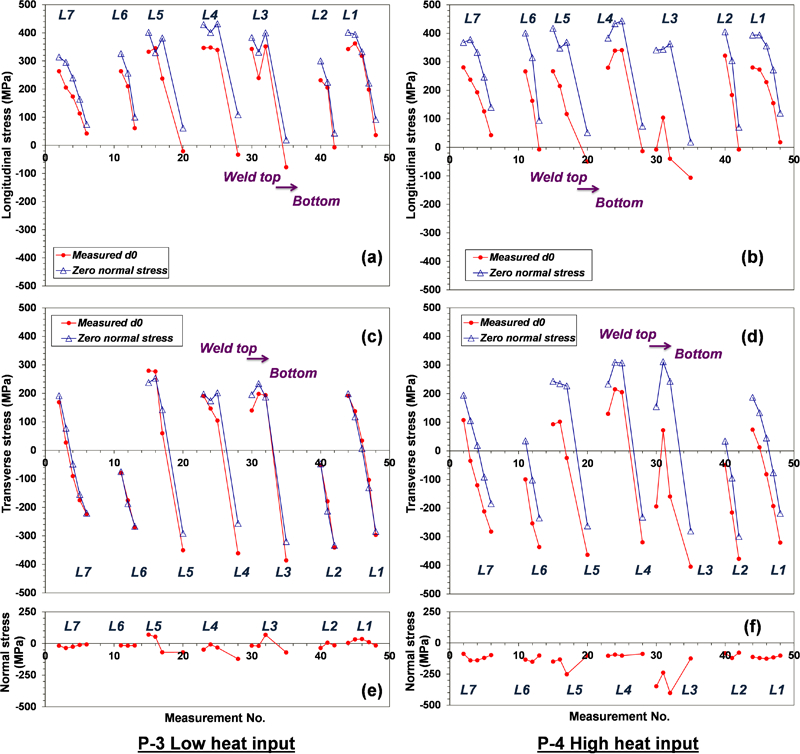
Distribution of longitudinal, transverse and normal residual stresses for P-3 and P-4: curves labelled ‘measured d0’ and ‘zero normal stress’ were calculated using Hooke's law with measured d0 on comb and using equation (6) respectively
Figure 4 indicates the consistency in longitudinal and transverse stresses calculated using the two approaches is much better for P-3 than for P-4. The larger difference may be attributed to the higher apparent normal stresses for P-4 shown in Fig. 4f, as determined by the conventional approach utilising d0 measured in the comb. It is noted that two independent finite element simulations predicted small normal residual stresses at the measurement locations for both P-4 and P-3.21 Hence, it is possible that the existence of high apparent normal stresses in P-4 is unrealistic and is caused by the d0 measurement error in the comb.
As shown in Fig. 3, the measured d spacing is ∼1·082 Å. It can be readily shown that equation (7a) becomes Ux≈σz. A similar equation can be obtained for Uy. Therefore, the error in σx or σy is the same as the value of normal stress. As revealed by extensive data from both experimental measurement and computational modelling,9– 14 the magnitude of the normal stress is typically much less than that of the longitudinal and transverse stresses and near zero for many welding conditions, especially welds on thin plates or pipes. Assuming that the normal stress is ±50 MPa, the uncertainty in calculated in-plane stresses due to zero normal stress simplification is therefore ±50 MPa. Such uncertainty is comparable with that inherent to the neutron diffraction experiment. For instance, Holden et al. reported that the experimental uncertainty is about ±25 MPa.16 From equation (7c), it can be shown that the uncertainty in the calculated d0, due to an uncertainty of ±50 MPa in the normal stress, is ±1·08×10−4 Å, which is also comparable with the typical neutron diffraction uncertainty.16 The good consistency for P-3 indicates that the improved approach is a practical method for determining two in-plane residual stress components without the need of d0 for dissimilar welds, where normal stress is small.
Residual stresses from neutron diffraction versus other techniques
Figure 5 compares the weld residual stress profiles at line 4 (centreline) of P-3 obtained using three different techniques:
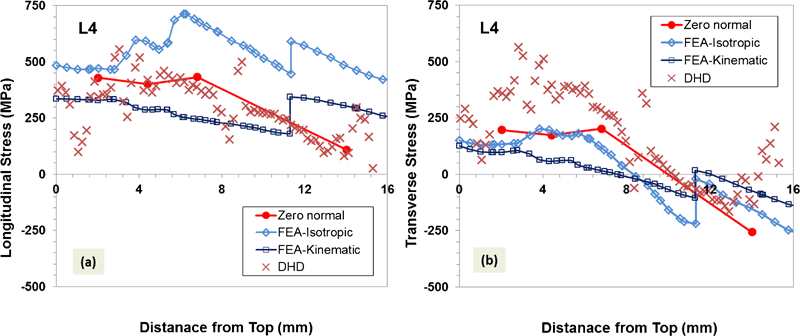
a longitudinal and b transverse residual stresses at line 4 of P-3: curves ‘Zero normal’, ‘FEA-Isotropic’, ‘FEA-Kinematic’ and ‘DHD’ are from improved approach, weld model with isotropic hardening, weld model with kinematic hardening and deep hole drilling technique respectively
neutron diffraction with improved data analysis approach
finite element weld simulation21
deep hole drilling (DHD).21
Line 4 passes through the weld metal, the heat affected zone and the base metal in the dissimilar weld. Relatively large scattering was found in the stresses determined from DHD. There is a large difference between neutron diffraction and DHD near either weld top or bottom surface. In the bulk of plate, the residual stresses from both experimental techniques are fairly consistent, i.e. the stresses become more compressive as the depth increases. It is worth noting that the plane stress assumption, used in the improved approach, is also employed by DHD.6, 7
The weld residual stress, predicted using a thermal stress finite element model, is superimposed in Fig. 5. Two hardening behaviours of material stress–strain curves were used in the model: isotropic versus kinematic hardening.21 As shown in Fig. 5a, the longitudinal stresses predicted using isotropic hardening are higher (more tensile) than those from neutron diffraction, whereas those using kinematic hardening are lower. The consistency between the weld model and neutron diffraction is somewhat better for the kinematic hardening case. The transverse stresses, predicted using the two hardening behaviours, are fairly similar, as shown in Fig. 5b. The neutron diffraction data agrees slightly with the isotropic case than with the kinematic case. The transverse stresses from DHD are more tensile than those from the model and neutron diffraction, especially at the top half of weld.
Figure 5 shows the significant influence of the material hardening behaviour on the residual stresses predicted by the weld model. Unfortunately, material stress–strain relationships, especially those at high temperatures, are oftentimes unavailable, incomplete or inconsistent. Therefore, it is important to continuously improve the accuracy of neutron measured residual stress for the purpose of validating the weld model and material properties.
Conclusions
An improved analysis procedure has been developed for determining longitudinal and transverse weld residual stresses from neutron diffraction data without the knowledge of stress free lattice spacing (d0) a priori. It is applied to analyse the residual stresses in two dissimilar metal welds made of 304L SS base metal and nickel alloy 82 filler metal. The following conclusions can be drawn.
There is significant spatial variation in d0 in the dissimilar welds, largely due to the change of weld metal dilution from location to location. The calculated d0 using the improved approach is in good agreement with that measured in the combs, indicating the validity of the approach.
Consistency is found in the general trend of through thickness distribution of longitudinal and transverse residual stresses determined using different techniques, including neutron diffraction, weld modelling and DHD. High tensile stresses are observed near the weld top surface. The residual stresses become more compressive as the depth increases.
For the two welded plates studied, the heat input does not have a pronounced effect on σx, σy and d0. One possible explanation for the similar residual stresses in P-3 and P-4 is that the plate is so heavily constrained that the stress cannot be relaxed by deformation.
This simple and practical approach is advantageous in many welding conditions, especially welds on thin plate or pipe, where the normal stress is expected to be small. Future work is planned to develop a new data analysis approach that is valid for welds where large normal residual stress exists. A final note is that the improve approach is still subject to experimental error in the measured d spacing.
Footnotes
Acknowledgements
This research is sponsored by the Laboratory Directed Research and Development Program of ORNL, managed by UT-Battelle, LLC, for the US Department of Energy. The neutron diffraction and deep hole drilling data are provided by the EPRI and the US NRC Joint Welding Residual Stress Validation Program.![]() The authors would like to thank Dr David Rudland of US NRC for sharing the predicted weld residual stresses. Finally, the authors appreciate valuable discussion with Dr Camden Hubbard of ORNL, Dr Mathew Kerr of US NRC and Mr John Broussard, III and Mr Matthew Klug of Dominion Engineering, Inc.
The authors would like to thank Dr David Rudland of US NRC for sharing the predicted weld residual stresses. Finally, the authors appreciate valuable discussion with Dr Camden Hubbard of ORNL, Dr Mathew Kerr of US NRC and Mr John Broussard, III and Mr Matthew Klug of Dominion Engineering, Inc.