
Abstract
The aim of this investigation is to study the effect of geometric tool parameters on mechanical and microstructural behaviours during dissimilar friction stir welding of 5 mm thick plates of AA 5086-O and AA 6061-T6. Three tool geometries were used, including a tool with a concave shoulder and a conical probe with three grooves, flat shoulder and threadless cylindrical probe, and a tool with a flat shoulder and a threaded cylindrical probe. It was found that the tool with a concave shoulder and a conical probe with three grooves produces higher heat input and temperatures that provides more homogeneous stir zones than the other tools. In addition, the grain sizes of the stir zone in the AA 6061 side of all the welds are finer than those produced in the AA 5086 side, and decreasing the weld pitch, i.e. a ratio of welding to rotational speed, results in coarser grain structures in the stir zone.
Keywords
Introduction
In the last decade of the twentieth century, The Welding Institute, UK, patented a novel solid state joining technique, i.e. the friction stir welding (FSW) process.1 Accordingly, successful works have been performed to investigate various aspects of this process, and it is established that heat generation and material flow in the weld nugget during welding as well as weld quality are strongly dependent on the pin and shoulder parameters of the FSW tool.2 However, according to the literature, there are limited works on the effect of geometric tool parameters on the FSW of AA 6xxx and AA 5xxx series. Elangovan et al. 3 3,4 studied the influences of welding speed and geometric tool parameters on friction stir (FS) zone formation in the FSW of AA 6061. They did welds using five different tool pin profiles with three different shoulder diameters and three different axial force levels. They showed that a square pin profiled tool with a shoulder of 18 mm diameter produced mechanically sound and metallurgically defect free welds compared to the other employed pin profiles. Scialpi et al. 5 studied the mechanical properties and microstructural issues of 1·5 mm thick FS welded AA 6082-T6 joints utilising different tools. They showed that the welds performed using a tool with a fillet and cavity shoulder have better properties than other welds. Fujii et al. 6 considered the effect of tool shape on the mechanical properties and microstructures of FS welded AA 6061-T6 and AA5083-O FS welded joints. They reported that the tool shape has little effect on the microstructures and mechanical properties in AA 6061-T6, while in AA 5083-O with higher flow stresses, the weldability is significantly affected by the rotational speed. Hattingh et al. 7 investigated the effect of tool geometry parameters on welding forces and weld tensile strength in FSW of AA 5083-H321. They found that optimisation of tool design can lead to welds with 97% of the tensile strength of the base plate. Leal et al. 8 examined the effect of shoulder geometry on material flow during dissimilar FSW of AA 5182-H111 and AA 6016-T4. They reported that pin driven flow is predominant when a conical cavity shoulder is used; however, the interaction between pin and shoulder driven flow is predominant when a grooved shoulder is used. Liu and Ma9 considered the role of tool dimensions and welding parameters on the microstructure and mechanical properties of FS welded AA 6061-T651 with a thickness of 6 mm. They showed that both the hardness distribution and the tensile strength of welds are strongly dependent on the welding speed.
In this work, the effects of geometric tool parameters in dissimilar FSW of AA 5086-O and AA 6061-T6 are examined, and the developed microstructures and material flow in the weld zone as well as the mechanical properties of the joints are evaluated. To do so, dissimilar welding experiments under different welding conditions are performed, and then the produced microstructures and mechanical properties of the welded samples are characterised by employing hardness and tensile testing together with optical metallography and scanning electron microscopy.
Experimental
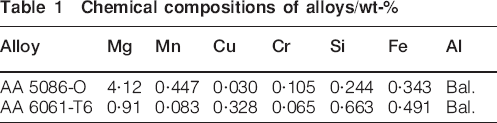
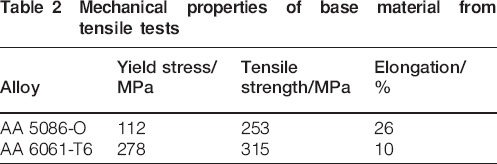
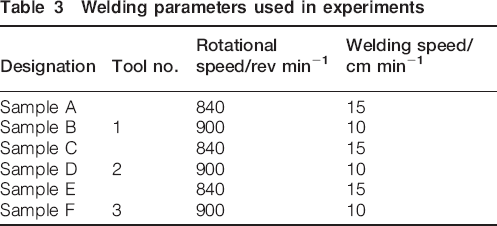
The FS welds were carried out on 5 mm thick plates of AA 5086-O and AA 6061-T6 with the chemical compositions and mechanical properties listed in Tables 1 and 2 respectively. Samples with dimensions of 150×50 mm were cut from the plates. Single pass FS butt welds were conducted using a milling machine, in position control, and FSW tools were made of H13 steel. Figure 1 displays the tools used in this study. Tool no. 1 has a 20 mm diameter shoulder with a 2° conical cavity and a conical probe with three grooves measuring 3–6 mm in diameter and 4·8 mm in length (Fig. 1a). Tool no. 2 has a 20 mm diameter flat shoulder and threadless cylindrical probe measuring 6 mm in diameter and 4·8 mm in length (Fig. 1b). Tool no. 3 has a 20 mm diameter flat shoulder and a threaded cylindrical probe with three flutes measuring 6 mm in diameter and 4·8 mm in length (Fig. 1c).The tool inclination angle was set to 1° for all the experiments, and the AA 5086-O aluminium alloy was located in the advancing side. Before welding, the aluminium plates of AA 5086 were annealed at 345°C for 1·5 h, while AA 6061 was first annealed at 413°C for 2 h and solution heat treated at 529°C for 2 h and then artificially aged at 160°C for 18 h. Several tests were performed to determine the set of welding parameters that gave sound welds for each tool. The employed welding parameters are listed in Table 3. In addition, the temperature changes during and after FSW were experimentally recorded using K type thermocouples 1·5 mm in diameter. Two thermocouples were inserted in the advancing side at distance of 10 and 30 mm from the weld line and one thermocouple in the retreating side at distance of 10 mm from the weld line.
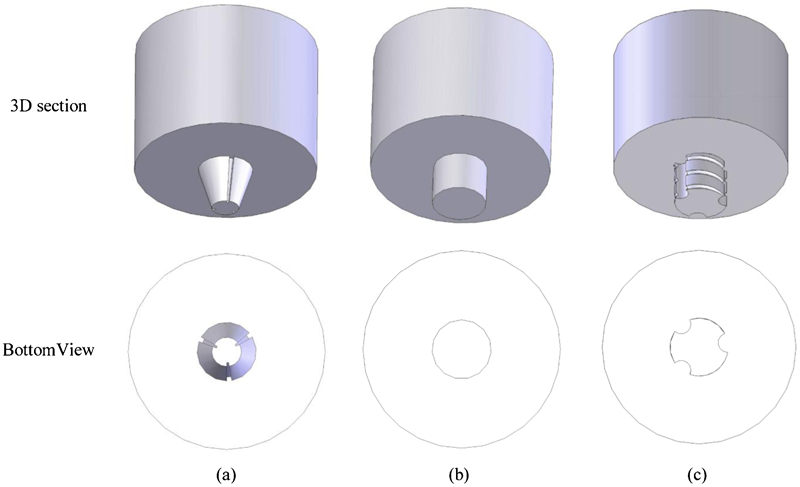
View of tools geometry used in this study
Chemical compositions of alloys/wt-%
Mechanical properties of base material from tensile tests
Welding parameters used in experiments
Optical metallography was performed on a cross-section of the welds perpendicular to the welding direction. A reagent composed of 0·5 mL HF, 15·5 mL HNO3, 84 mL H2O and 0·3 g Cr2O3 was employed to etch the AA 5086, and a reagent composed of 3 mL HNO3, 6 mL HF, 6 mL HCl and 150 mL H2O was used to evaluate the microstructures of the AA 6061 using an Olympus PME3 optical microscope. Electron probe microanalysis and energy dispersive X-ray analyses were performed to determine the element distribution in the stir zone. The Vickers microhardness was also measured using a Peitz–Wetzlar Vickers indenter on a cross-section of the welded samples with a test load of 100 gf for 15 s. To determine the transversal and longitudinal tensile strengths of the welded samples, tensile tests in transversal and longitudinal directions along the weld line were performed in which to remove the effect of surface irregularities on tensile test results; all of the weld samples were first subjected to flat surface finishing. The tensile test specimens were prepared according to ASTM E8M and deformed under a constant crosshead speed of 1 mm min−1.
Results and discussion
Figure 2 shows the crowns of samples A, C and E. Tool no. 1 produced a small amount of flash on both sides of the weld line, but the crown has smooth striations, as shown in Fig. 2a. The crowns of welds produced with tool nos. 2 and 3 are rougher than those of the welds produced by tool no. 1, and little flash was also formed, as shown in Fig. 2b and c. Figure 3 shows the macrostructure of the cross-sections of the welded samples, where no typical FSW onion rings can be seen in the stir zone of the welds. The AA 5086-O alloy is on the left, and the AA 6061-T6 alloy is on the right side in all the images. Figure 3 apparently shows that the materials in the weld nugget of samples A, C and E performed at 840 rev min−1 and 15 cm min−1 are not mixed in complex patterns. It is interesting to note that with increasing tool rotational speed and/or decreasing travelling speed, mixing of materials increases for all tools used in this investigation, as shown in Fig. 3b, d and f. This may be attributed to the higher heat generation and peak temperature in samples B, D and F compared to the others, as shown in Fig. 4, where peak temperatures were measured at 326°C for sample A and 355°C for sample B.
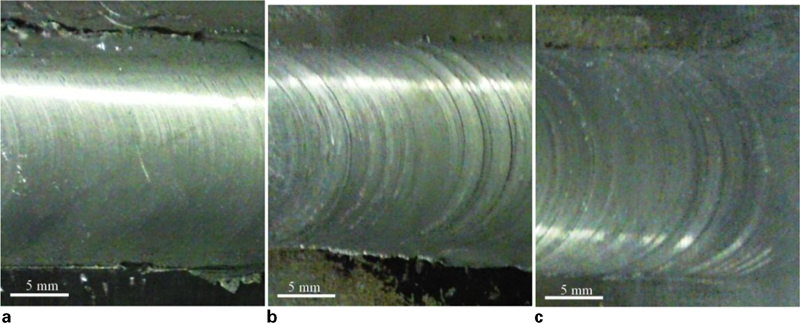
Crown obtained by various tools for rotational speed of 840 rev min−1
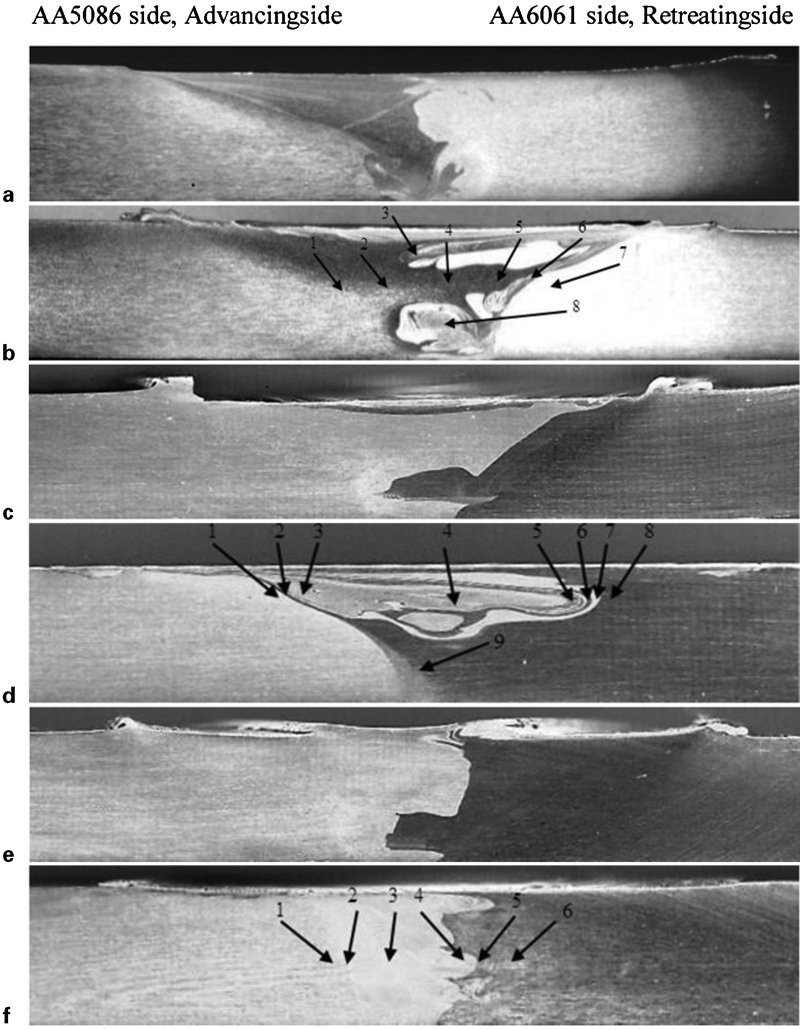
Macrostructures of welded samples
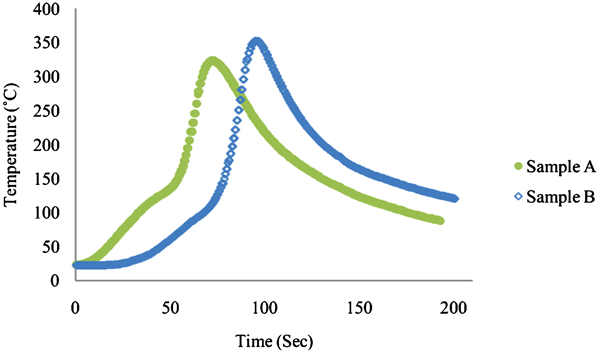
Measured thermal cycles in advancing side at distance of 10 mm of sample A (840 rev min−1, 15 cm min−1) and sample B (900 rev min−1, 10 cm min−1)
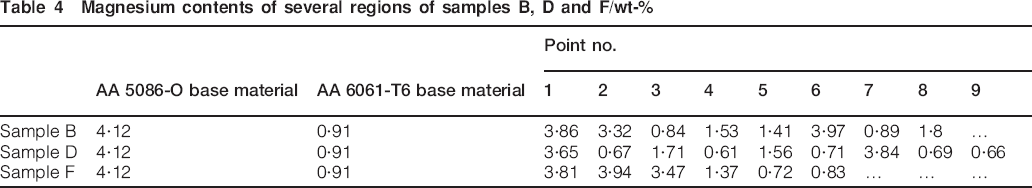
However, due to the different etching behaviours of the two alloys, metallographical examination can only give a qualitative reading of the mixing of materials in the nugget, so to evaluate the distribution of elements in the cross-section of the welds, electron probe microanalysis and energy dispersive X-ray analyses were also performed. The magnesium content of the different regions identified in Fig. 3 for samples B, D and F is shown in Table 4. Accordingly, it is possible to confirm that zones 1, 2 and 6 in sample B are composed basically of AA 5086, while zones 3 and 7 are composed basically of AA 6061. In addition, the magnesium content in regions 4, 5 and 8 suggests that these zones are formed of a mixture of both materials. It can be seen that the value of magnesium content in these regions is closer to that of AA 6061. In the same way, it is possible to conclude that zones 1 and 7 in sample D and zones 1–3 in sample F are composed basically of AA 5086, while zones 2, 6, 8 and 9 in sample D and zones 5 and 6 in sample F are composed basically of AA 6061. The results recorded in Table 4 and Fig. 3 show that the mixing of material in the weld nugget of sample B is more complete than that in the other samples.
Magnesium contents of several regions of samples B, D and F/wt-%
The temperature profiles measured in samples B, D and F, shown in Fig. 5, demonstrate that the peak temperatures are higher at locations close to the weld line and decrease towards the heat affected zone. It can be seen that the peak temperature in sample B is higher than measured in sample D; on the other hand, the peak temperature of samples B and F shows little differences; the peak temperatures of samples B, D and F were determined as 355, 340 and 352°C respectively. It should be noted that the tool shoulder and pin design may affect the amount of heat generated due to changing in frictional surfaces as well as the rate of deformation heat. 10 10,11 The shoulder generates most of the heat, while both the shoulder and the tool pin affect the material flow.12 All the tools have a shoulder diameter of 20 mm, but tool no. 1 has a concave shoulder with a conical pin, and this results in higher heat generation and higher peak temperature than that in samples welded by tool no. 2 due to a larger contact area between the deforming material and the tool.13 As previously mentioned, the peak temperature difference between weld B, performed with tool no. 1, and weld F, performed with tool no. 3, is trivial. As tool no. 3 has a flat shoulder, this means that the pin geometry also affects the amount of generated heat. In fact, although both tools 2 and 3 have flat shoulders, the peak temperature measured at the advancing side of sample F is ∼12°C higher than that of sample D and close to that of sample B. This suggests that the lower peak temperature measured in weld D may be due to the threadless pin of tool no. 2, which generates lower heat by friction and plastic deformation than the threaded cylindrical probe of tool no. 3.
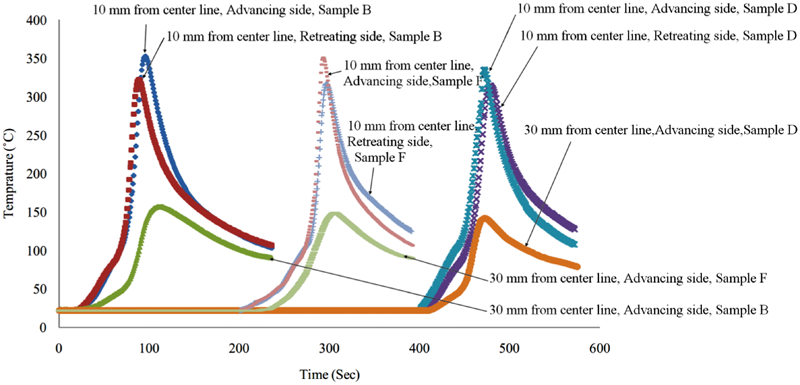
Measured thermal cycles in samples B, D and F for rotational speed of 900 rev min−1 and welding speed of 10 cm min−1
The effect of geometric tool parameters on the microstructure of the welds is shown in Fig. 6. Since 5086 and 6061 aluminium alloys have different etching behaviours, the weld nugget microstructure of the AA 5086 side can be more clearly seen than that of the AA 6061 side. The microstructure of the weld nugget consists of fine equiaxed grains on both sides. In addition, the grain size of the stir zone on the AA 5086 side is found to be coarser than that of the AA 6061 side, e.g. according to Table 5 and Fig. 6a, the grain sizes of the stir zone in the AA 6061 and AA 5086 sides of sample ‘A’ are 5·3 and 6·5 μm respectively. It can be seen that, in all welds, increasing rotational speed and decreasing welding speed result in coarser grain in the stir zone as comparing Fig. 6a and b as well as considering the measured mean grain sizes listed in Table 5. This is due to the higher heat input produced at lower welding speeds and the higher rotational speed, leading to coarser recrystallised structures.14 The lower temperature in the retreating side and the lower deformation resistance of AA 6061 in comparison to AA 5086 as well as the kinetics of recrystallisation and grain growth of both materials lead to a finer grain size in the retreating side of all the welds.
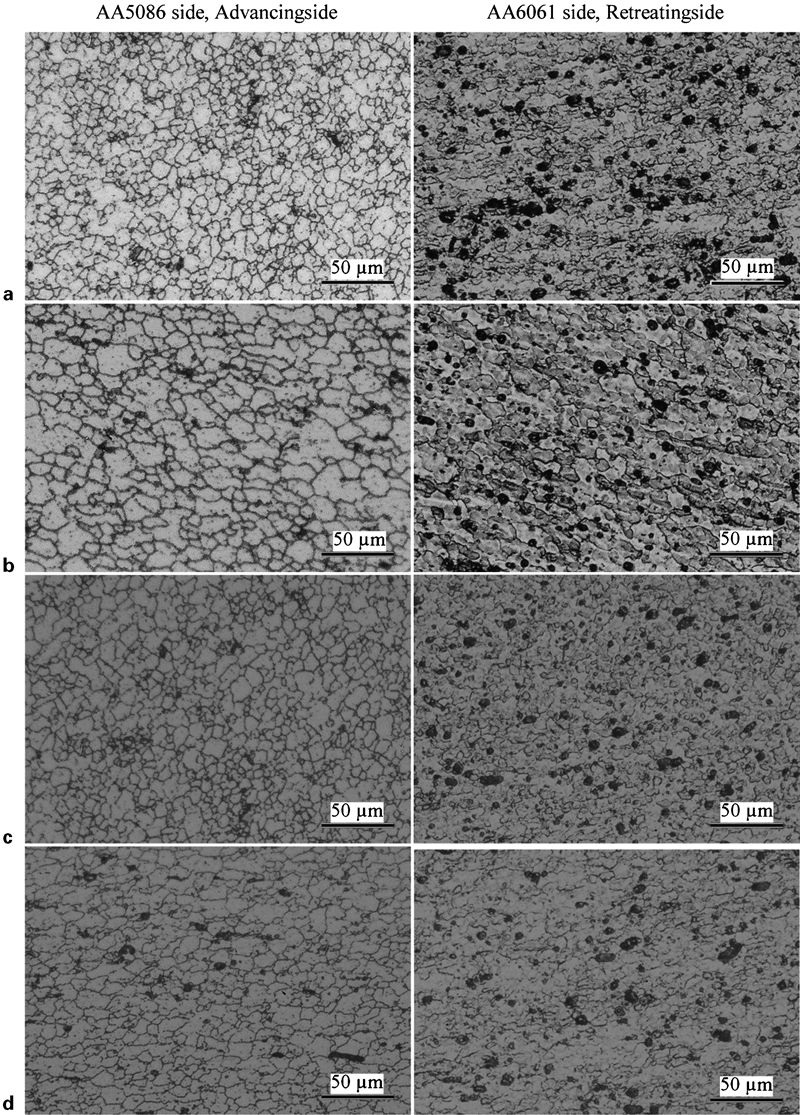
Microstructures of weld nugget
Grain sizes of stir zone in various samples
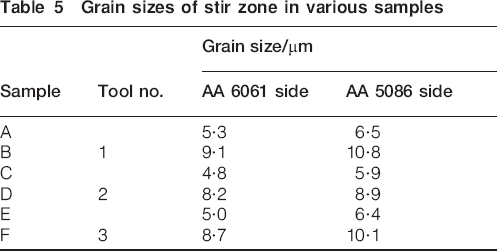
Figure 7 shows the horizontal hardness profiles across the joints of samples A, C and E, measured at a depth of 2 mm from the root face for different aging periods after FSW, where AA 5086-O and AA 6061-T6 base metals have an average Vickers hardness of ∼62 and 101 HV0·1 respectively. Trivial differences were observed in the hardness variations in the nugget region of the welds A, C and E, as shown in Fig. 7. On the AA 6061 side, the imposed thermal cycles as well as severe plastic deformation lead to the elimination of the precipitation hardening effect, and finally, an abrupt decrease in the hardness profile on this side can be observed, as mentioned in other works.15 Additionally, because of recrystallisation and grain size refinement in the weld nugget of the AA 5086 side, the microhardness is higher than the base metal. The lower peak temperature in the welds with tool no. 2 results in a higher cooling rate. Thus, immediately after welding, the amount of precipitates is expected to be lower in the weld zones of these samples compared to the welds performed with the other tools. However, the hardness in the weld nugget and thermomechanically affected zone (TMAZ) of samples increased due to reprecipitation after natural aging, as shown in Fig. 8. The image shows that the aging effect is more pronounced in the first few days. In addition, the width of the region where hardness variation takes place is smaller in sample ‘A’ compared to the other samples. This may be due to the conical shape of tool no. 1 that reduces the width of the deformation and heat affected zones. In addition, the hardness variation in the TMAZ of samples ‘C’ and ‘E’ is sharper than that in sample ‘A’, and this severe heterogeneity can result in weakness and promote premature fracturing.16
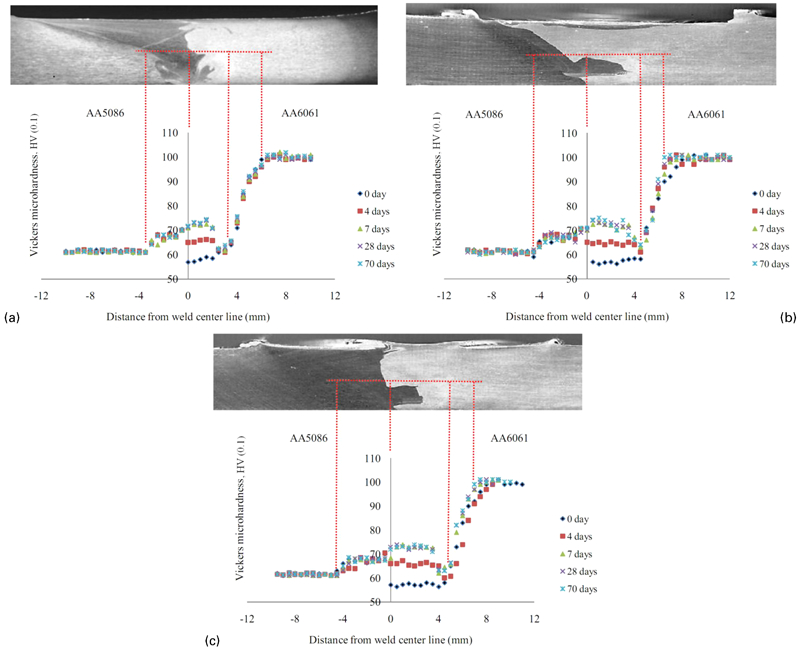
Microhardness profiles of samples for rotational speed of 900 rev min−1 and welding speed of 10 cm min−1
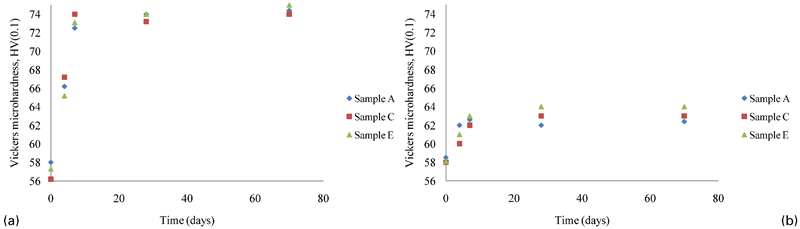
Microhardnesses versus aging times of various samples
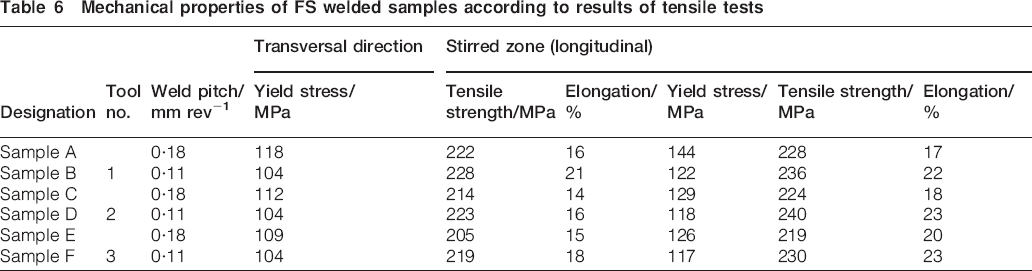
The results of the tensile test of longitudinal and transverse samples after 70 days of natural aging are shown in Table 6. It can be seen that the longitudinal samples show higher yield strength (YS) compared to the AA 5086-O state. In addition, the hardness of the stir zone is higher than that of the AA 5086-O base material; therefore, it is indicated that there is a correlation between the yield strength of longitudinal samples and the hardness of the stir zone. However, the heterogenic nature of the stir zone results in lower tensile strength and elongation at fracture than those of the AA 5086-O base material, e.g. according to Tables 2 and 6, the tensile strength and elongation of the AA 5086-O base material are 256 MPa and 26% respectively, while the longitudinal tensile specimen of sample F has tensile strength of 230 MPa and 23% elongation at fracture. As shown in Fig. 9, the longitudinal samples show higher strength and ductility than the transverse samples. In addition, the stress–strain curve behaviour of the tensile samples after yielding becomes very similar to that of the AA 5086 base metal. It is worth noting that fracturing in transverse samples occurs in the TMAZ of the AA 6061 side, where a sudden change in hardness is observed (see Fig. 7). Table 6 shows that the joints made by tool no. 1 are stronger and show higher elongation at fracture than the others. As shown in Fig. 7, smoother hardness variation in joints made by tool no. 1 may be the result of higher strength and elongation in these samples. In addition, it can be seen that in each series of joints welded by a similar tool, the joint strength increases with increasing weld pitch, i.e. the ratio of welding to rotational speeds, while the inverse of the weld pitch can be considered as equivalent of the heat input.
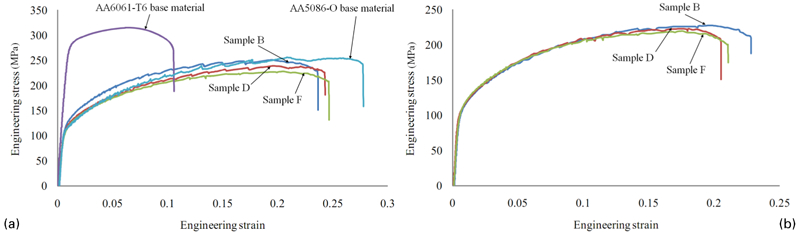
a stress–strain behaviours of AA 6061-T6 and AA 5086-O and welds B, D and F and b transversal tensile specimens for samples B, D and F
Mechanical properties of FS welded samples according to results of tensile tests
Conclusions
The effect of geometric tool parameters on the microstructures and mechanical properties of dissimilar FS welds of AA 5086-O and AA 6061-T6 was studied in this research. Based on analysis of the results, the following conclusions can be drawn:
Measuring the peak temperature in the welded joints shows that the tool with a concave shoulder and a conical probe with three grooves results in maximum peak temperature and the tool with a flat shoulder and threadless cylindrical probe produces the minimum peak temperature.
In each series of welds made by different tools, increasing rotational speed and decreasing welding speed result in weaker welds and coarser grain size in the weld nugget.
In all the welds, the hardness profile on the AA 6061 side shows an abrupt decrease. However, this hardness variation is smoother in samples welded by the tool with a concave shoulder and a conical probe.
Magnesium distribution across the weld shows that the material in the weld nugget is a mixture of the two alloys, though closer to magnesium content in AA 6061.