
Abstract
This paper presents the results of a high speed video survey of melt flow on the front face of a keyhole created during fibre laser welding. Using fast Fourier transform techniques, quantitative values of fluid flow velocities down the keyhole front have been established. The results have led to a phenomenological understanding of some of the quality problems which arise at excess welding speeds. The downward flow velocity on the keyhole front is found to be generally independent of welding speed, and proportional to laser power.
Introduction
Deep penetration laser beam welding has been investigated for decades. In 1964, Schwarz1 investigated the ‘keyhole’ phenomena in electron beam welding with a high speed camera working at 2500 frames/s. To investigate the internal behaviour of the keyhole, X-ray photography techniques have been utilised2– 6 by several research groups. As the price of high speed cameras has reduced, they have almost become standard equipment in a modern laser laboratory, and a considerable number of high speed video results have been published.7 A large amount of theoretical modelling8– 10 and computer simulation 11 11,12 of the laser welding process has also been carried out. As the models have increased in complexity and become closer to reality,13– 16 there is an increasing need for experimental measurements to verify or refute the simulation results.
In this paper, we present measurements of melt flow velocities down the front face of the laser evaporated keyhole, which forms a central feature of deep penetration laser welding. The measurements were carried out using a high speed camera and a streak image technique17 supported by two-dimensional fast Fourier transform (FFT) analysis.
Experimental
All the welding experiments were performed with a 15 kW IPG fibre laser, with a 200 μm delivery fibre, a 300 mm focusing lens and a 150 mm collimator lens. The workpiece material was 2·4 mm thick 304 stainless steel (coupon size: 250×100 mm). Only bead on plate welds were produced. To eliminate any plasma plume above the weld pool, a micro-cross-jet was employed to blow compressed air across the top of the weld zone a few millimetres above the keyhole.18
A Photron SA1 high speed camera (together with a 200 mm micro-Nikkor lens) was used to observe the front face of the keyhole at an angle of 45°. The optics was adjusted to image an area of 3×4·2 mm of the weld area from a distance of 400 mm. By decreasing the image resolution to 128×128 pixels, the frame rate could be increased to 180 000 frames/s. An exposure time of 1 μs eliminated most of the motion blurs in the images.
In order to obtain a view deep into the keyhole, a large diameter laser beam was used. This was achieved by placing the focal position 9 mm below the top surface of the workpiece. The unfocused beam at the top surface of the workpiece had a close to Gaussian energy profile. The beam profile was measured (at reduced power) with a Prometec Laserscope UFF100 and had a 4-sigma beam diameter of 0·9 mm.
Welds were made over a wide range of laser powers (from 3kW to 15 kW) and speeds [from 50 mm s−1 (3 m min−1) to 250 mm s−1 (15 m min−1)]. The trials were organised to observe the effect of changing speed at a fixed power, changing power at a fixed speed and the effect of increasing power and speed together to give results at constant line energy.
Melt flow velocity measurement
For each of the 200 mm long welds, a 4000 frame video was taken. As the camera recorded images at 180 000 frames/s, each video showed 22 ms of the welding process. The exposure time and aperture of the camera were adjusted to capture the flow of molten metal on the keyhole front (Fig. 1). As no external illumination was used, bright areas in the image indicate localised high temperatures, and dark areas indicate lower temperature areas.
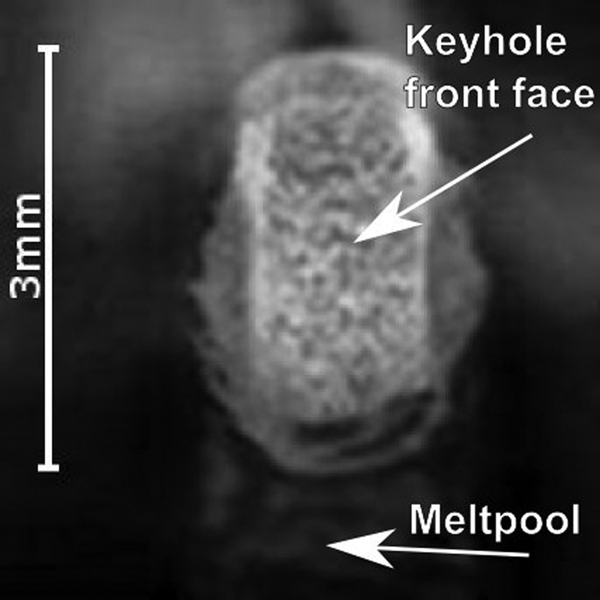
Single frame from video of weld zone created at laser power of 10 kW and welding speed of 166 mm s−1: higher temperature ‘bumps’ can be seen on keyhole front surface
It was observed that the surface of the front wall of the keyhole was clearly structured with what appeared to be small bumps (Fig. 1).19 This rough, complex surface undoubtedly has a higher absorption20 than is normally assumed in simulations. In the high speed videos, it was also observed that a nearly vertical downward flow existed on the front wall of the keyhole in many cases.
In order to quantify the flow down the keyhole front, a single pixel column of each frame was extracted and placed next to similar single lines from subsequent frames. In this way, a streak image was produced.17 Figure 2 is a streak image of the centreline of the keyhole front in Fig. 1. The streak image maps the downward movement of bright (or dark) segments of the line as bright or dark streaks inclined from left to right. If, for example, a bright dot in the original single pixel column was to move down the keyhole front at a constant velocity, the streak image would show this as an inclined straight, bright line. The speed of the flow can be measured from the inclination angle of the line, a more vertical slope indicating more rapid flow.
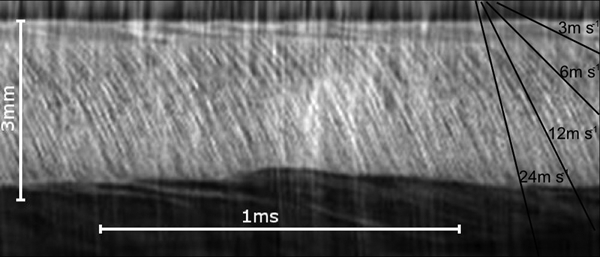
Streak image 10 kW 166 mm s−1 (10 m min−1)
In practice, the situation is rather more complicated. The lines in the streak image in Fig. 2 are curved, which implies that the melt is accelerating down the keyhole front wall (the almost vertical white streaks in Fig. 2 originate from fluctuations in the plume of evaporated metal from the keyhole). The most dominant streak direction in Fig. 2 can be visually estimated to be equivalent to flow speeds between 6 and 12 m s−1. This visual estimate can be accurately quantified by using FFT analysis of the data presented in Fig. 2.
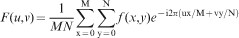
A two-dimensional FFT computed from the streak image using equation (1) is presented in Fig. 3 (scaled to a 512×512 image to represent the square pixels in Fig. 2). This two-dimensional FFT shows the frequency content of the data points in different directions. Parallel lines in the streak image create bright areas in the FFT, perpendicular to the direction of the streak lines.
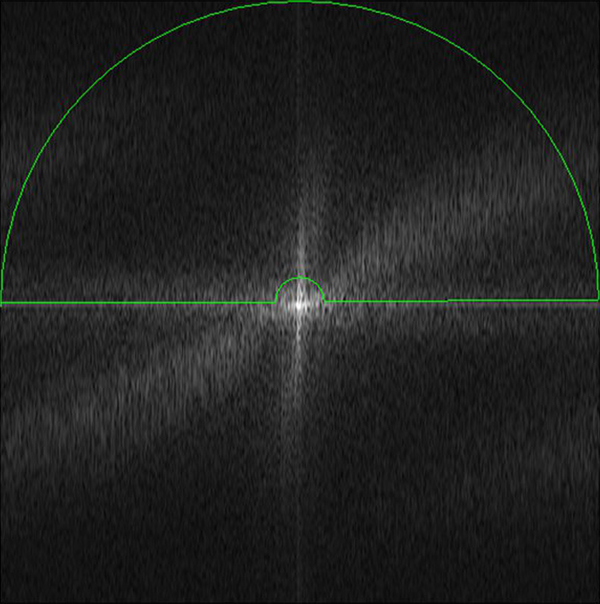
Two-dimensional fast Fourier transform (FFT) of Fig. 2
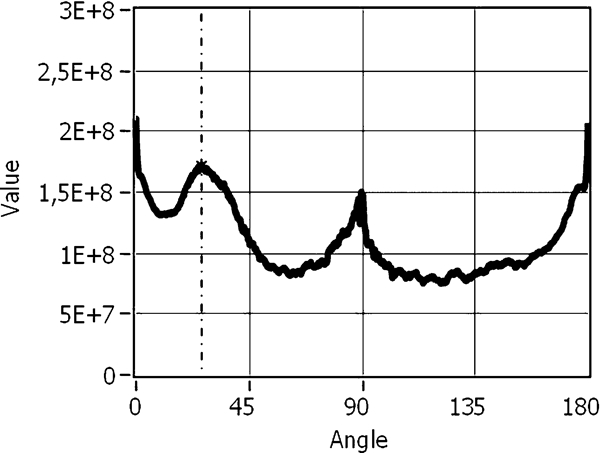
Frequency of data points in different directions of FFT image shown in Fig. 3
In the case of the example shown here, the dominant FFT angle is 25·6°, which means that the dominant inclination angle in the streak image (Fig. 2) is 64·4°, equivalent to a downward flow velocity of 10·7 m s−1. It should be borne in mind that this is the dominant or most frequently observed velocity and not the average.
For all the weld videos, this dominant velocity calculation was carried out for each column in the original image (Fig. 1), and the results are plotted graphically. These graphs show the distribution of the dominant velocities within the flow for each weld (Fig. 5 in the next section presents the results from three welds).
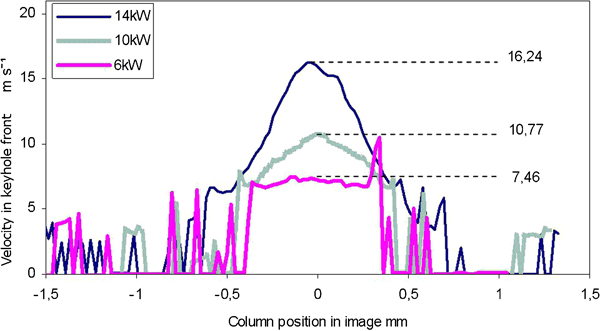
Dominant flow velocities in different image columns welded with 60 J mm−1 line energy and three laser powers
Results and discussion
Figure 5 shows the variation of downward flow velocities measured across the keyhole front for laser powers of 14, 10 and 6 kW at a line energy of 60 J mm−1. It is clear from these results that at the lowest power, the downward flow has a fairly constant velocity right across the keyhole wall. As the power is increased, the flowrate increases towards the centre of the keyhole wall. In the cases shown here, the flow velocities near the sides of the keyhole remain at the lower velocity of ∼7·5 m s−1, but rise to 10·77 and 16·24 m s−1 at powers of 10 and 14 kW respectively. Data spikes to either side of the keyhole are measurement errors due to noise from the metal vapour plume. The width of the keyhole (i.e. the width of the flowing zone from approximately –0·5 to +0·5 mm in Fig. 5) appears to be similar to the measured beam diameter of 0·9 mm.
All the welds were analysed in this way, generating a vast amount of data. For ease of comparison of different welds, only the dominant, centreline, flowrates (e.g. the 10·77 and 16·24 m s−1 values above) will be referred in the following results.
In Fig. 6, the dominant centreline melt flowrates have been plotted as a function of laser power at various welding speeds. At the highest welding speed, 200 mm s−1 (12 m min−1), there is a clear linear correlation between downward flowrate and laser power. On the other hand, at lower laser powers for the lowest welding speed 50 mm s−1 (3 m min−1), the flow of the melt on the keyhole front wall was random, with no overall downward flow. This observation was confirmed by direct observation of the relevant high speed videos.
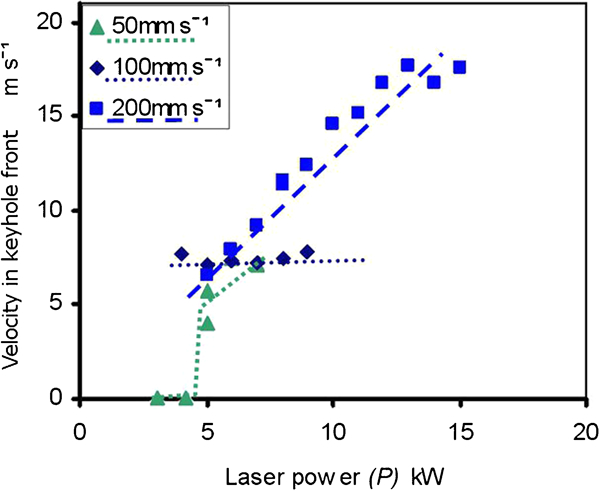
Dominant flow velocities down centre of keyhole front as function of laser power for different welding speeds
Figure 7 provides dominant centreline flowrate data as a function of welding speed for laser powers of 5, 10 and 15 kW. It is clear from these results that, in general, the rate of flow of the melt down the keyhole front is independent of welding speed over this range of parameters. There is some possible welding speed/flowrate correlation in the lowest power (5 kW) case, but the result is ambiguous.
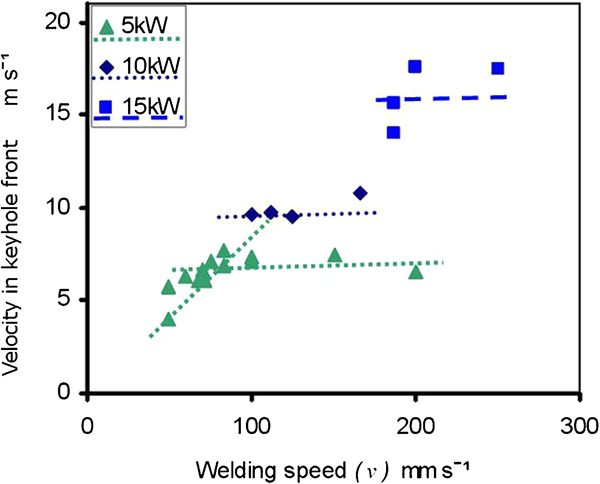
Dominant flow velocities down centre of keyhole front as function of welding speed for different laser powers
Figure 8 shows the dominant, centreline flow velocities down the keyhole for various constant line energies as a function of laser power. The general trend linking downward flow velocity and laser power is very clear above a threshold of 5 kW (below which the flow is directionally random).
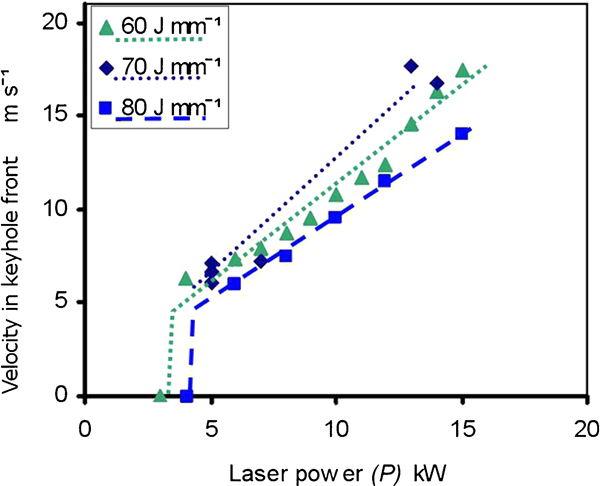
Dominant flow velocities down centre of keyhole front as function of laser power for different line energies
Additional experiments confirmed that the use of a smaller focused spot also accelerated the downward flow. This indicates that the flow is driven by the power density on the keyhole surface, rather than simply the laser power, and supports the idea that the melt is driven down the keyhole face by the local vapour pressure generated by preferential evaporation of the upper surfaces of bumps in the liquid.21
This ‘bump evaporation’ driven flow involves genuine flow and mass transport, not merely the movement of waves down the keyhole front. This point is confirmed by the fact that, at the lowest speeds and highest powers, the laser–material interaction was sufficient to propel all the melt (bumps) out of the bottom of the ‘weld’ to produce a cut. The experimental flow results for this group of the experiments have not been included in the preceding graphs because this paper is concerned with welding only.
Before we move on to further discussion, it is worth noting that there is one feature of the experiment that could give rise to experimental error; the camera inclination was 45 degrees. Naturally, all the flow velocity measurements presented so far have taken this into consideration, but these calculations have assumed a vertical keyhole front. At slow speeds and/or high powers, the inclination of the keyhole front will be almost vertical, but at high speeds, there might be an inclination of the keyhole front, which would mean that our calculations would overestimate the downward flowrates. The maximum error would be for a keyhole inclination of 45° from the vertical, which would mean that the flow figures would be overestimated by a factor of 1·414. As we have no reliable information about keyhole wall inclination, we have ignored the possible need for correction of our data, and thus, all of the figures presented here assume a vertical keyhole wall. However, we have carried out tests on the data with various graded correction factors and concluded that even a worst case correction does not affect the trends we have identified. Another important consideration when reviewing the data presented here is the fact that we have carried out our welds with a defocused laser in order to see more clearly into the keyhole.
Figure 9 maps out the results of this investigation into several regimes:
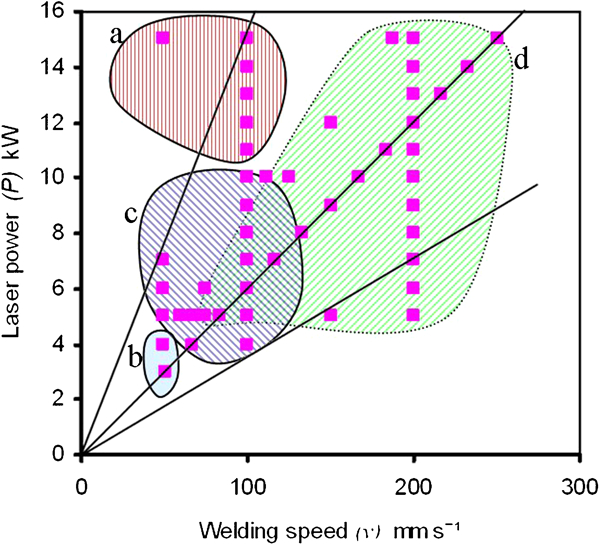
Interaction zones covered in this experimental program (see discussion below for explanation)
in the high power/low speed range (top left of Fig. 9), the weld penetrated the bottom of the material and the downward flow resulted in the melt being ejected from the bottom of the weld zone to create a cut rather than a weld
in the low power/low speed range (bottom left), the flow on the keyhole front is random; there is no general downward flow
at moderate powers and low speeds, there are ambiguous results. In Fig. 6, the 100 mm s−1 (6 m min−1) welds show no correlation to laser power. This is in contradiction to the result for higher powers and speeds where there is a linear relationship between power (power density) and melt flowrate. In Fig. 7, the slow 5 kW welds show some correlation to welding speed. This is in contradiction to the general finding that flowrates are independent of welding speed
in the high power/high speed zone (top right), there is a clear correlation between laser power and flow velocities down the keyhole front. This is also true for certain power–speed combinations at moderate powers and low speeds, which is the reason for the overlap of interaction zones c and d in Fig. 9.
Since the 1970s, there has been a general agreement that, for a wide range of processing parameters,18 a reduction in laser power can be compensated for by a reduction in welding speed if you require a certain depth of penetration. This has given rise to the familiar equation

Simply providing the same line energy to the weld at a higher speed [e.g. increasing from 5 kW at 83 mm s−1 (5 m min−1) to 10 kW at 166 mm s−1 (10 m min−1)] will generally melt the same amount of metal. However, for this relationship to work, there needs to be a mechanism for transporting the molten metal from the front of the keyhole to the back of the weld more quickly as welding speeds increase.
The linear increase in downward melt transport speed with welding power helps to transport heat down the keyhole front and stabilises the value of d when both P and v are increased. However, constant weld penetration does not necessarily mean constant weld quality, as we can see from Fig. 10.
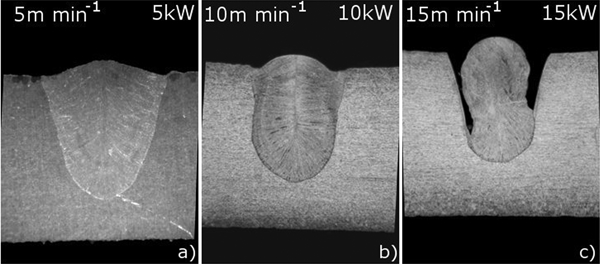
Changing weld cross-sections at constant line energy
Figure 10 makes it clear that, although approximately the same amount of melt and penetration depth has been achieved in each case, the shape of the cross-section changes. These changes are linked to the increase in flowrate down the keyhole front as the laser power rises and also to changes in flow redirection as the welding speed increases.
If we increase the laser power from, for example, 5 to 15 kW and increase the welding speed from 5 to 15 m min−1, two things happen:
the downward flow of melt increases in speed, and the velocity gradient from the edge of the keyhole wall to the centre becomes steeper (Fig. 5); this is, as we have seen, a result of increasing power density
the geometry of the weld zone becomes stretched in the direction of welding, which means that the bottom of the keyhole is flattened, and flow at the bottom of the keyhole is directed backwards along the line of the weld at high welding speeds.
In the ‘slower/lower power’ weld, the liquid flows down the keyhole front and has a low enough momentum to solidify as a high quality weld. As the weld speed and laser power are increased above a certain threshold, the melt achieves a much higher backward momentum as a result of its higher flowrate and more horizontal flow redirection. At these higher welding speeds, the weld pool is also extended in the direction of welding. Mass flowrates are highest along the centreline of the weld, and this tends to draw to melt towards the centreline of the flow.
All these phenomena combine to fill the centre of the weld line with melt, and the starvation of melt from the sides means that there is no melt contact to the side walls in the upper part of the weld at high welding speeds. The resulting weld then solidifies with the type of cross-section shown in Fig. 10. This mode of solidification involves severe undercut and humping of the weld profile.
Conclusions
Above a certain threshold welding speed (>50mm s−1 in our case), the liquid metal on the front of the keyhole gave evidence of an uneven ‘bumpy’ surface and downward fluid flow. At lower speeds, the melt on the keyhole front experienced random motion.
At high powers and low speeds, ‘welding’ becomes cutting. The resulting spray of material out of the bottom of the ‘weld zone’ confirms that the observed flow is not merely the movement of surface waves.
Experimental measurements of the molten metal flow on the keyhole front wall have been performed.
The flow is highest at the centre of the keyhole front. Near the edge, the flow is ∼7 m s−1.
At moderate to high welding speeds and laser powers, the rate of downward flow on the keyhole front is proportional to laser power.
The downward melt flow is probably driven by the laser induced evaporation of the upper surface of bumps on the melt surface.
Increasing the power density by focusing will increase the flow velocity, confirming that the increase in melt down flow is related to the power density irradiating the keyhole front wall.
At high powers and welding speeds, the flow is redirected backward, and the melt solidifies along the centreline of the weld with reduced contact to the sides of the weld line, resulting in severe undercut and humping.
Footnotes
Acknowledgements
This research has been carried out in the FiberTube Advanced Project, funded by VINNOVA (The Swedish Agency for Innovation Systems) and Jernkontoret (The Swedish Steel Producers Association) (project no. 34013).