
Abstract
AlMgSc and AA 7075-T6 alloys find applications in the aeronautic industry due to their lightweight associated with high mechanical strength and fatigue resistance. Both alloys have poor weldability when joined by fusion welding processes, which is overcome with the use of friction stir welding (FSW). Recent research work shows that electrical conductivity field analysis can be used as a material characterisation technique for solid state material welding exhibiting a microstructure gradient. This study aims to apply electrical conductivity field analysis to bead on plate FSW to identify the potential application of this technique to map and characterise microstructural transformations. The FSW was conducted on AlMgSc and AA 7075-T6 plates with different parameters, and electrical conductivity measurements were performed at half thickness, complemented by other techniques as hardness, scanning electron microscopy and energy dispersive spectroscopy. A good correlation was observed among electrical conductivity field, microstructure and hardness of different zones in FSW beads.
Introduction
The aeronautic industry is increasing the application of AlMgSc alloys due to its higher toughness, mechanical and fatigue resistance and lightweight compared with other structural materials as AA 7075-T6 alloy. Scandium is added as a grain refining element; thus, the alloy has a very fine grain structure with improved resistance.1– 3 Another alloying element is Mg, so AlMgSc is comparable with the AA 5xxx series according to the Aluminium Association classification, in the group of workhardenable non-heat treatable alloys. The difficulty of joining AlMgSc and AA 7075-T6 alloys led to the use of friction stir to weld these alloys. The solid state process thereby prevents the formation of porosity at the fusion zone and extensive brittle intermetallics. Excessive softening and grain growth at the heat affected zone (HAZ) are also usual.
The use of electrical conductivity is widely recognised as a non-destructive testing (NDT) technique, namely by eddy currents, to detect surface defects.4– 6 Another field of application of the electrical conductivity is the possibility to use this property to characterise processed materials and welded joints complementing, or even substituting, other existing techniques as hardness measurements and macrographic analysis. Additionally, information related to the electrical conductivity field is crucial when NDT based on eddy currents is to be applied, since defects are detected based on a local change of the electrical conductivity in the material. Previous knowledge of the electrical conductivity field variation due to solid state processing is required in order to distinguish background material from eventual defects.7
The aim of this study is to apply electrical conductivity field analysis to bead on plate FSW of AlMgSc and AA 7075-T6 alloys to identify the application of this technique to map and characterise microstructural transformations. Friction stir processing was performed on both alloys with different parameters. Electrical conductivity profiles were measured at half depth and compared with the hardness profiles and microstructures observed under optical and scanning electron microscopy (SEM). Energy dispersive spectroscopy (EDS) associated to SEM was used to identify existing precipitates.
Experimental
Materials
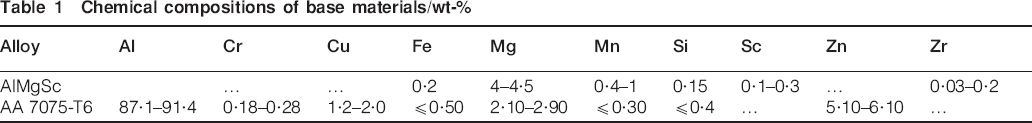
The materials under study were cold rolled plates of AlMgSc (3·3 and 6 mm thick) and AA 7075-T6 (10 mm thick) plates, with the chemical compositions presented in Table 1.
Chemical compositions of base materials/wt-%
Friction stir welding (FSW)
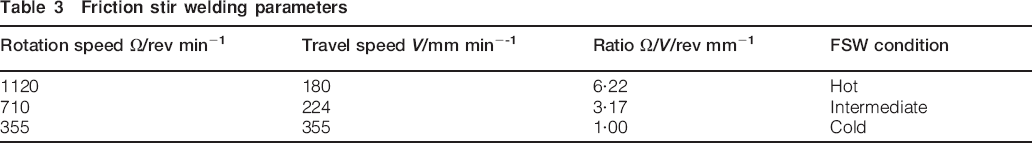
Friction stir welding beads were performed on both alloys with different parameters. A conical threaded probe and a shoulder with a spiral scrolled profile were used as depicted in Fig. 1 and described in Table 2. Table 3 summarises the welding parameters tested. For Ω/V ratios (rev mm−1) above 6, the process is usually referred to be under hot condition, while it is in cold condition for Ω/V = 1.8
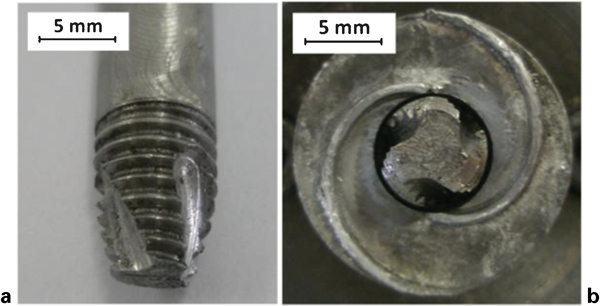
Friction stir welding tool
Geometric parameters of FSW tool
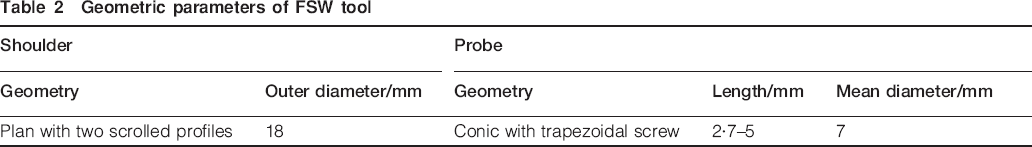
Friction stir welding parameters
Electrical conductivity measurements
The electrical conductivity measurements were performed using an absolute helicoidal shielded eddy current probe from Olympus (Nortec p/100–500 kHz/90·5/6). A permanent lift-off of 50 μm thin polymer was used.
Calibration tests were made on conductivity standard coupons, and the results were compared with other commercial eddy current equipments, namely Sigmatests D2·0068 and Nortec 500D.
Preliminary conductivity measurements were performed at different frequencies, in the range of 10 kHz to 2 MHz, and the final tests were performed at 150 kHz. For this frequency, the penetration depths of the eddy currents were 0·31 and 0·30 mm for AlMgSc and AA 7075-T6 respectively. This is due to the skin effect of the eddy currents, i.e. the current density is maximum at the material surface and decreases exponentially with depth. According to the NDT practice, the standard penetration depth is defined as the depth at which the eddy current density decreases down to 1/e, where e is the Neper number. 4 4,5
Conductivity measurements were made along a sweep in the X axis perpendicular to the weld bead at half thickness. The starting point was set at 30 mm before the nugget centre, and 60 mm long segments were characterised with 200 μm distance between each value acquisition. Friction stir welding is considered a steady state process; however, when welding small samples, differences can be observed due to the plate border effect. In order to guarantee repeatability, measurements were taken in samples extracted close to the starting and ending zones of the weld.
Microstructural analysis and hardness measurements
The processed samples were prepared for microstructural analysis and hardness measurements. The samples were cut, polished and chemically etched with Keller reagent to reveal the metallurgical structure of the different zones observed under optical microscopy. Scanning electron microscopy analysis was performed using a Zeiss DSM 960 equipment with an EDS detector Oxford INCA sight at 20 kV.
Vickers hardness tests were made on transversal section of the processed beads, according to ISO 6507-1, using a Mitutoyo HM-112 Vickers hardness tester under a load of 1·96 N.
Results and discussion
AA 7075-T6
In the AA 7075-T6 alloy welded under hot conditions, i.e. for a ratio between the rotating and travel speeds Ω/V of 6·22 rev mm−1, a sharp decrease in hardness was seen in the HAZ associated with the weld bead. The hardness decreases from ∼160 to 100 HV0·2, increasing in the thermomechanically affected zone to 140 HV0·2 and remaining approximately constant along the nugget. As this is a heat treatable alloy, it is sensitive to the heat generated by internal friction during FSW, and thus, there is a precipitate dissolution in the matrix with grain coarsening softening the material in the HAZ.9– 11 In the nugget, the dynamic recrystallisation that follows the viscoplastic stirring of the material is responsible for the grain refinement, increasing the hardness. The electrical conductivity profile shows an inverse pattern of hardness, as depicted in Fig. 2.
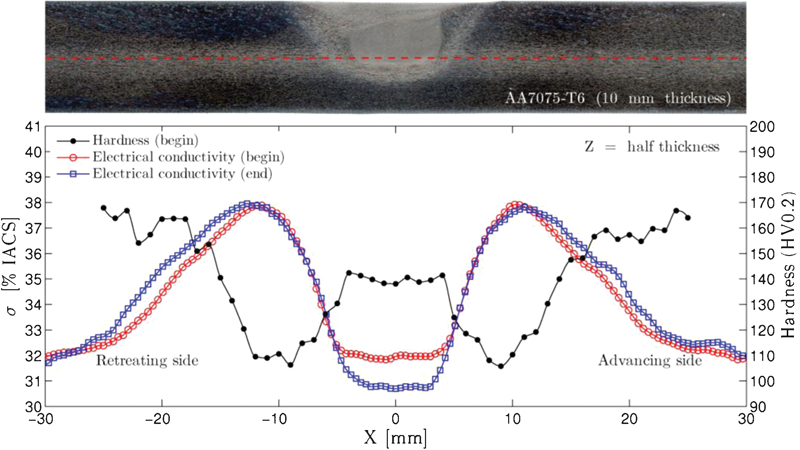
Transversal macrograph, electrical conductivity and Vickers hardness profiles of hot FSW bead on plate on AA 7075-T6 10 mm thick plate
As described in a previous work,7 the electrical conductivity depends on the electron mobility, while hardness depends on plastic deformation mechanisms and barriers to dislocation movement, as grain boundaries, and the existence of second phases, i.e. electrical conductivity is based on microscale phenomena, while hardness measures a macroscale property. However, when measuring these two properties, the area under observation is dependent on the device used for each test. In the electrical conductivity evaluation, the eddy currents flow in an area that has approximately the diameter of the coil of the probe, usually 3–4 mm. Opposite to this, the hardness indentations can be of some micrometres. Therefore, the two measuring techniques are complementary from the point of view of the basic phenomena involved and the area under analysis.
This evolution is less evident when welding under cold conditions, i.e. when the heat generated in the process is insufficient to promote precipitate dissolution and grain growth, as shown in Fig. 3. Although the qualitative trends are the same for both cold and hot welds, quantitatively cold welds exhibit lower electrical conductivity changes than the ones observed when welding under hot conditions.
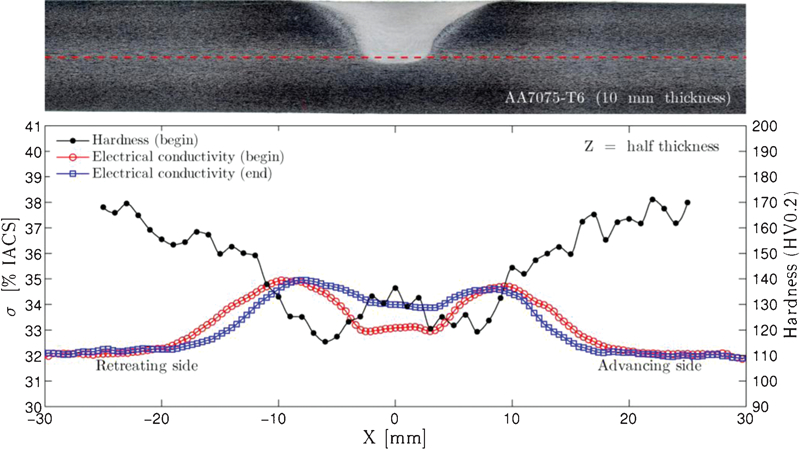
Transversal macrograph, electrical conductivity and Vickers hardness profiles of cold FSW bead on plate on AA 7075-T6 10 mm thick plate
Another interesting observation is that the width of the heat affected region is larger for the hot welds than for the cold ones due to the different amounts of heat generated that have to be dissipated by the material. The HAZ runs from −28 to +28 mm, considering the centre of the nugget as the reference in the hot condition and from −18 mm to +18 mm in the cold condition. There is no remarkable difference between the advancing and retreating sides, though it can be noticed that in the cold condition a slight decrease in hardness in the retreating side exists, confirming the asymmetric nature of the material flow with an increase in temperature in this side.12 It can be concluded that the electrical conductivity profile clearly describes the microstructural transition between the different zones of the friction stir weld. Additionally, quantification of the electrical conductivity in the different zones is useful for ulterior NDT inspection. The differences observed in the profiles obtained in the beginning and at the end of the weld are not very significant and do not affect the consistency of the results measured in ‘hot’ and ‘cold’ welding conditions, nor the qualitative profile in both cases. This can possibly result from a border effect and consequent non-steady state conditions of FSW.
AlMgSc
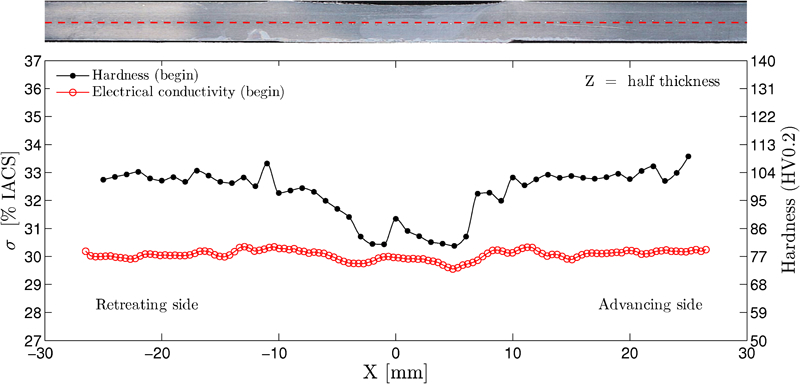
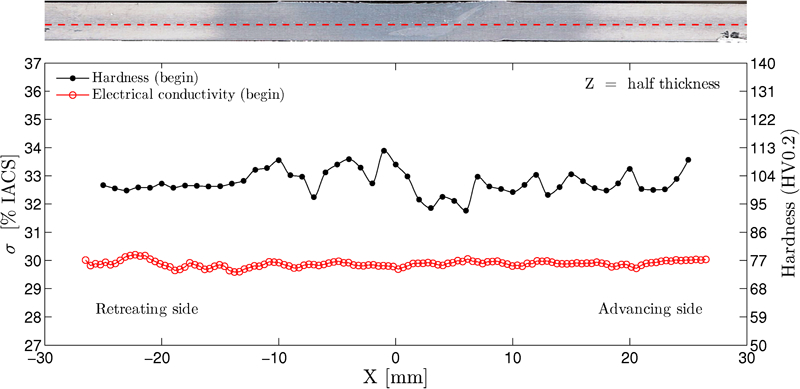
Unlike the previous alloy, the electrical conductivity and hardness profiles of AlMgSc welded under cold, intermediate and hot conditions presented in Figure 4 Figure 5 Figs. 4–6 respectively do not exhibit a strong relation with the processing parameters. Figure 4 shows a slight drop in hardness from the base material to the nugget that is coherent with the microstructure observed in this region, as shown in Fig. 7c, which is an equiaxed grain with small randomly distributed precipitates. This slight decrease is not sensitive to the thermal cycle, i.e. it is not markedly pronounced in the hot condition compared to the cold one. In these alloys, it was seen that the Al3Sc precipitates soften the material.13 Zr inhibits recrystallisation in the nugget; the hardness does not increase as observed for instances in the AA 5xxx series alloys. Since the grain size is small, there is no noticeable variation of the electrical conductivity, which varies by ∼1% according to the International Annealed Copper Standard (IACS).
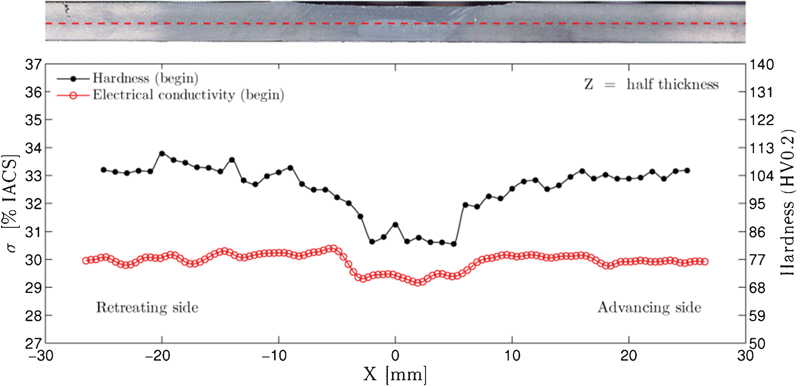
Macrograph, electrical conductivity and hardness profiles of hot FSW on AlMgSc with 3 mm thickness
Macrograph, electrical conductivity and hardness profiles of intermediate FSW on AlMgSc with 3 mm thickness
Macrograph, electrical conductivity and hardness profiles of cold FSW on AlMgSc with 3 mm thickness
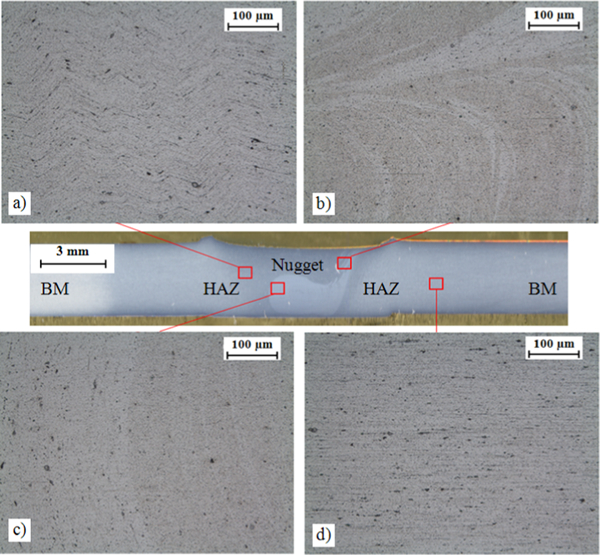
Transversal macrograph and micrographs of hot FSW on AlMgSc with 3 mm thickness
Figure 7 shows the microstructure observed in the different regions. Material flow due to stirring is evident in the thermomechanically affected zone (Fig. 7a and b), while the nugget has a refined equiaxed grain (Fig. 7c). The base material has a banded structure typical of a cold rolled plate (Fig. 7d).
AlMgSc: SEM and EDS
An attempt was made to identify existing precipitates by EDS associated to SEM on non-etched samples. Figure 8 shows the areas observed, and Fig. 9 shows the qualitative analysis. Particles identified as A have a high content in Sc and Zr, while particles identified as B show Si and Fe and particles identified as C are rich in Mg and Si. The matrix has Si as the major alloying element. The precipitates are present in the different zones of the weld bead and have very small dimensions. Therefore, measurements were performed on precipitates with larger dimensions to minimise the matrix effect. The presence of these particles justifies the irregular hardness profile depicted in Fig. 6. However, in a highly conductive matrix, as aluminium, these precipitates have no relevant effect on the electrical conductivity, which is rather controlled by the grain size observed in the different zones of the weld.
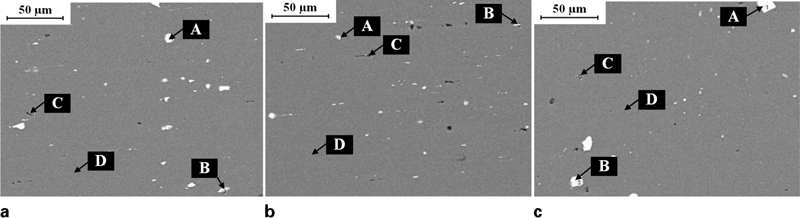
Images (SEM) of FSW AlMgSc alloy
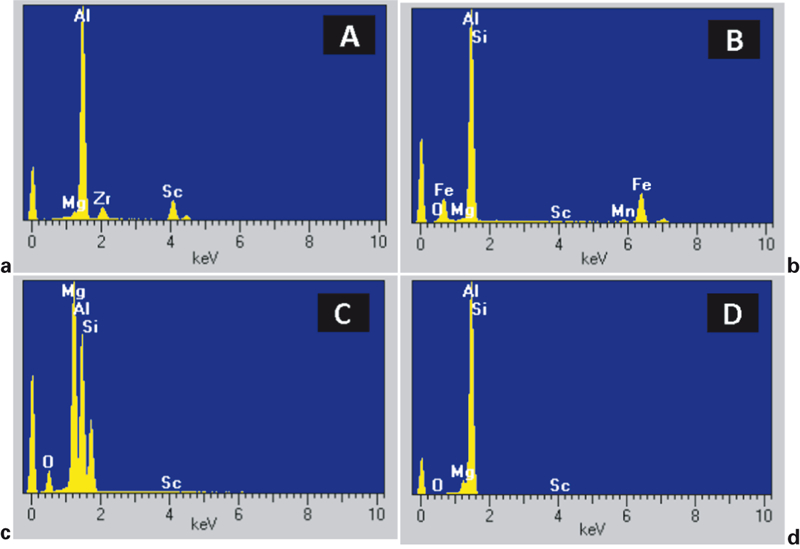
Analysis (EDS) of base material, HAZ and nugget of FSW AlMgSc alloy
Conclusions
From the present study, the following conclusions can be drawn:
Electrical conductivity is a technique complementary to hardness to map and characterise the different zones observed when FSW of aluminium alloys. The two techniques are complementary in terms of basic phenomena and area of observation.
For a highly conductive matrix, as aluminium, the precipitates have no relevant effect on the electrical conductivity, which is rather controlled by the grain since observed in the different zones of the weld.
A good correlation is observed between electrical conductivity and hardness for heat treatable AA 7075-T6 alloy, but this trend was not identified for the AlMgSc alloy.
Solid state welding and processing produce significant changes in the electrical conductivity (6% IACS) in heat treatable alloys as AA 7075-T6. These changes are particularly noticeable for the high ratio between the rotating and travel speeds Ω/V.
For the AlMgSc alloy, the variation of electrical conductivity is not relevant (∼1% IACS) even in hot FSW conditions, as expected, since this is a non-heat treatable alloy. As the initial grain size is small, there is no significant grain refining due to processing, so the variation of electrical conductivity is not perceived.
Footnotes
Acknowledgements
The authors would like to acknowledge the Portuguese Foundation for the Science and Technology (FCT/MCTES) for its financial support via the project PTDC/EME-TME/103543/2008 (FRISURF).