
Abstract
To minimise the volume of argon required for on-site tungsten inert gas welding of titanium plate, the authors investigated the behaviour of argon flow in a trailing–shielding box by means of computational fluid dynamics (CFD) simulations. In this study, a solid rectangular shielding box consisting of 9·5×105 tetrahedral elements was modelled. Then, argon flow was simulated for two shielding parameters, namely, the argon supply rate and the gap between the box and the floor. In the experiment, the relation between the oxygen content in the shielding box and the shielding parameters was studied. The experimental results show that the simulation model used in the CFD simulations can predict the behaviour of argon. It is concluded that the simulation model is useful for improving the structure of the shielding box.
Introduction
As is well known, titanium and titanium alloy must be used carefully because they have strong affinity with oxygen and nitrogen during tungsten inert gas (TIG) welding at super high temperatures (surface temperature of weld pool: >2000 K).1 Specifically, the entry of oxygen and nitrogen into molten weld metal and the formation of oxides and nitrides in the heat affected zone during welding seriously deteriorate the weld joint quality of titanium and titanium alloy. Accordingly, the weld zone is generally shielded with inert gas by a trailing–shielding box (hereinafter, shielding box) and a backside shielding jig. However, the large amount of argon during welding of titanium and titanium alloy is necessary.
Some preceding studies2– 5 have dealt with numerical modelling of TIG welding process. Previous studies6– 8 have focused on shielding conditions, as well as the performance of the shielding box and the welding torch during TIG welding of titanium and titanium alloy. However, few studies have been reported on a computational fluid dynamics (CFD) analysis of shielding gas behaviour during TIG welding of titanium and titanium alloy.
In this study, a method for analysing the shielding gas behaviour by means of CFD simulations is proposed. A CFD model is designed and the shielding gas behaviour is analysed by simulating argon flow in a shielding box. Then, the oxygen content in a conventional shielding box is investigated to verify the results of the CFD analysis. The analytical result confirms the relation between oxygen content in a shielding box and the extent of oxidation on the bead surface in TIG arc welding of a titanium specimen. Then an attempt is made to improve the structure of the conventional shielding box, considering the experimental results obtained in this study.
Calculation model
Commercial CFD software package (ANSYS CFX version 11.0) was used for calculations. The governing equation is steady Reynolds–Averaged Navier–Stokes equation. In addition to the averaged momentum, continuity and energy equations, two other equations are solved for the transport of the turbulent kinetic energy and the turbulent dissipation rate. The box model consisting of 9·6×105 tetrahedral cells was used to solve the system of equations describing the conservation of various fluid properties within each cell.
The k–ϵ turbulence model and SIMPLE algorithm9 were employed to estimate argon concentration at each of the grid locations. The standard wall function in CFX was used to predict flow patterns and concentration distribution near the wall. The concentration in argon is considered as a passive scalar transported by advection–diffusion equation.
The convergence to a solution was considered to have been achieved when the normalised residuals of all the conservation equations (pressure, velocity components, eddy dissipation, turbulence kinetic energy and species concentration) were <1·000×10−5. A relative coordinate system was used in which the shielding box is fixed while the surrounding atmosphere moves at a speed of 100 mm min−1. The initial condition was that air (80% nitrogen and 20% oxygen) is filled in the box and surrounding atmosphere. The argon was assumed to be uniformly flowed into the box at the prescribed supply rate. The boundary condition was that the flow velocity of argon is zero at the wall surfaces of the shielding box. Concerning the outside domain, the boundary of the upper and both the side walls are pressed with atmosphere. The flow velocity of the atmosphere is zero at the bottom. The calculation conditions of the simulation model are given in Table 1. The viscosity, thermal conductivity and diffusion coefficient of argon and air used in the calculation were those at 25°C. The argon was supplied through a pipe (inner diameter: 6 mm) attached to the model box and distributed into the box through a header with seven outlets of 3 mm diameter. There are porous materials such as glass fibre or copper wires inside an actual shielding box. This situation was simulated by adopting a drag coefficient of 0·44 in the model. Welding torch gas was not used in the model to simplify the calculation. The argon content (ratio of argon/oxygen) inside the box and at its vicinity was calculated with respect to shielding parameters, namely, the argon supply rate and the gap between the box and the floor.
Calculation conditions of simulation model
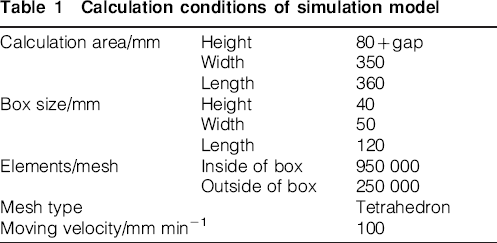
To simulate real welding, a shielding box model was calculated in which a cylindrical welding torch of 8 mm diameter is set 20 mm ahead the centre of the front wall of the box. Argon was supplied to the model welding torch at a flow rate of 10 L min−1, and the gap between the box and the floor was 5 mm. In this case, the box model consisting of 9·6×105 tetrahedral elements and the welding torch consisted of 3×10⁴ tetrahedral elements under the same calculation conditions as the model without welding torch.
Experimental
Measuring oxygen content in shielding boxes
The oxygen content was measured by an oxygen content indicator (digital type) in a conventional shielding box consisting of 1 mm thick titanium plates, with an attached skirt made of heat resistant material around the wall of the box. The measured oxygen content was compared to the results of the CFD analysis. Figure 1 schematically shows the experimental set-up for measuring the oxygen content. The TIG torch was not ignited and only supplied argon. The box was straight moved by a carriage at a speed of ∼120 mm min−1. The measurement was made at argon supply rates of 3, 5, 10 and 20 L min−1 and gaps of 1, 5 and 10 mm. Thirty seconds after the argon was supplied to the box, the oxygen content was measured at a 10 mm interval. Moreover, the oxygen content was measured for a box with an improved internal structure.
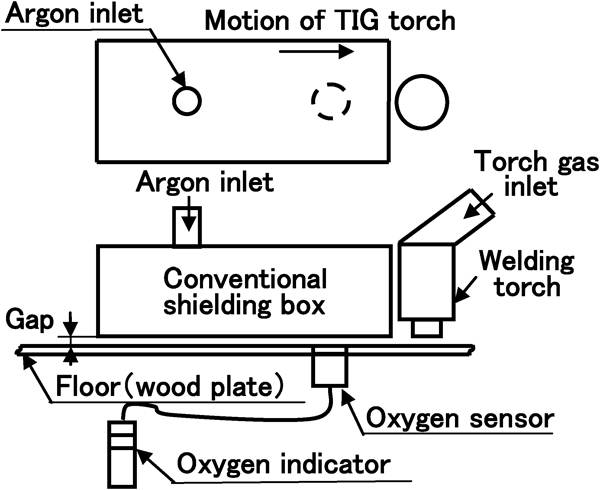
Schematic diagram of experimental set-up for measuring oxygen content
Validation by TIG welding
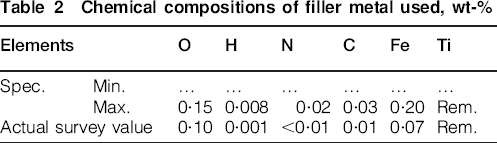
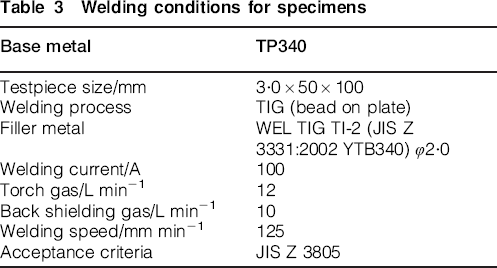
To investigate the oxygen content in a conventional shielding box and confirm the results of the CFD simulation, TIG arc welding of a TP340 (titanium) plate specimen was performed under shielding conditions based on the results of this study. The specimen size was 100 mm in length, 50 mm in width and 3 mm in thickness. The surface of the specimen was machined and cleaned with methyl alcohol. In this experiment, the box attached to the TIG torch was straight moved by the carriage at a speed of 125 mm min−1, and a filler wire was supplied manually. Then, the relation between the colour of the oxide film on the bead surface and the oxygen content in the box was examined according to Japan Industrial Standard (JIS) Z3805. The chemical compositions of filler metal used and the welding conditions for specimens are shown in Tables 2 and 3 respectively. Moreover, the formation of oxides and nitrides on the bead surface was investigated by electron spectroscopy for chemical analysis. The oxides and nitrides on the bead surface of the specimen welded in the improved box were investigated by the same procedure.
Chemical compositions of filler metal used, wt-%
Welding conditions for specimens
Results and discussion
Simulation of argon flow by CFD
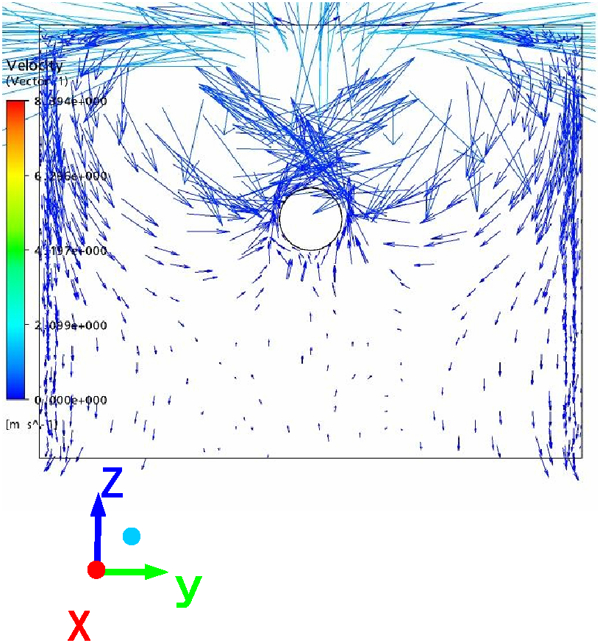
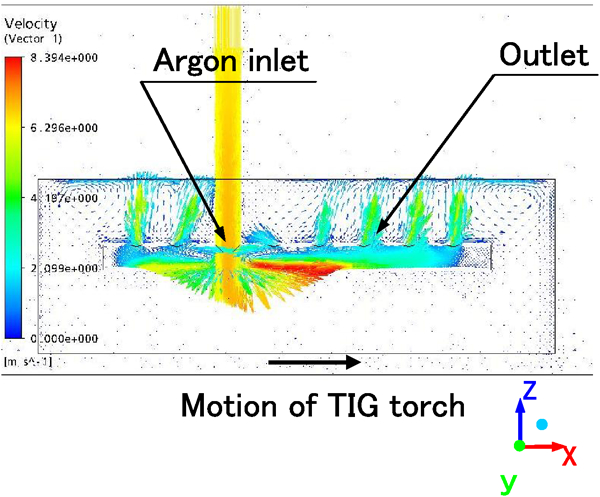
Figure 2 Figure 3 Figures 2–4 show images of simulated argon flow for an argon supply rate of 10 L min−1 and a gap of 5 mm between the box and the floor. In the figures, the argon flow is shown by vectors (increasing velocity from blue, yellow to red). Figure 2 shows the argon flow near the floor and uniform flow velocity of argon is observed. Figures 3 and 4 show front and side views of argon flow. As shown in Fig. 3, argon flows upward from the spout of the header to the upper wall, and then flows down along the wall. The gentle argon flow is observed under the header from Figs. 3 and 4.
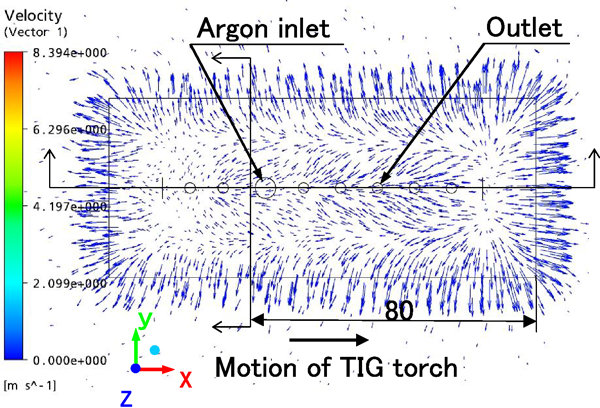
Simulation image of argon flow: plane view; argon supply rate: 10 L min−1; gap: 5 mm
Simulation image of argon flow: front view; argon supply rate: 10 L min−1; gap: 5 mm
Simulation image of argon flow: side view; argon supply rate: 10 L min−1, gap: 5 mm
The distribution of argon content (ratio of argon/oxygen) inside and around the box was investigated by CFD. Figure 5 shows an image of the distribution of argon content near the floor for an argon supply rate of 10 L min−1 and a gap of 5 mm. The argon content was found to range from 80 to 100%. The high argon content is observed throughout inside the box.
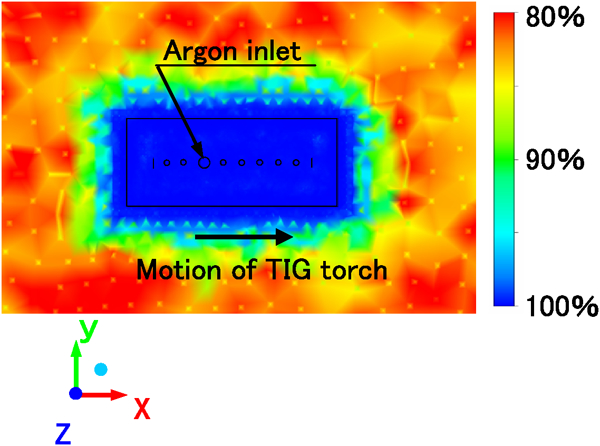
Image of argon content distribution at floor level: plane view; argon supply rate: 10 L min−1; gap: 5 mm
Figure 6 shows an image of the distribution of argon content for an argon supply rate of 10 L min−1 and a gap of 1 mm. A dark blue area of high argon content, which corresponds to low oxygen content, is observed. Simulation images of the argon content distribution for an argon supply rate of 20 L min−1 and a gap of 5 mm, and for an argon supply rate of 3 L min−1 and a gap of 10 mm, are shown in Figs. 7 and 8 respectively. It can be understood from Fig. 7 that the argon content is high in the box. The simulation image of argon distribution shown in Fig. 5 (argon supply rate: 10 L min−1) is almost the same as that shown in Fig. 7 (argon supply rate: 20 L min−1). Therefore, it can be understood that the gap between the model box and the floor is more important than the argon supply rate. On the other hand, air obviously flowed into the model box is shown in Fig. 8 when the argon supply is low and the gap is large.
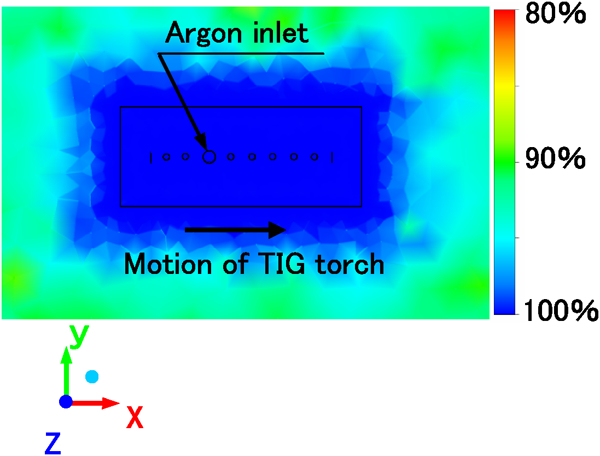
Image of argon content distribution at floor level: plane view; argon supply rate: 10 L min−1; gap: 1 mm
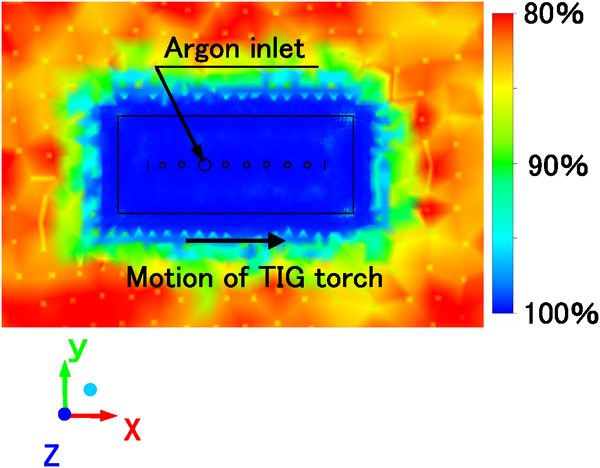
Image of argon content distribution at floor level: plane view; argon supply rate: 20 L min−1; gap: 5 mm
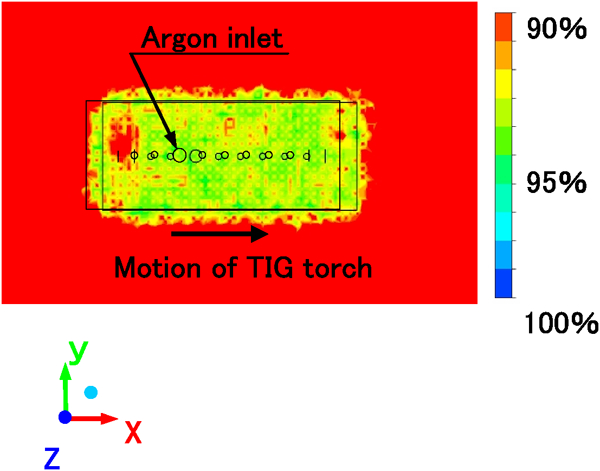
Image of argon content distribution at floor level: plane view; argon supply rate: 3 L min−1; gap: 10 mm
Figure 9 shows the simulation image of argon distribution for an argon supply rate of 10 L min−1 and a gap of 5 mm for the model with a welding torch. An area with low argon content, or high oxygen content is seen in the vicinity of the torch.
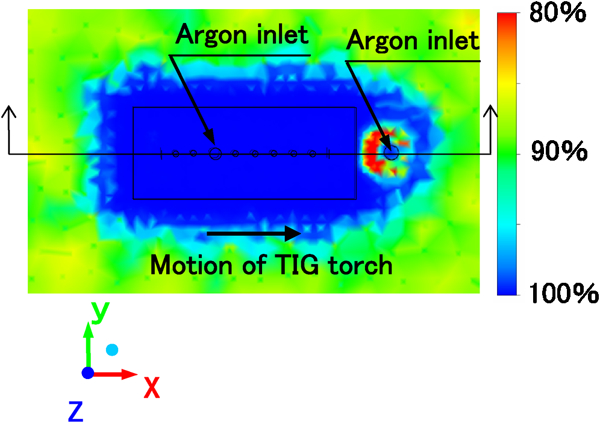
Image of argon content distribution at floor level: plane view; argon supply rate: 10 L min−1; gap: 5 mm
Oxygen content in shielding box
When the shielding box is moved in the X axis direction while an oxygen sensor is remained in a fixed position, the sensor can record the oxygen content near the floor in the box from the front wall to the back wall
Figure 10 Figures 10 and 11 show the measured oxygen content in the box. The distance between the oxygen sensor and the front of box is shown on the horizontal axis. For an argon supply rate of 10 L min−1 and a gap of 5 mm, the oxygen content ranges from 0·5 to 2·6%, as shown in Fig. 10. Therefore, air clearly flows into the box. The experimental result does not agree with the result obtained from the CFD simulation without the torch (cf. Figure 2 Figure 3 Figure 4 Figs. 2–5). On the other hand, for an argon supply rate of 20 L min−1 and a gap of 5 mm, the oxygen content ranges from 0·1 to 0·3% as shown in Fig. 11, indicating that little air flows into the box. This result agrees with the CFD analysis (cf. Fig. 7).
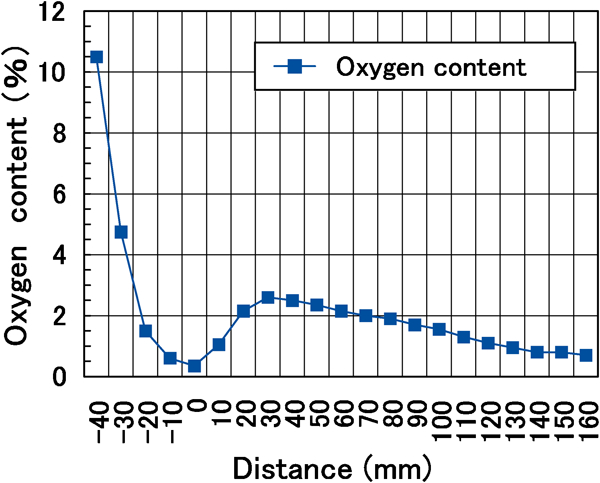
Oxygen content in conventional shielding box: argon supply rate: 10 L min−1; gap: 5 mm
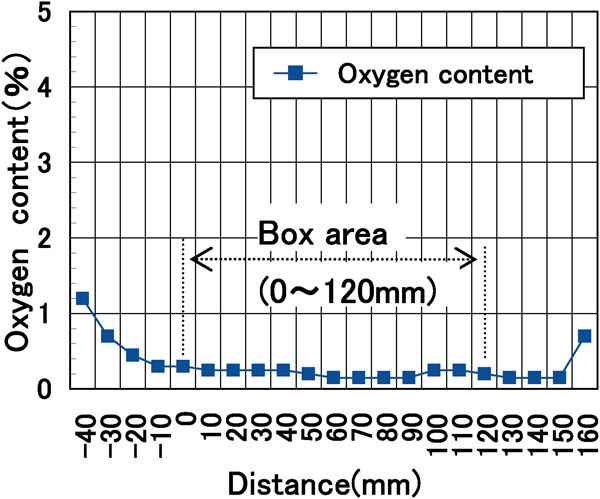
Oxygen content in conventional shielding box: argon supply rate: 20 L min−1; gap: 5 mm
The result shown in Fig. 9 of a model with the welding torch indicates that there is an area of high oxygen content between the shielding box and welding torch. This result partly corresponds with the experimental result of Fig. 10. As far as the oxygen content is concerned, the analysis of shielding gas behaviour by the CFD simulation should be made by a model with a welding torch.
Relation between oxygen content and extent of oxidation on bead surface
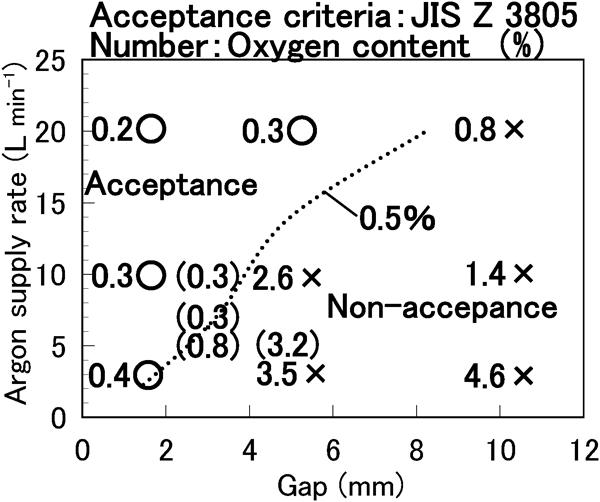
The relation between shielding conditions used for TIG welding and the extent of oxidation on the bead surface is shown in Fig. 12. Under the condition of a gap of 5 mm which may appear in actual welding practices, an argon supply rate of 20 L min−1 can guarantee the production of a sound weld. The electron spectroscopy for chemical analysis profiles of the bead surface made with an argon supply rate of 20 L min−1 are shown in Fig. 13. Nitrogen from nitrogen oxide was found on the bead surface (Fig. 13a), but after etched with an argon ion beam for ∼300 s, no nitrogen was observed in the profile (Fig. 13b). Therefore, these results suggest that a very thin nitrogen oxide film was formed on the surface of weld bead. The oxygen content increased after etching and the filler metal contains metal oxide (cf. Table 3). It is thus considered that the source of oxygen is filler metal of TIG.
Relationship between oxygen content and extent of oxidation on bead surface
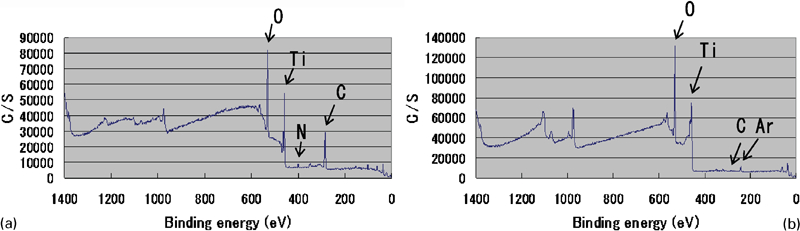
Electron spectroscopy for chemical analysis result of weld bead surface: argon supply rate: 20 L min−1; gap: 5 mm
Utilising the results obtained in this study, the internal structure of the box was attempted to be improved. Figure 14 shows an example of the argon flow simulation by improved numerical model. In this figure, the separator with a slit is below the header. It can be seen that argon flow through the slit of the separator, shields on a virtual weld bead surface uniformly. As one of the attempts, a separator was set in the shielding box so that argon can flow directly on the bead surface instead of on the box walls. Figure 15 shows the oxygen content in the improved box for an argon supply rate of 10 L min−1 and a gap of 5 mm. It was found that the oxygen content in the box ranged from 0·1 to 0·2% and a sound weld was produced under a half of the necessary argon supply rate for the conventional box.
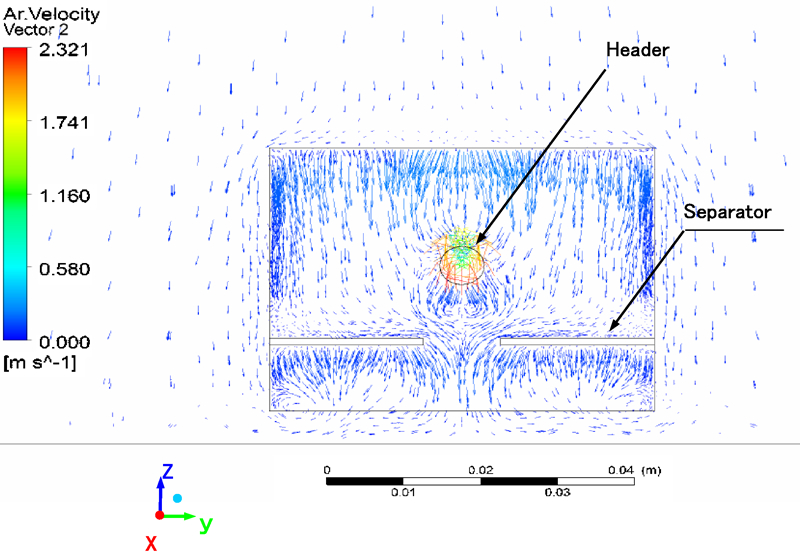
Simulation image of argon flow (improved model): front view; argon supply rate: 10 L min−1; gap: 5 mm
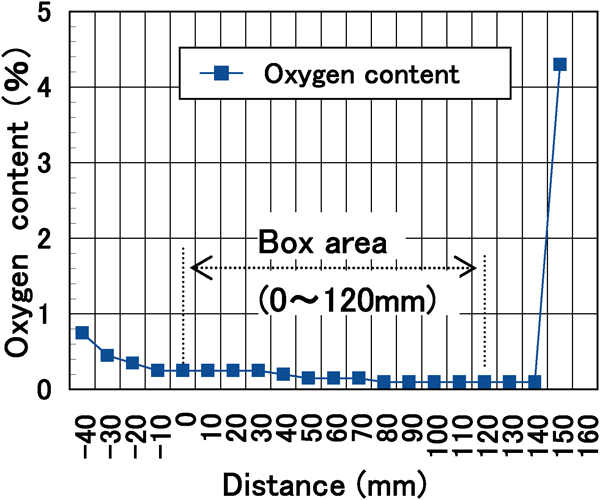
Oxygen content in improved shielding box: argon supply rate: 10 L min−1; gap: 5 mm
Conclusions
In this paper, the authors proposed a method for analysing shielding gas behaviour by means of CFD. They analysed shielding gas behaviour by simulating argon flow in a trailing–shielding box. The conclusions of the present study are summarised as follows.
The shielding gas behaviour in the CFD simulation agrees satisfactorily with the actual behaviour in terms of the estimated oxygen content.
The experimental results suggest that the CFD simulation model can predict the behaviour of argon flow.
Based on the CFD simulation results, the structure of the shielding box was improved. Satisfactory shielding was obtained in the improved shielding box under a half of the necessary argon supply rate for the conventional box.