
Abstract
Pipeline girth welds were made by manual metal arc and semiautomatic flux cored arc welding processes, both without post-weld heat treatment. The residual stresses in these welds were measured by neutron diffraction on ANSTO's strain scanner, Kowari. The two welds had similar residual stress values and profiles. An integrity assessment of the welded branch connection was performed with a conservative estimate based on the measured values of residual stress, and values of residual stress predicted by BS 7910. The critical crack size based on the measurements was almost twice as large, showing the value of these measurements.
Introduction
Residual stresses are the result of incompatible strains, which are caused by most manufacturing processes, particularly welding, forging and casting.1 Welding generates significant residual stresses which may contribute to premature failure by a number of mechanisms including fatigue, stress corrosion cracking (SCC), hydrogen assisted cold cracking (HACC), or fracture. Post-weld heat treatment (PWHT) is often carried out to reduce residual stresses and, for ferritic welds, reduce the risk of HACC. However, these welds were made without PWHT and must be assessed using the assumed high levels of residual stress in analysis codes such as BS 7910 (Ref. 2) and R6.3
There are a number of methods of assessing the effect of residual stresses on structural integrity. The BS 7910 and the R6 codes categorise stresses as primary or secondary; a primary stress does not reduce if the structure deforms while a secondary stress does reduce.
Primary stresses are produced by applied external loads such as pressure, deadweight or interaction from other components. Secondary stresses are generally produced as a result of internal mismatch caused by, for example, thermal gradients and welding processes. One significant secondary stress is residual stress.
In terms of structural integrity, primary stresses contribute to both plastic collapse and brittle fracture while secondary stresses only contribute to brittle fracture.
Ainsworth4 conducted a series of experiments which demonstrated that the treatment of residual stresses by the R6 code was extremely conservative. Owing to this, there are considerable advantages in using actual residual stress values rather than the high values assumed in analysis codes.
Measured and predicted residual stress profiles
Fracture mechanics assessments require accurate values of residual stress, or must use conservative estimates which are typically close to the yield strength. There are limited published residual stress measurements on ferritic girth welds (Table 1), made by neutron diffraction (ND) and deep hole drilling (DH) [Faure5 (DH), Smith6 (DH), Law7 (ND), Neeraj8 (ND)]. Measurements of ferritic welds have been made on welds in plates and T-joints [Pierce9 (ND), Wimpory10(ND, DHD)]; these cannot be compared directly with girth weld measurements as they have different restraint and resulting stress states. The results of measurements on austenitic steel welds may differ from ferritic welds as there is no phase change [Neeraj8 (ND), Bouchard11 (ND, DH)].
Published maximum residual stresses in girth welds made without PWHT (MPa) (percentage of yield stress value in brackets)
The maximum reported residual stress values are given in Table 1 for girth welds made without PWHT. Where the yield strength is known the stresses are also reported as a percentage of the yield strength in brackets.
The average and maximum measured residual stresses in the weld direction were 130 and 212% of yield strength. In the cross-weld direction the average and maximum stresses were 89 and 190% of yield.
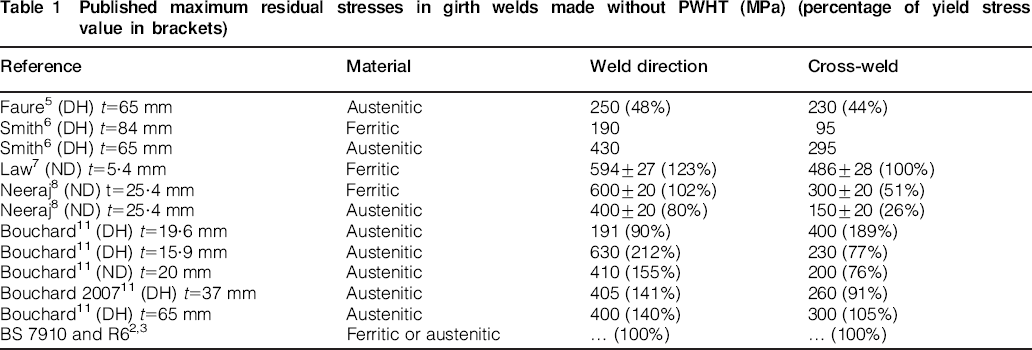
Estimates of residual stress from integrity codes such as BS 7910 and R6 are shown in Figs. 1 and 2. The predicted residual stresses in BS 7910 are based on experimental data, and vary with heat input but not with thickness. For pipe girth welds the residual stress profiles from the R6 assessment code are identical to BS 7910 for weld direction and cross-weld stresses.
Predicted and measured along weld (pipe hoop direction) residual stresses: measured stresses include ring slitting correction; average error is 36 MPa and maximum error is 57 MPa

Cross-weld residual stresses (axial pipe direction) in weld material
Sample details
The girth welds were made on a 1067 mm diameter grade X70 gas pipeline with specified minimum yield strength of 483 MPa. The pipe was produced by cold forming plates through the UOE process; by bending a steel strip in to a U shape (U), forming this into a full hoop (O), followed by welding and mechanical expansion (E).
Two welds were measured: a manual metal arc weld in 24 mm thickness pipe and a semiautomatic flux cored arc weld in 30 mm thickness pipe. Typically for gas pipeline welding, both welds were made without post-weld heat treatment.
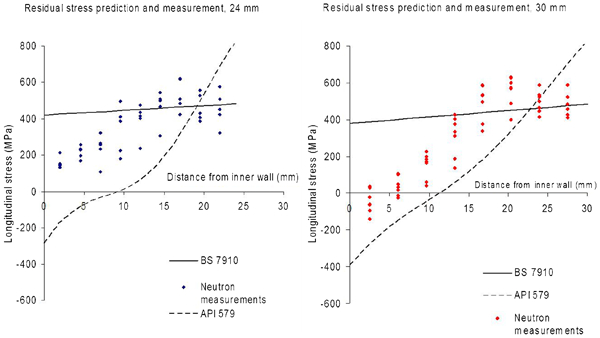
Each pipe was cut circumferentially to make a ring 500 mm long axially (Fig. 3). This was cut axially and the springback was measured. A second axial cut was made to produce a curved shell ∼500×500 mm with the weld lying in the centre.
Pipe cutting plan
The sample cutting procedure had two effects:
a global stress change as the pipe was slit open in an axial direction. After cutting the pipe, the cut edges may open or close
a local edge effect across the weld at each of the axial cuts due to changes in material constraint.
Springback
The springback that occurs after cutting is a function of the global bending moment imbalance, and is dominated by the parent metal residual bending stresses. The amount of material in the weld is small compared to the total sample. For the 24 mm pipe with a measured weld width of 26 mm, the weld volume is ∼3% of the plate volume. Although the stresses in the weld are different to those in the parent, the stiffness of the pipe wall means that the ring opening is near uniform (see the section on ‘Edge effects’).
The bending stress is given by σ = Et(1/Do−1/Df) where Do, Df are the original and final midwall diameters, t is the wall thickness, and E is the Young's modulus.12 From the measured displacements the elastic bending stress can be calculated and added to neutron diffraction results to derive the original stresses. The calculated bending stresses are linear and elastic. Where ring opening has occurred the original stress was tensile on the outer surface, and compressive at the inner. The cutting technique can only assess changes in hoop stresses.
The springback during ring slitting was 47 mm ring opening for the 24 mm thick pipe and 51 mm for the 30 mm thick pipe. These ring openings are equivalent to the release of a bending stress of 62·2 MPa for the 24 mm and 84 MPa for the 30 mm thickness, tensile at the outer wall and compressive at the inner wall. This linearly varying bending stress has been added to the measured hoop direction residual stresses in results.
Edge effects
Local deformation occurs at end of cut weld due to change in restraint; this deformation is exploited by the Contour method13 of calculating residual stress. The effect of this change in restraint will affect the residual stresses. The change in residual stresses will reduce away from the cut edge. These effects can be estimated by Chill Modelling.14
The strains were measured in the middle of the plate, away from the edges where the stress change is significant. In the centre of the plate, the change in stress due to cutting was calculated by the Chill modeling method to be <5%.
Neutron residual stress measurements
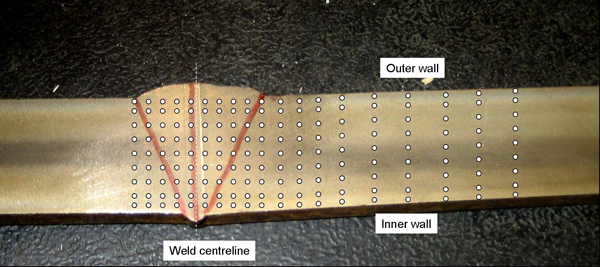
Constructive interference allows the neutron diffraction technique to measure the spacing between atomic planes; this and the unstrained lattice spacing d0 is used to calculate the strain in the direction measured. The residual stress measurements were performed on the Kowari strain scanning instrument at the Opal reactor at ANSTO. Because the basic principles of this technique are well known,15, 16, 17 only details specific to this measurement will be reported. Through thickness scans were performed on the weld and parent (Fig. 4) at the points shown in three directions orthogonal to the pipe axes.
Position of measurement points in 24 mm wall thickness pipe and weld
A nominal gauge volume of 3×3×3 mm was used. Each sample was measured at nine through thickness positions, at 20 positions along the sample to give 180 measurement points (Fig. 4). A monochromatic beam with λ = 1·666 Å and diffraction from Si{400} planes were used in this analysis. This combination of wavelength and scattering planes resulted in a scattering angle of 90°. The scattering vector is the bisector of the primary (beam into sample) and secondary (beam out of sample) neutron beams and is aligned with the strains in that direction.
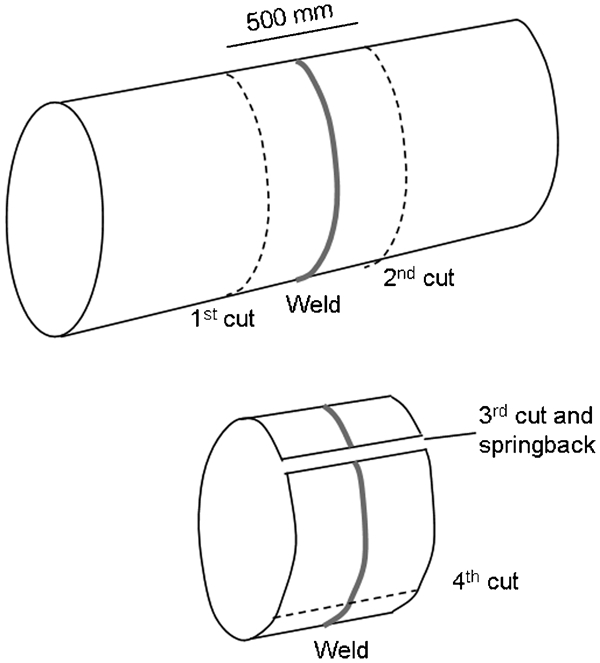
Three directions were measured, and the primary stresses were assumed to align with the sample principal axes and with the directions measured. The weld longitudinal direction is aligned with the pipe hoop direction and the weld transverse direction is aligned with the pipe axial direction (Fig. 5).
Orientation of sample, neutron beams (white arrows) and scattering vector (grey arrows) for (L to R) hoop, axial and radial strain components
A section through the weld and parent was cut into a 6 mm thick plate to derive stress free d0 values for each measurement point; this slice is shown in Fig. 4. The d0 determination relies on the assumption that the slice where the d0 values were measured is geometrically identical to the area of the welds measured, particularly the weld fusion boundaries. The through thickness stress is assumed to be zero and the system of three equations results in three in-plane stress components and the d0 value. This procedure is recommended in the ISO technical specification18 and relies on the fact that the 211 reflection in bcc Fe is relatively insensitive to the presence of intergranular strains.16
Measurement results
The stresses were very similar for the two welds. The maximum stresses (596 MPa for the 24 mm and 590 MPa for the 30 mm thickness) were in the weld metal in the hoop direction (Fig. 6), the errors were an average of 36 MPa and a maximum of 57 MPa. The stresses in the axial direction were lower with a maximum value of 348 MPa for the 24 mm and 321 MPa for the 30 mm thickness (average error 32 MPa, maximum error 53 MPa). The radial direction stresses were smaller, a maximum of 188 MPa. The error in measurement position was estimated as being <1 mm.
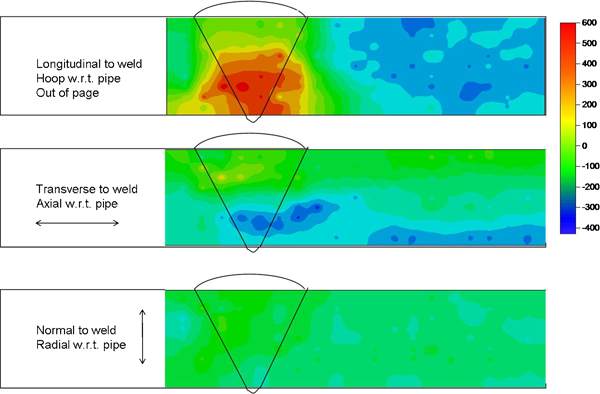
Longitudinal, transverse and radial residual stresses in 24 mm thick pipe and weld
Weld direction stresses (pipe hoop direction)
The weld direction residual stress predictions from R6 and BS 7910 are shown together with the measured values (Fig. 1).
The high residual stresses along the weld direction are expected, particularly as the sample was cut from a section of pipe which has not been hydrostatically strength tested. Proof testing such as hydrotesting to some large fraction of the yield will significantly reduce these stresses. BS 7910 estimates of the effect of hydrotesting to a hoop stress equal to yield will reduce the stresses to 48% of yield (231 MPa). Cracking due to stresses in the weld direction rarely extends into the parent material as the parent metal toughness is higher than the weld, and the parent metal residual stresses are low.
Cross-weld residual stresses (pipe axial direction)
The cross-weld residual stress predictions from R6 and BS 7910 for a heat input of between 1·2 to 2·9 kJ mm−1 are shown together with the measured values (Fig. 2).
Brittle fracture of weld defect
To compare the effect of different assumed residual stress distributions, a fracture mechanics case is presented of a surface breaking inner wall 3×25 mm flaw in the girth weld under a global axial stress of 300 MPa, plus any assumed residual stresses. This uniform stress ignores the inevitable stress intensifications from weld geometry such as axial offset, angular misalignment, weld bead angle. The stress which controls fracture for this flaw is the axial stress, transverse to the weld. The toughness value of the weld was conservatively assumed to be a minimum of 40 J Charpy V value at the minimum expected service temperature, which was converted to a K1C value of 76·5 MPa m1/2 using Appendix J.2·1 in BS 7910-2005. The analysis was carried out in the British Nuclear R6 code.
Three estimates of the measured residual stress were used in the analysis:
assume the residual stresses are equal to the yield strength (483 MPa)
the residual stress prediction from BS 7910 Annex Q and R6 (Fig. 2)
a conservative estimate of the residual stress was based on the measured values. As the path length of any possible crack is not known, the maximum measured value at each through wall position is used (Fig. 7).
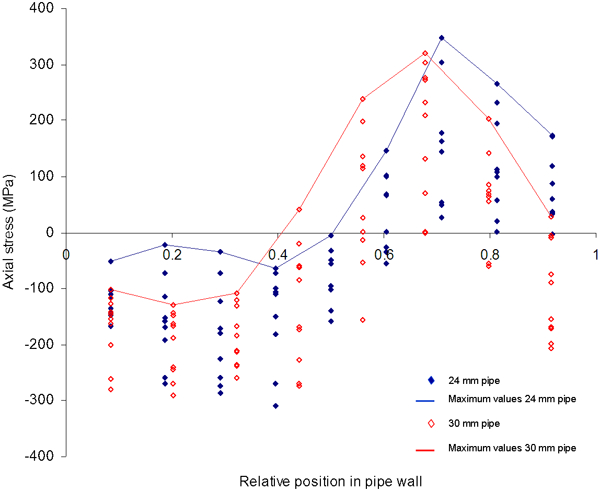
Measured and maximum axial weld stresses
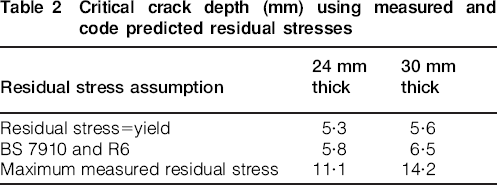
The prediction from BS 7910 was found to be conservative. The value of making project specific measurements is that the actual critical crack size is almost twice as large (Table 2).
Critical crack depth (mm) using measured and code predicted residual stresses
Conclusions
The residual stresses in a 24 mm thick manual metal arc girth weld and a 30 mm thick semiautomatic flux cored arc weld were measured by neutron diffraction using ANSTO's residual stress diffractometer, Kowari. The residual stress values and profiles were similar. The measured residual stresses were significantly different to those predicted by models such as BS 7910.
The critical crack sizes were calculated from code estimates, and the conservative estimate based on the measured residual stresses. Critical crack sizes based on residual stress estimates from BS 7910 were conservative (shorter than) the critical crack size derived from measurements. The value to industry of this work is to better quantify the effects of residual stress on component integrity.