
Abstract
A cost and time effective process was developed to create spot weld failure parameters for crash models implemented in LS-DYNA. The process includes a design of experiment (DOE) approach for coordinating data collection, welding and testing, finite element modelling, statistical analysis, validation, and implementation. The DOE approach was used to coordinate testing of a reduced set of samples over a large range of material strengths and gauges. This testing included cross-tension, lap shea, and coach peel type evaluations. Computer models for each metal combination and sample geometry were developed to obtain normalised tensile, shear and bending stress at the incidence of weld failure. These normalised loads were then regressed to extend these results to all possible material combinations within the DOE space. These results were then used to estimate the spot weld failure parameters for all the stack-ups of interest. A set of multiweld T-section samples were then welded, physically tested and computer modelled to validate the failure parameters developed from the small single weld tests.
Introduction
LS-DYNA has been used to predict crash performance by the automotive industry for decades. Typically, resistance spot welds have been modelled for crash simulation in LS-DYNA as single beams, surface contacts or solid elements.1 The solid element approach has been included in automotive full vehicle crash models recently.2,
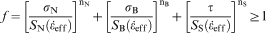
3 In this approach, a single spot weld can be modelled as one or multiple solid elements. Behaviour of spot weld is modelled by coupling material isotropic hardening plasticity with a specific failure model in LS-DYNA.1 A specific failure model taken from Ref. 2 is as follows:
 is effective strain rate, and
 ,
,
 and
and
 are strain rate dependent axial stress, bending stress and shear stress at failure. The model includes six empirical failure parameters (SN, SB, SS, nN, nB and nS). These failure parameters are specific to each weld size and material stack-up. Since a full vehicle typically includes 2000–5000 welds in a range of stack-up configurations, defining all the necessary failure parameters can be a daunting task requiring thousands of mechanical tests. Few research programs have been done for developing these spot weld failure parameters with an effective method in terms of cost and time.2,
3
are strain rate dependent axial stress, bending stress and shear stress at failure. The model includes six empirical failure parameters (SN, SB, SS, nN, nB and nS). These failure parameters are specific to each weld size and material stack-up. Since a full vehicle typically includes 2000–5000 welds in a range of stack-up configurations, defining all the necessary failure parameters can be a daunting task requiring thousands of mechanical tests. Few research programs have been done for developing these spot weld failure parameters with an effective method in terms of cost and time.2,
3
This paper develops a cost and time effective process to create spot weld failure parameters for a range of metal stack-ups. The process can be used to develop failure parameters for models such as that described above. As an example, this paper discusses the process to develop the failure parameters as defined by the failure model (equation (1)) above. A similar approach can be defined for determining failure parameters associated with similar models. The process includes a design of experiment (DOE) approach to define the material/stack-up space, welding and testing, finite element modelling, statistical analysis, validation and implementation, as illustrated in Fig. 1.
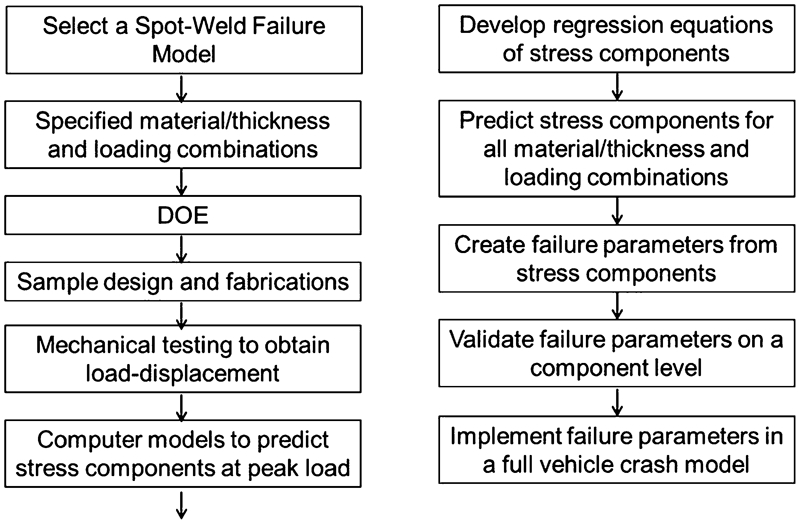
General process to develop spot weld failure parameters
The DOE approach used here has been demonstrated previously in studies of resistance spot welding manufacturability.4– 6 The methods allow for reduced numbers of tests for a defined space of study. In this effort, that space is defined by variables including material combination, thickness combination, test orientation and test speed combinations. As suggested above, performance was assessed through mechanical testing. Cross-tension, lap shear and coach peel weld samples were prepared and welded by following a typical automotive standards. Of note, this study did not address weld size. For all tests, the process was adjusted to meet minimum button size requirements for the specific stack-up. This allowed for lower bound failure criteria to be developed in this study.
As suggested above, LS-DYNA simulations of each mechanical test were used to interpret spot weld behaviour. The results from the individual physical tests were then incorporated into the analysis of the computer models to obtain the three principal stresses at peak load. These principal stresses were then regressed to extend these results to all possible material combinations described by the original DOE factors. This intermediate result was used to estimate the six parameters required for definition of the failure surface. These failure parameters were once again regressed to develop the final failure parameters for each material stack-up.
For verification of the developed failure criterion, a set of multiweld T-section samples were assembled, physically tested and modelled. Though not described in this paper, the spot weld failure parameters were implemented in a full vehicle for crash analysis.
Design of experiment and fabrication of test samples
As described above, Fig. 1 illustrates the process flow used to develop spot weld failure parameters. Detail with regard to test sample geometries, material/thickness combinations, the designed test matrix (using DOE approaches) and the fabrication procedures of test samples.
Sample geometry
Figure 2 shows the typical sample geometries for the three basic types of welded samples: cross-tension (KS-II), lap shear, coach peel samples and a T-section sample. The cross-tension (KS-II), lap shear and coach peel test samples include a single attachment and are widely used to evaluate the spot weld mechanical behaviour of spot welds.2,7– 10 As suggested above, sufficient mechanical testing is required to allow determination of the six failure criterion parameters from (for example) equation (1). This requires a minimum of six tests with distinct combinations of tensile, shear and bending loads. The coach peel and tensile shear tests account for two of these combinations. The additional conditions are achieved by testing the KS-II samples at four different angles: 0, 30, 60 and 90°. The T-section sample, also shown in Fig. 2, includes 40 spot welds. This test configuration was used for evaluating spot weld strength and fatigue life by Seeger et al. 2 and Mori and Amago.11
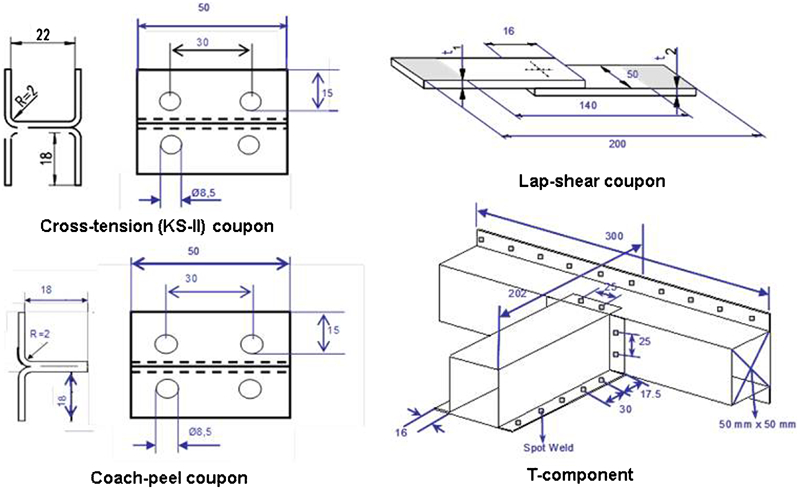
Sample types to develop spot weld failure parameters
To assure stability during mechanical testing, holes were added in both the single weld samples as well as the multiple weld T-section specimens. These holes were used to bolt the samples to the fixtures to eliminate slippage during testing. The holes placed in the lap shear samples measured 13·5 mm (0·530 in.) in diameter and were centered 25·4 mm (1·000 in.) from the end. Bolts of 13 mm (0·5 in.) were used to connect the sample to the sample holder for testing. Holes were also added to the cover plate on the long beam on the T-section sample. These holes were used to attach the cover plate to the fixture.
Specified material/thickness combination
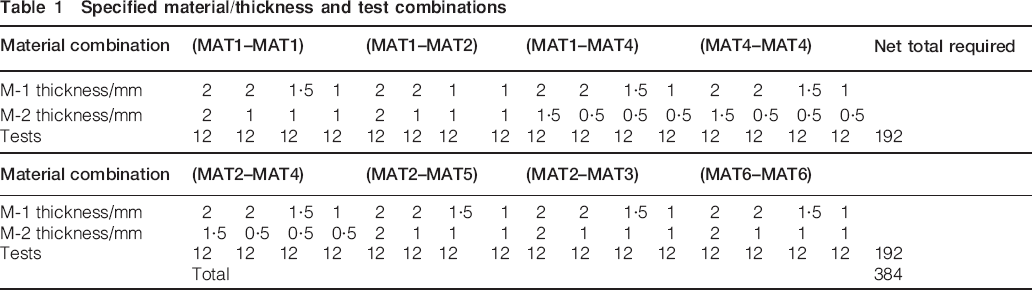
As illustrated in Fig. 1, developing failure criterion data for component simulation requires an understanding of all combinations of material, thicknesses, stack-ups and loading rates. As an example, Table 1 shows a specific material/thickness and sample type combination for a representative automotive body component. There are eight material stack-ups here which include six materials. Materials (MAT) 1, 2 and 6 are included in three stack-up configurations, materials 3 and 5 in two, and material 4 (MAT 4) in four. As suggested above, to fully evaluate the failure criterion parameters for each combination, independent tests are required. Further each test needs to be conducted statically and dynamically to obtain the strain rate dependent failure parameters. Thus, at least 12 mechanical tests for each combination are needed. As suggested in Table 1, a full empirical evaluation of the failure criteria for the component under consideration would require 384 separate mechanical tests. Assuming five replicas for each test, the total number of tested samples will be 1920. Clearly, for a full vehicle, the material/thickness combinations are far more than the one listed in Table 1, and the volume of required mechanical testing would be overwhelming. This fact necessitated the DOE approaches outlined below.
Specified material/thickness and test combinations
Design of experiment
To reduce the number of mechanical tests, a DOE was conducted for the combinations shown in Table 1. The experiment was configured to address the following variables:
material combination
thickness combination
specimen type
testing angle (KS-II type specimens only)
impact rate (static versus dynamic).
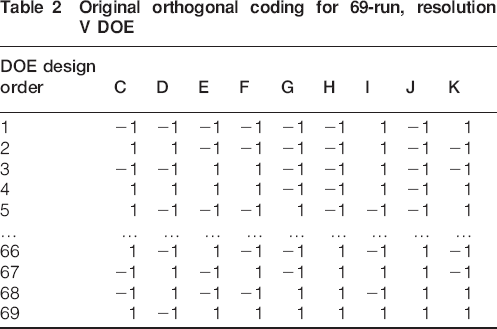
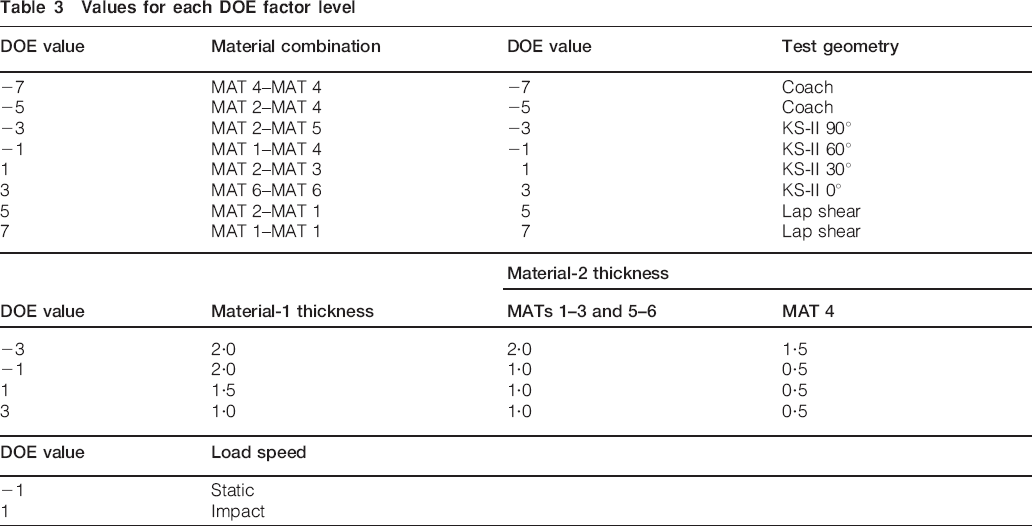
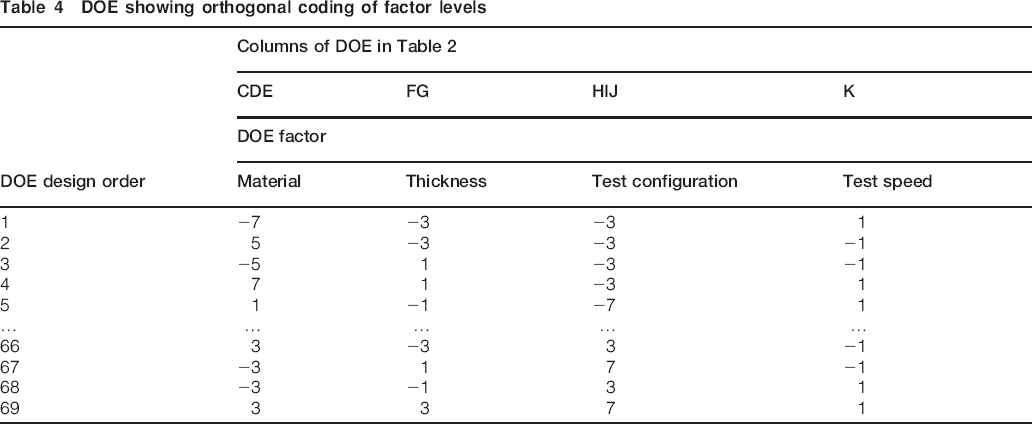
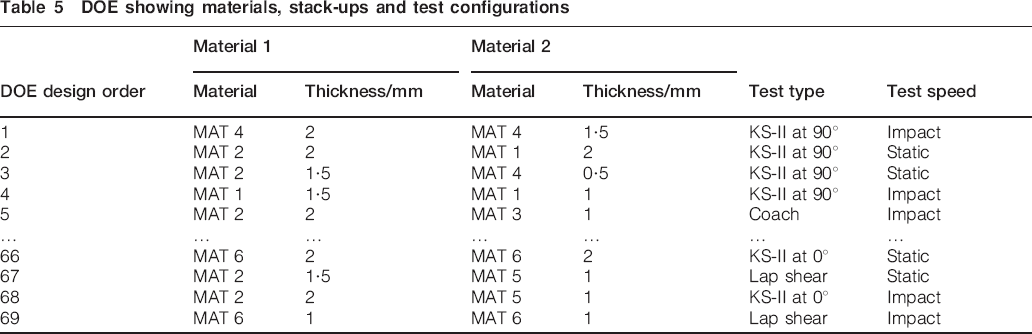
The specific experiment used here a specially two-level, nine-factor, 69-run base design. This specific experimental design allows full resolution nine main effects and all two factor interactions.12 The design itself is a compilation of an eight-factor 48-run John's three-fourths fraction experiment and a nine-factor 24-run experiment with the replicated runs removed. This basic two-level design was then reworked to allow inclusion of multiple level variables. The basic coding (+1/−1) of the two-level design is shown in Table 2. The desired final experiment included both two-level and multiple level factors. Multiple level factors were created from combining two level columns. For example, the three columns (C, D and E) Table 2 were assigned to produce the eight-level material variable. Specific multiple level variables created in this way are shown in Table 3. These include (as mentioned) an eight level variable for the material combinations and an eight-level variable for test geometry. Of note, since only six test geometries were used in this study, the coach peel and lap shear geometries are repeated in the text matrix to complete the column. In the final experiment, there is also a four-level thickness combination variable, and a two-level variable for the loading speed. The coded version of the final design is provided in Table 4. The design, repopulated with the actual experimental variables, is shown in Table 5. This final design represents an 80% reduction in the numbers of mechanical tests required to define all failure criterion parameters for the component of interest.
Original orthogonal coding for 69-run, resolution V DOE
Values for each DOE factor level
DOE showing orthogonal coding of factor levels
DOE showing materials, stack-ups and test configurations
Welding Test samples
All test specimens were welded using schedules described in typical automotive standards. These schedules provide details for electrode designs, electrode forces, weld times, pulsing parameters, hold times and minimum button sizes based on the specific governing metal thickness of the stack-up. In establishing the schedules used, the weld current was adjusted to meet or minimally exceed the minimum button size requirement.
Mechanical testing
Static sample testing
A 46 kN (10 kip) Instron Model 4204 electromechanical test system was used to perform static tests on the welded samples. The testing fixtures used for KS-II, coach peel and lap shear tests are provided in Figs. 3 and 4. Testing was performed by locating sample holders in the jaws of the machine and aligning the holes in the welded sample with the bolts or pins in the fixtures. The bolts in the lap shear sample holders were tightened before testing. Example of lap shear specimen prepared for testing is given in Fig. 4.
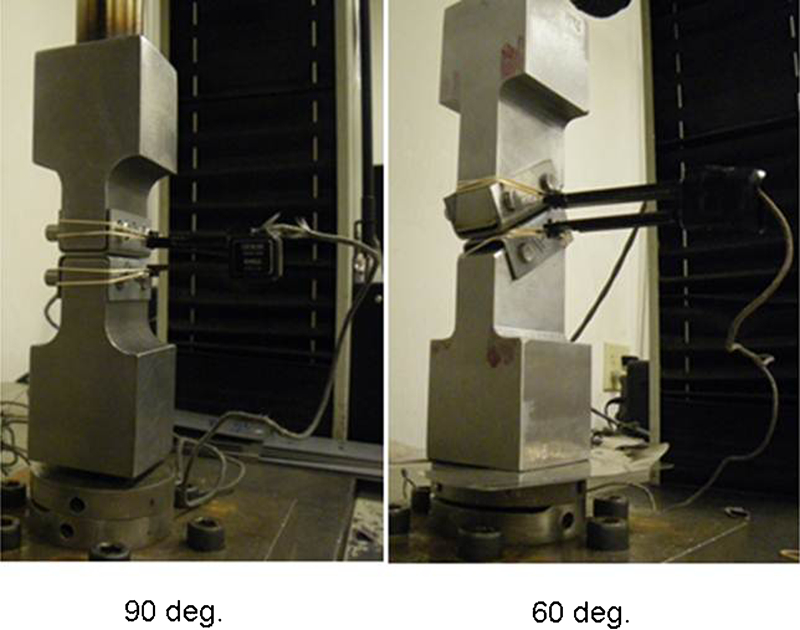
Static mechanical testing: KS-II test set-up
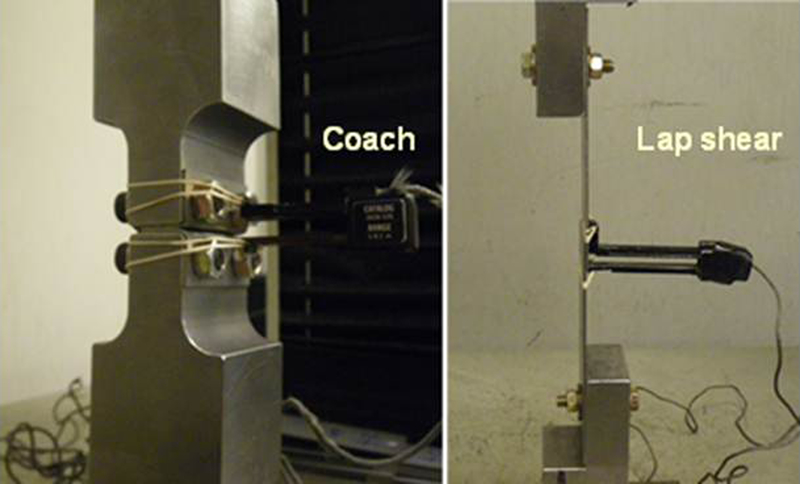
Testing set-ups for coach peel and lap shear samples
All static testing was performed at a 50 mm min−1 (2 in. min−1) crosshead speed. Sample displacement was measured using both an extensometer as shown in Figs. 3 and 4 as well as through crosshead position measurements. The load and position measurements were recorded at a sampling rate of 5 Hz. The data were used to determine peak loads, displacements at peak load and absorbed energy up to peak load. The energy values were calculated from digital integration of the load–displacement data up to the peak load position. Figure 5 shows the recorded load and displacement history for a KS-II sample oriented at 90° to the fixture. Displacement data from both a crosshead positioner and an extensometer are shown. It was noted that higher displacements were recorded by the crosshead positioner compared to the extensometer. This was attributed to slippage between the fixture and the sample. It was critical to have the accurate measurement measurements here, since the data were be used in the computer models to obtain the axial, shear and bending stress components. As a result, extensometer results were used in the subsequent analyses.
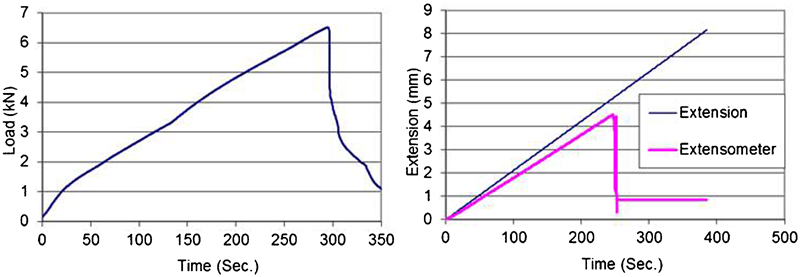
Load and displacement history for KS-II specimen oriented 90° to fixture
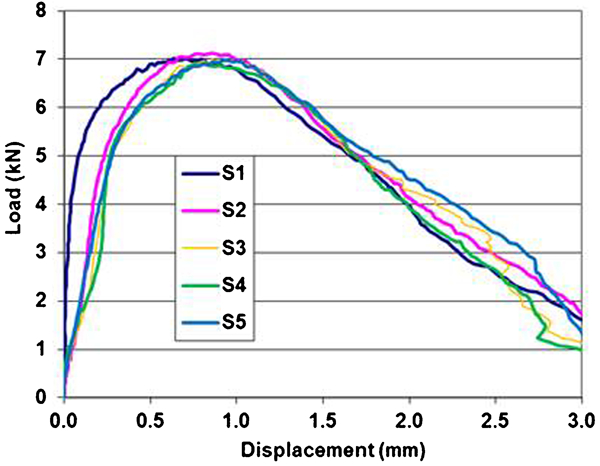
Figure 6 shows the typical measured load–displacement curves for five replicate KS-II samples oriented at 90° to the fixture. These load–displacement curves were obtained by combining the load–time and displacement–time plots as shown above. Five replicas were included to assure reproducibility of the data. It was noted that variability in these tests was largely related to inconsistencies in the actual spot weld sizes on the specimens. Typically, larger spot weld sizes resulted in higher peak loads. In this work, the three samples which obtained the closest peak loads were used for the subsequent computer analysis to establish the associated axial, shear and bending components.
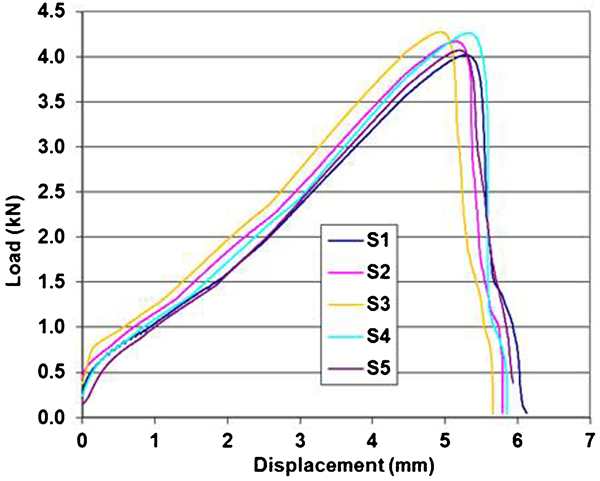
Typical static testing results for five replicate KS-II 90° runs
Dynamic sample testing
The dynamic tests were performed on a modified Dynatup (General Research Corporation) Model 8250 instrumented drop weight tower. The sample fixtures used here were the same as described for the static testing above. The dynamic load was measured at the reaction point during the impact event. The dynamic load measurements were made using a strain gauge type load cell attached below the rigid table structure. Displacement was measured using a linear voltage displacement transducer placed between the sample attachment points, as well as by a clip gage. About the same displacement up to peak load was measured through the two approaches. For the analysis described below, only the displacement up to the peak load is important. It should be pointed out that the measurement accuracy could be significantly affected by the fixtures and the bolt. In this study, the fixture was designed to minimise that problem. The specimen was gripped in a manner to reduce any slippage in the grips. Figure 7 shows the typical measured load–displacement curves for five replicate lap shear samples. Consistent peak loads were measured in each case.
Typical replicate dynamic lap shear testing results
Creation of spot weld failure parameters for defined stack-ups
Computer modelling of mechanical testing
As suggested above, estimations of the tensile, shear and bending load components for each test were modelled in using a similar methodology as for full vehicle crash analysis. Similarities include mesh sizes for base metal, the approach for including the spot weld, and the analysis control cards. A 4 mm element size was used here, largely determined by the smallest spot weld size (3·5 mm) in this work. Of note, reducing the element size significantly increases the computational time in full vehicle crash analyses. Strain rate dependent material properties were assigned to the part in these simulations.
In the sample modelling, eight solid elements were used to represent one spot weld. Material properties for a spot weld including density, elastic modulus and Poisson's ratio, were defined in the LS-DYNA input file. In the LS-DYNA version 971, detailed stress–strain curves cannot be defined for spot welds. Instead, a bilinear stress–strain curve can be defined by inputting yield strength and tangential modulus. Separate material strengths were assigned to the base metal and weld nugget here. The yield strength of the base metal was taken from available material properties; that for the spot welds was estimated from measured nugget hardnesses.
Figures 8 and 9 show the comparison between finite element models and the measured loads for KS-II_30 and coach peel samples respectively. In the finite element models, the testing fixtures themselves were modelled with rigid elements. The bottom fixture was fixed and the load was applied to the upper fixture. The stress components for normal, bending and shear loading were then collected at the observed peak loads.
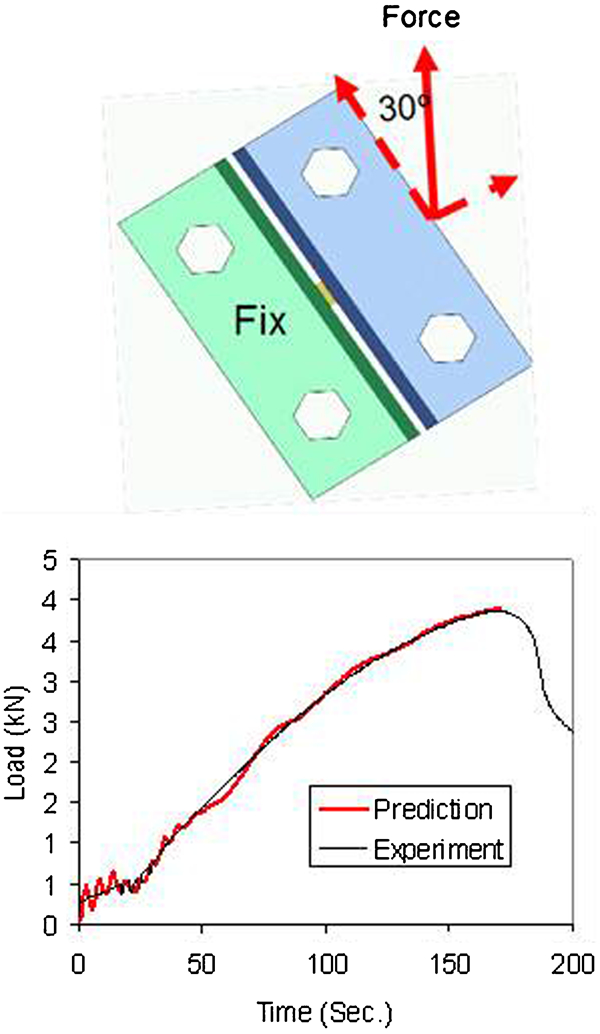
Comparison of modelling and testing results for KS-II sample loaded at 30° angle
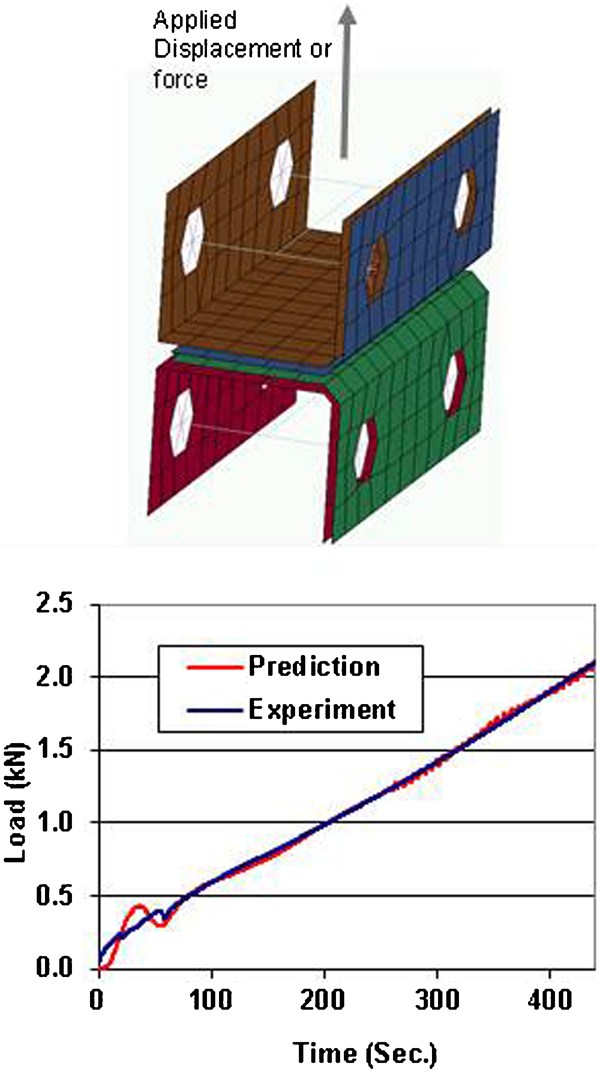
Comparison of modelling and testing results for coach peel sample
Statistical analysis of stress components
The shear, normal and bending stress components determined from the modelling efforts were then extrapolated to all the stack-ups in the design space using statistical analysis techniques. The statistical analysis included normalisation of the response data, selection of significant regression factors, statistical model development and reverse transformation of the statistical model back into engineering units. Using this analysis technique, regression equations of stress components were developed. The primary inputs to these regression equations were:
material combination
thickness combination
test orientation
test speed.
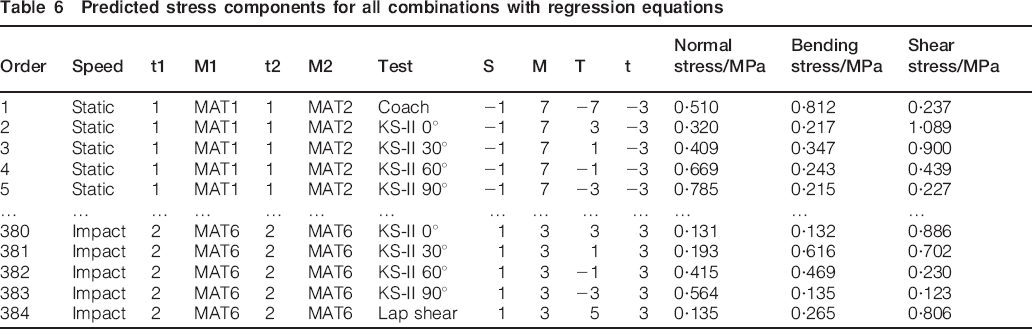
The resulting regression models for the shear, normal and bending stress components were then used to expand the limited physical testing results in the experiment to predict all possible combinations of material stack-up and test configuration within the bounds of the experiment. Table 6 shows examples of the predicted stress components for the 384 possible combinations.
Predicted stress components for all combinations with regression equations
Relaxation determinations of spot weld failure parameters
The predicted stress components for the six test types (tensile shear, coach peel, KS-II 0°, KS-II 30°, KS-II 60° and KS-II 90°) were used to estimate normal, bending, and shear strength and exponent coefficients in equation (1). This was done using relaxation methods. The six sets of stress components for each stack-up were first assembled into six equations. The unknowns in the equation are the coefficients for normal strength, bending strength and shear strength, as well as the exponents for each component. The commercial software MathCAD was used to solve the equations to obtain six unknowns at static conditions.
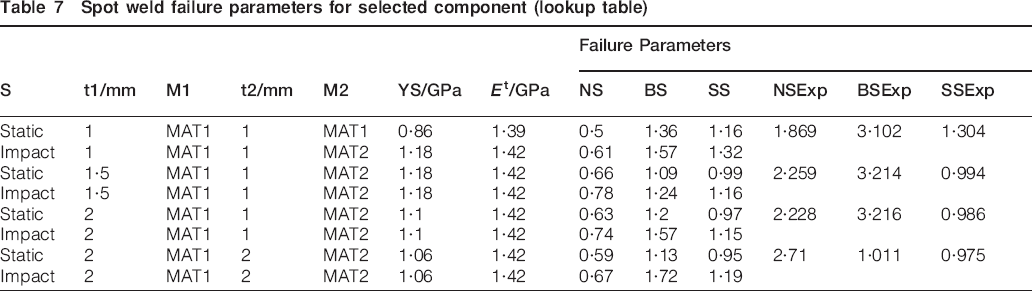
By solving the equations for each stack-up type, spot weld failure parameters for all combinations were generated. The failure parameters can be presented in a lookup table as shown in Table 7. To facilitate the use of failure parameters, these results were also fitted with regression equations. These regression equations were embedded in an Excel file to allow users to visualise the failure surface by inputting the material combination and loading speed. Figure 10 shows an example of failure surface for a material and loading combination.
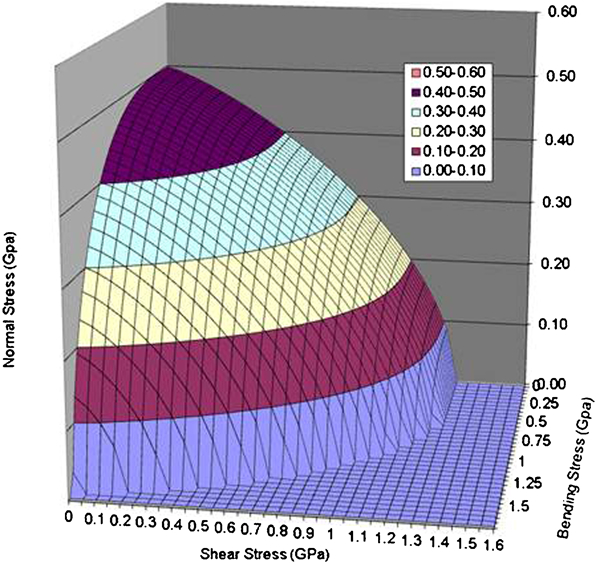
Typical failure surface plot created from fitted failure parameters
Spot weld failure parameters for selected component (lookup table)
Validation of empirically defined of spot weld failure parameters
The failure parameters given in Table 7 were used to assess performance of specially designed T-section components. Twenty-four such T-section components, including a range of stack-ups as investigated in this work, were subject to modelling, fabrication and testing. The resulting T-component samples were tested with both lateral and longitudinal orientations, under static and dynamic test conditions. Time dependent data for both displacement and load were recorded for all of these tests. Loading of these specimen geometries was then modelled in LS-DYNA and individual weld failures were predicted using the failure parameters in Table 7. The predicted weld failures, deformations, and peak loads were compared to the results from the physical tests of each T-section sample.
Owing to the length constraints of this paper, only finite element model addressing transverse loading (Fig. 11) is discussed in this paper. Spot welds in these specimens were again modelled with eight solid elements. The fixture itself (as shown on the left of Fig. 11) was treated as a rigid wall. Resulting displacements for both static and dynamic conditions were applied via a half-cylinder contactor as shown in Fig. 11.
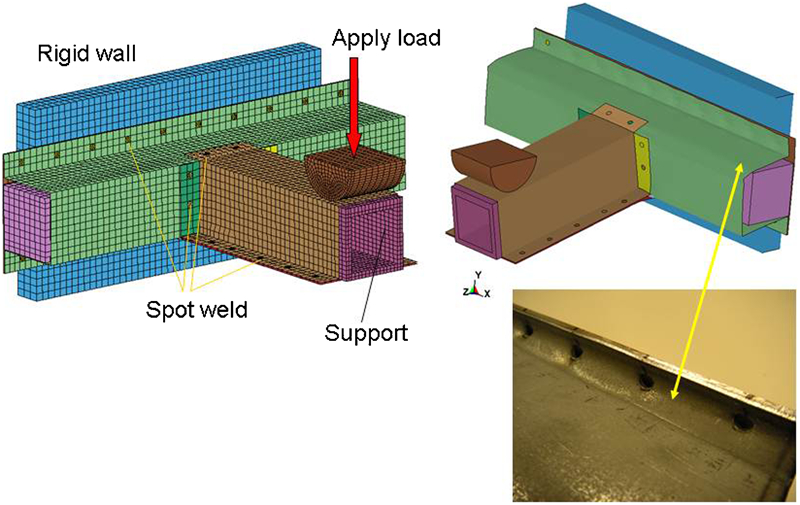
Spot weld failure prediction during application of transverse load on T-sample
The right-hand side of Fig. 11 shows a comparison of the modelling results and the physical test specimen. It is noted here that the physical sample shows partial failure of the spot welds, while the prediction suggests complete separation. Figure 12 shows a comparison of experimental and predicted load–displacement curves for this sample. It is noted that the model underpredicts peak force under static loading. These differences between modelling and testing are related to definitions of failure in this analysis. For the failure criteria described above, it is assumed that once the crack (at a spot weld) initiates, failure has occurred. For many components, however, a partially failed spot weld still has load carrying ability. As a result, higher loads were measured during testing than the model prediction. The crack propagation can be modelled in LS-DYNA by defining damage parameters, which is beyond the scope of this paper.
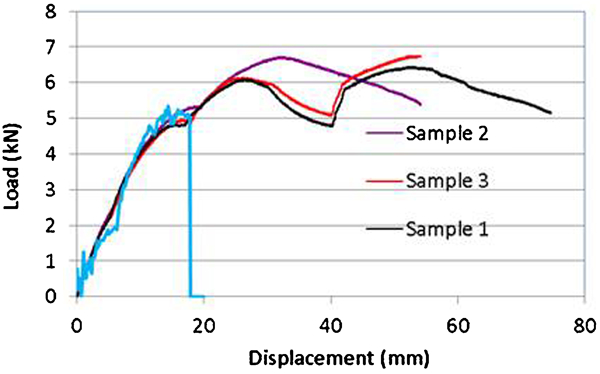
Comparison of load and displacement curves between testing and modelling T-specimen
As a follow-on activity, a full component model was implemented partially using these developed failure criteria. Based on the stack-up configuration, the failure parameters were found in the lookup table (Table 7) manually. It was time consuming to define all spot weld failure parameters in this way. Work is ongoing to link the failure parameter database with the preprocessing software of a crash model to assign failure parameters automatically.
Conclusions
Based on the results from this study, the following conclusion could be drawn:
An effective process including DOE, testing, modelling and regression analysis was developed to create spot weld failure parameters for failure models implemented in LS-DYNA.
Spot weld failure parameters were developed by conducting static and dynamic testing and modelling of the test geometry to extract principal stress components using regression and DOE methodologies. The failure surface developed using these methods defines the onset of cracking in the spot weld, not crack propagation, as the criterion for weld failure.
The accuracy of the predicted spot weld failure parameters were compared to actual tests and verified in T-section and full vehicle testing. Overall, the failure parameters have a reasonable accuracy. The spot weld model with failure parameters can predict the failure locations observed in the testing.