
Abstract
This paper describes the effect of Al content on the formation of acicular ferrite in low carbon steel welds. Inclusions and the microstructures of welds with three levels of Al content were analysed. Acicular ferrite was formed in the low and medium Al content samples, but not in the high Al content sample. In the low and medium Al samples, a TiO layer, which encourages acicular ferrite nucleation, was formed around the inclusions. Grain boundary ferrite was formed only in the low Al content sample. Inclusions in the low Al sample were predominantly composed of the amorphous phase, whereas those in the medium Al sample were composed of spinel structures. It was confirmed by electron energy loss spectroscopy analysis that boron existed in the amorphous phase. The formation of the amorphous phase enhances grain boundary transformation by absorbing boron, which stabilises austenite grain boundary, whereas the formation of spinel structures enhances intragranular transformation by suppressing the boron absorption.
Introduction
In recent years, a high strength high toughness and low alloy steel has been developed.1, 2 As a result, weld metals having appropriate mechanical properties are required for use with this high toughness and low alloy steel. There are two ways to achieve weld toughness. One is the formation of a lower bainite structure. This method requires Ni, which is rare metal, to control the hardenability;3 thus, this method results in a decrease in recycling efficiency and an increase in environmental load. The other is the formation of acicular ferrite.4– 7 This method requires only a small amount of Ti and B; thus, this method contributes to reduction in environmental load.
Acicular ferrite is produced in low carbon steel weld metals in order to improve strength and toughness.4– 7 Acicular ferrite is a type of ferrite that nucleates from non-metallic inclusions dispersed in a weld metal and grows radially from each inclusion.8, 9 The structure of acicular ferrite consists of interlocked fine grains, which results in weld metal with high strength and toughness. Thus, it can be seen that the toughness of weld metals depends on the volume fraction of acicular ferrite.9
Intragranular transformation, such as acicular ferrite, is a process that competes with grain boundary (GB) transformations such as polygonal and side plate ferrites.10, 11 To increase the volume fraction of acicular ferrite, it is necessary to suppress GB transformation and to promote intragranular transformation. Thus, boron is added to suppress GB transformation.4– 7 Boron segregates to an austenite GB and reduces GB energy. Through the addition of boron, the transformation from GB is delayed in terms of time, and the transformation start temperature is lowered.12– 14
Over the past few decades, there has been numerous studies on the types of inclusions that have the potential for the nucleation of acicular ferrite.15– 17 There have been some reports that the formation of acicular ferrite is activated by increasing the Al/O mass ratio to 1·0.18, 19 The authors of these reports stated that the Si–Mn glassy phase changed to a spinel structure (MnAl2O4), which has a low misfit value with ferrite, by increasing the Al content.15, 19, 20 However, Yamada et al. 21 reported that the TiO formed around the surface of inclusions has a Baker–Nutting orientation relationship to the adjacent ferrite and that the TiO layer encouraged the nucleation of acicular ferrite. While spinel structures are formed, the resulting interface with ferrite is not an ideal interface for encouraging ferrite nucleation. Thus, it had been considered that spinel structures are not effective as nucleation sites.
The relationship between the volume fraction of acicular ferrite and the Al/O mass ratio has not yet been clarified. In this study, in order to clarify the effect of Al content on the formation of acicular ferrite in low carbon steel weld metals, we investigated the relationship between the microstructures and the formed inclusions in samples having three different levels of Al content.
Experimental
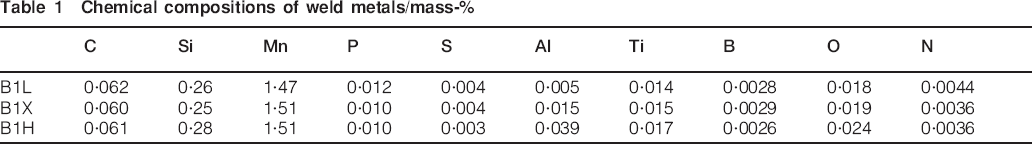
The materials used in this study were low carbon steel weld metals fabricated by the submerged arc welding process. Table 1 shows the chemical compositions of the weld metals used. Only the Al content was varied, the contents of the other elements remained constant. The Al/O mass ratios were 0·28 (B1L), 0·79 (B1X) and 1·63 (B1H).
Chemical compositions of weld metals/mass-%
Samples for metallographic observation were cut from the plane perpendicular to the welding direction and mechanically polished. For examination of the microstructure by optical microscopy, a 2% nital solution was used as an etchant. The volume fractions of acicular ferrite were measured using the ImageJ software under ×500 magnifications. The areas examined were 1 mm2. To evaluate the ferrite orientations, grain boundaries and grain sizes, electron backscatter diffraction (EBSD) analyses were conducted using a JEOL JSM-6400 scanning electron microscope. Orientation mapping for EBSD data was performed with a 300 nm step size. The EBSD samples were prepared by electropolishing at room temperature using a solution of 92% acetic acid and 8% perchloric acid under a potential of 25 V. For the measurement of inclusion density, mechanically polished samples were used, and the number of inclusions was counted using ImageJ software. For in situ observation of the γ–α transformation, high temperature laser scanning confocal microscopy22– 27 (LSCM) was used. The samples were heated up to 1400°C at a rate of 10°C s−1 and then cooled down to ambient temperature at a rate of 10°C s−1. For examination of the inclusions by transmission electron microscopy (TEM), thin foil samples were prepared by the focused ion beam method. The samples were observed by TEM (JEOL JEM 2100F) at an operating voltage of 200 kV, and elemental analyses were implemented by energy dispersive X-ray spectrometry (EDS). Boron measurement was conducted by electron energy loss spectroscopy (EELS).
Results and discussion
Microstructures
Figure 1 shows optical micrographs of each of the samples. Acicular ferrite was formed in B1L (Al/O, 0·28) and B1X (Al/O, 0·79), whereas it was not formed in B1H (Al/O, 1·63) in which coarse ferrite plates were formed. Grain boundary ferrite was observed in B1L but scarcely observed in B1X. The volume fractions of acicular ferrite were 81·5, 97·1 and 0% respectively. Figure 2 shows the EBSD analyses. A high misorientation GB (>15°) is indicated by the black line in the inverse pole figure (IPF) and GB maps, and a low misorientation GB (5–15°) is indicated by the grey line only in the GB maps. This result indicates that acicular ferrite had a random orientation and that the grain boundaries were almost the same as the high misorientation grain boundaries in B1L and B1X. However, the structures transformed from the austenite grain boundaries, such as the GB ferrite in B1L and ferrite plates in B1H, were parallel orientations. The fineness of the grain size depends on the volume fraction of acicular ferrite. The average grain sizes calculated by orientation imaging microscopy software in the areas were 11·8, 4·15 and 31·3 μm respectively.
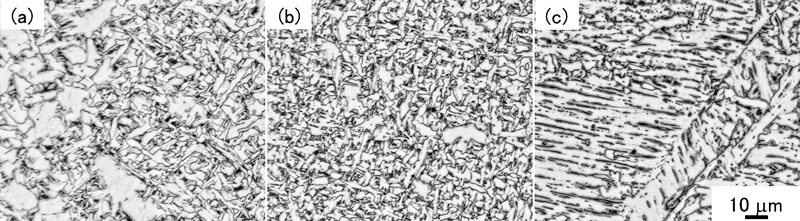
Optical micrographs after etching with 2% nital
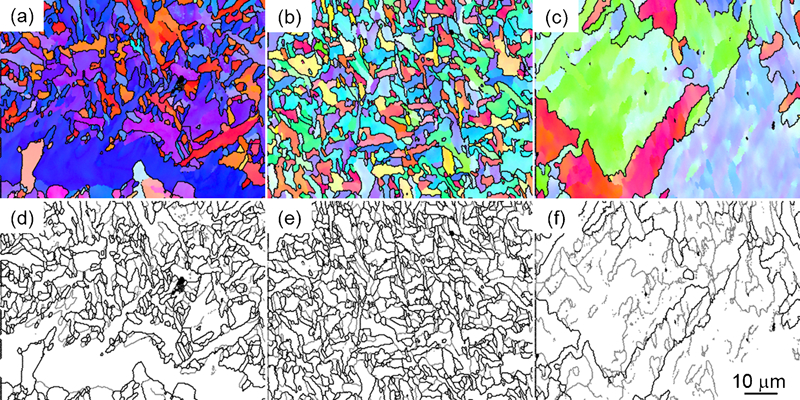
Inverse pole figure and GB maps of EBSD analyses
Inclusion compositions
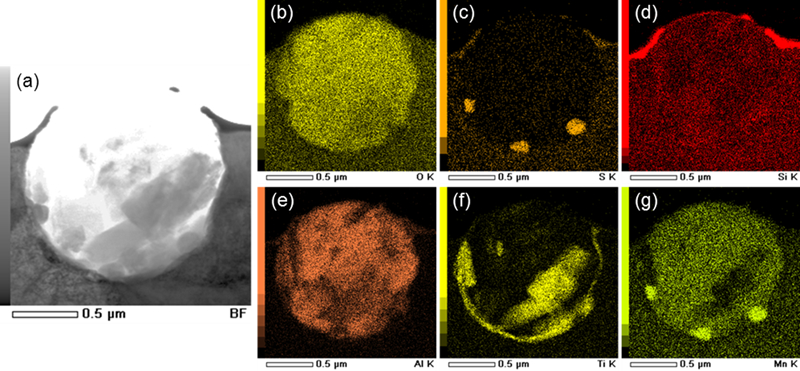
Figure 3 shows the results of the TEM analyses of B1L. The EDS results show that a Ti layer was formed around the surface of the inclusion. The areas of concentrated Ti and Al were determined as spinel structures by the selected area diffraction pattern (SADP). The areas with concentrations of Mn and S were MnS, and the remaining area showed a halo pattern indicating an amorphous phase. In B1L, the amorphous phase was major. Figure 4 shows the results of the TEM analyses of B1X. Layers concentrated Si is deposition, which prevents inclusions from being etched by the focused ion beam process. A Ti layer was also formed in this sample. The areas in which Ti and Al as well as Mn were enriched were spinel structures. In B1X, Al and Mn spinel structures were formed in addition to Ti and Al spinel structures. The remaining structure was an amorphous phase; however, it had a smaller volume than that in B1L due to the increased formation of spinel structures. The volume fractions of the amorphous phase measured in the figures were 55·1% in B1L and 9·4% in B1X. It is considered that an increase in Al content promotes the formation of spinel structures and decreases the volume fraction of the amorphous phase. Figure 5 shows the results of TEM analyses of B1H. Only Al and O were detected from the EDS result. It was γ-Al2O3 oxide from the SADP. A Ti layer, such as in B1L and B1X, was not observed around inclusions in B1H.
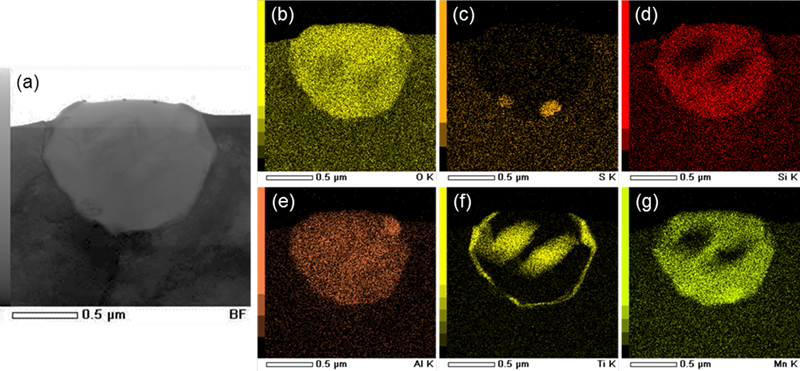
Bright field image (STEM) and EDS analyses of B1L
Bright field image (STEM) and EDS analyses of B1X
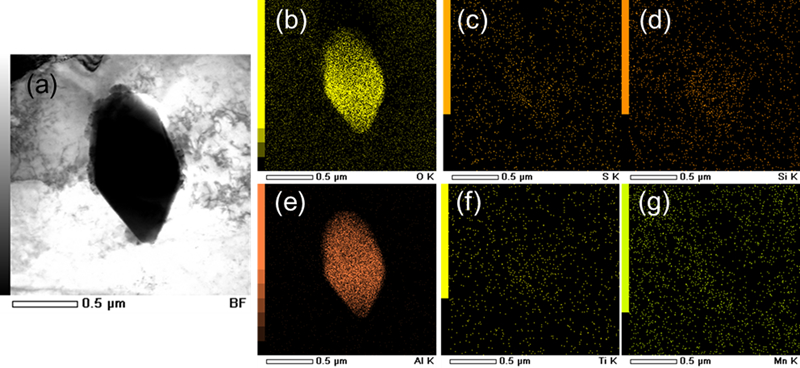
Bright field image (STEM) and EDS analyses of B1H
Acicular ferrite nucleation mechanism
Figure 6 shows the TEM results obtained from the interface of inclusion and ferrite in B1L. The SADPs of TiO and ferrite are shown in Fig. 6b. The incident direction of ferrite was <100>, and that of TiO was <110>. This indicates that the ferrite had a Baker–Nutting orientation relationship with the TiO layer on the inclusion interface. Figure 6c shows the dark field image of TiO formed by the spot indicated by an arrow. The misfit value between them is 3·0%,15, 21 and so, acicular ferrite nucleation from the inclusion can be encouraged from this low misfit value, as reported by Yamada et al. 21
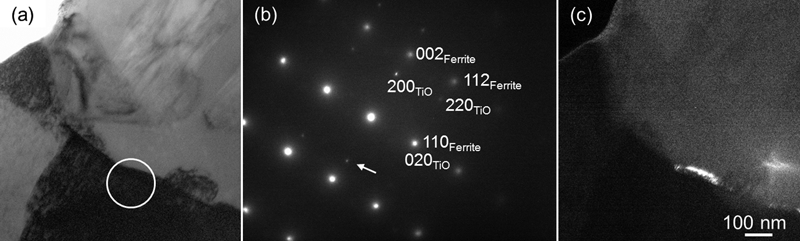
Analysis (TEM) of relationship between TiO and adjacent ferrite
Inclusions density
Figure 7 shows inclusion densities organised by each diameter of inclusion. Although the proportion of large inclusions in B1X was slightly greater than that in B1L, there is little difference between the two. In B1H, small inclusions were notably fewer, and there were more large inclusions. Inclusion densities measured in the areas were 10 671, 9745 and 3796 number mm−2 respectively. The average sizes of the inclusions were 0·47, 0·54 and 0·96 μm respectively.
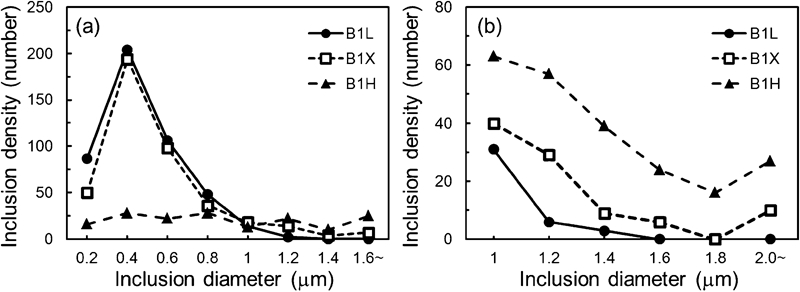
Inclusion densities
It is known that inclusions that have good wettability for liquid steel, such as slag system inclusions, are difficult to agglomerate compared with those with bad wettability, such as Al2O3 oxides.28, 29 TiO layers were formed around the surface of inclusions in B1L and B1X, and it is considered that they have better wettability than slag system oxides. Therefore, it is considered that the inclusions in B1L and B1X were not agglomerated but dispersed finely, whereas those in B1H were agglomerated and coarsened.
Transformation behaviour
TiO layers were formed both in B1L and B1X, and so, the nucleation potentials of acicular ferrite were nearly identical; however, GB ferrite was formed in B1L but scarcely observed in B1X. To clarify the difference between the two, in situ observations were carried out using LSCM. Figures 8 and 9 show the results of in situ observations of γ–α transformations in B1L and B1X respectively. In B1L, the transformation starts from grain boundaries at 657°C (Fig. 8b and c). Moreover, the intragranular transformation starts from 623°C (Fig. 8d), and microstructure was continuously developed (Fig. 8e and f). In B1X, the GB transformation did not occur even if the temperature is <640°C in the observed area as shown in Fig. 9b since the amount of GB ferrite is much smaller than that of B1L. The intragranular transformation starts at 627°C (Fig. 9c) and continuously developed (Fig. 9d and e). The phase transformation had finished almost exclusively by the intragranular transformation (Fig. 9f).
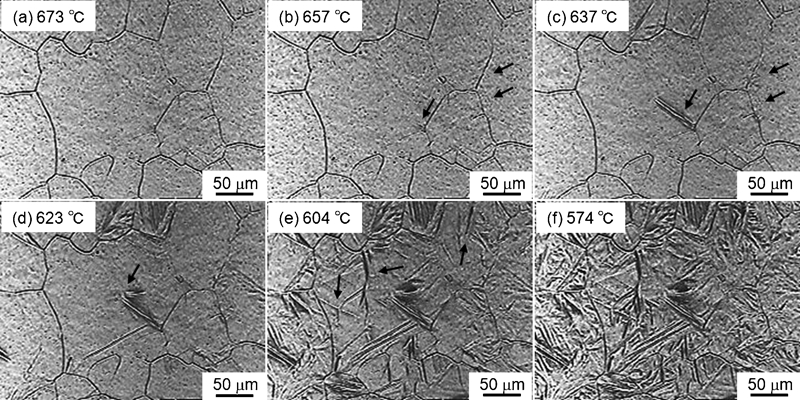
In situ observation of morphological development of γ–α transformation in B1L
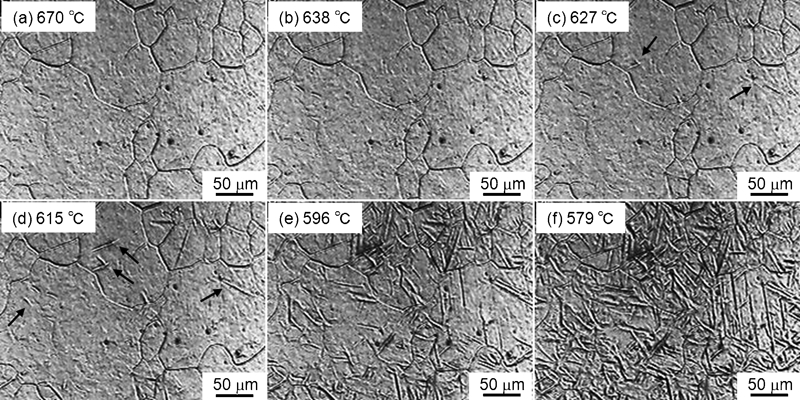
In situ observation of morphological development of γ–α transformation in B1X
Boron segregation behaviour
The difference between B1L and B1X was only the Al content; the content of the other elements remained constant. In addition, TiO layers, which become the sites of acicular ferrite nucleation, were formed in both B1L and B1X; thus, it is considered that the ferrite nucleation potentials of inclusions are nearly identical. However, it was observed that the transformation behaviours were varied between the two samples using LSCM.
There is a possibility that the effects of the hardenability of boron are different. Boron is known to be an element that significantly increases hardenability through the addition of just a few parts per million.12– 14 However, it is difficult to detect boron using EDS because it is a light element, and so, detection is conducted using EELS. Figure 10 shows the results of EELS for an inclusion in B1L. Boron was detected in the amorphous phase, but not in the TiO or spinel oxides. Boron is susceptive to oxidation and so probably exists as B2O3, which is mostly observed as an amorphous phase.30
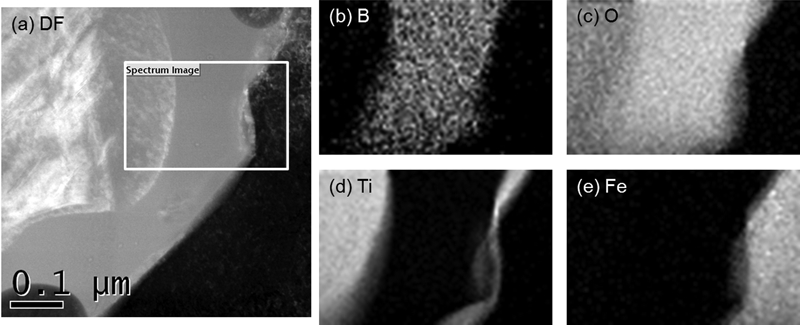
Analysis (EELS) of inclusion of B1L
In the case of inclusions predominantly composed of an amorphous phase such as B1L, a large amount of boron is absorbed into the inclusions. As a result, the amount of boron segregation to the austenite GB decreases, and so, GB ferrite is formed. With increasing Al content from 0·005 to 0·015 mass-%, the volume fraction of the amorphous phase reduced from 55·1 to 9·4% by the increasing spinel structures. As a result, the total amount of the amorphous phase, which absorbs boron, significantly reduced because inclusion densities were not much different between B1L and B1X. When the absorption of boron into inclusions is suppressed, intragranular transformation is enhanced by suppressing GB transformation. Thus, the relationship between the volume fraction of acicular ferrite and the Al/O mass ratio can be described as the difference in boron segregation behaviour to the austenite GB.
Conclusions
Low carbon steel weld metals with three levels of Al content (Al/O mass ratios of 0·28, 0·79 and 1·63) samples were used in this study and were systematically analysed in terms of microstructure, inclusion composition and boron segregation behaviour. The results can be summarised as follows:
Acicular ferrite was formed in the samples with low Al and medium Al, whereas it was not formed in the high Al content sample. In the low Al and medium Al content samples, a TiO layer was formed around the surface of the inclusions. The ferrite adjacent to the inclusion had a Baker–Nutting orientation relationship with the TiO layer. This layer encouraged the nucleation of acicular ferrite due to the low misfit value with ferrite.
An increase in Al content promoted the formation of a spinel structure and decreased the volume fraction of the amorphous phase in inclusions.
Grain boundary ferrite was formed in the low Al content sample but was scarcely observed in the medium Al content sample. Through the in situ observations, in the low Al content sample, GB transformations were observed before intragranular transformations, whereas in the medium Al content sample, intragranular transformations were dominant.
It was confirmed by EELS analysis that boron existed in the amorphous phase of inclusions. It can be assumed that the formation of an amorphous phase enhances GB transformation as a result of boron absorption in the amorphous phase. It can be assumed that boron segregation to the austenite GB promotes intragranular ferrite transformation with the formation of spinel structures.
Footnotes
This paper is part of a special issue from Eco-Mates 2011