
Abstract
Loss of nitrogen is a concern when welding nitrogen strengthened stainless steel alloys. Building on the current understanding of the underlying mechanisms, a three-dimensional simulation of conduction mode laser weld pool development using the volume of fluid technique was developed. Weld pools formed by a moving Gaussian heat input for two different laser power densities were simulated and the transport and surface desorption of nitrogen was tracked using nitrogen macroparticles. The penetration depth and width of the weld pool predicted by the simulation was comparable to the data derived from macrographs of welds made on nitronic 40 alloy. Additionally, the 25–32% predicted decrease in nitrogen composition of the weld fusion zone by the new rate law is comparable to the literature.
Keywords
List of symbols
Specific heat of solid
Specific heat of liquid
Activity coefficient of oxygen
Activity coefficient of sulphur
Fraction of simulation cell occupied by fluid
Force due to gravity
Enthalpy
Convection coefficient
Enthalpy of solid–liquid phase change
Thermal conductivity
Steel nitrogen content
Pressure
Atmospheric pressure
Power delivered by laser

Partial pressure of diatomic nitrogen above weld
Recoil pressure
Heat lost due to evaporation
Universal gas constant
Principal radii of local curvature of free surface
Temperature
Ambient temperature
Liquidus temperature
Melting temperature
Solidus temperature
Boiling temperature at atmospheric pressure
Effective radius of laser
Volume of steady-state weld pool

Velocity vector
Cartesian coordinate index
Volume thermal expansion coefficient
Emissivity
Laser absorptivity
Laser wavelength
Viscosity
Electrical resistivity
Density
Density of liquid metal
Density of macroparticle
Density of solid metal
Stefan-Boltzmann Constant
Introduction
The controlled level of nitrogen in stainless steels is known to promote the retention of austenite and enhance corrosion resistance, tensile strength, and toughness. Since the advent of these alloys, the interest in controlling the amount of nitrogen during welding has increased. 1 Although corrosion sensitization and solidification cracking may occur depending on the solidification mode and impurity levels, both are generally reduced because of the presence of nitrogen.2, 3, 4 For these reasons, loss of nitrogen is a serious concern when welding nitrogen strengthened stainless steel alloys. 5
Early research on hydrogen in gas tungsten arc welding (GTAW) of steels found levels to be higher than that predicted by Sievert's Law; an effect attributed to enhanced absorption of monoatomic species from the arc plasma. 6 Subsequent work explained the temperature difference between the plasma and the weld pool surface and oxygen containing species in the plasma enhanced nitrogen absorption. 7 Several researchers have formulated models and conducted experiments that confirmed the loss of nitrogen from weld metal when using non-nitrogen shielding atmospheres.1, 6, 8, 9, 10 Effects of weld pool convective and turbulent flow on transport of the nitrogen in the weld pool and on absorption and desorption rates have been studied.10, 11 Also, mechanisms of arc and conduction-mode laser weld pool development have been extensively studied in stainless steels. 12
The presence of surface active elements in the weld metal has a pronounced effect on absorption and desorption of nitrogen. Katz and King 13 took a kinetic approach to desorption with a rate law accounting for the limited sites at the surface of the weld pool. Du Toit and Pistorius 14 further developed rate laws for nitrogen entering and leaving the weld pool. At this time, no model integrates desorption of the nitrogen at the laser weld pool surface and nitrogen transport in the weld pool melt flow. In this study, the volume of fluid (VOF) method was adopted to predict weld pool formation and to track the free surface shape. The effects of surface temperature on evaporation recoil pressure and cooling and surface tension gradients on Marangoni convection were included. Nitrogen macroparticles were used to visualise the movement of nitrogen within the weld pool and the exchange of nitrogen at the surface of the weld pool. This study provides a better understanding of the desorption of nitrogen from the melt pool surface for autogenous conduction-mode laser welds made in an argon-shielded environment and of the predicting of final weld nitrogen content.
Physical model
The simulation was based on the transport of mass, energy, and momentum that occur in and around the weld pool. Discussion of this model is divided into sections of fluid flow, heat transfer and boundary conditions, and nitrogen macroparticle dynamics.
Fluid flow in weld pool
A fluid flow simulation that implemented the volume of fluid (VOF) technique was used to predict the shape and motion of the weld pool and weld pool surface. Conservation of F is expressed as
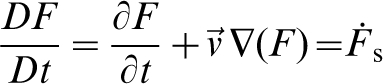
Any fractional value of F corresponded to a simulation cell containing a free fluid surface. For this equation and subsequent equations, general variable definitions are given in the list of symbols. The void above the free surface had uniform temperature and pressure and assumed that the inertia of gas flowing in the region was negligible. 15 For laminar flow of a fluid, conservation of momentum with viscous stress was applied with the Boussinesq approximation.
The laser beam heat input was applied through the surface heat flux boundary condition at the free surface. The phase change from solid to liquid was modelled by the given enthalpy temperature relationship

A similar mathematical model was used for liquid to vapour phase change with the assumption of a single-temperature phase change at the boiling temperature.
Heat transfer and boundary conditions for weld pool
The laser beam irradiance was modelled as a Gaussian distribution of energy given by the following equation
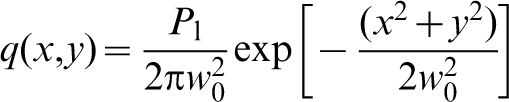
The beam focus spot size was calculated according to the equation in Quitino et al. 16 with an M2 value of 11·7. 17
The free surface boundary condition also considered cooling due to convection, radiation, and evaporation. The full heat flux boundary condition at the free surface is applied according to the equation

The absorptivity of the laser by the solid η was calculated using the equation in Xie et al. 18 and ranged from approximately 31% at 298 K to 43% at the maximum temperature.
The evaporation cooling from the weld pool surface had strong thermal and mechanical effects. 19 Thermodynamic, kinetic, and hydrodynamic analyses of the evaporation process were used to calculate temperature and pressure on the laser weld pool surface. The pressure boundary included the surface tension force, which was a factor in shear stress balance at the free surface. The surface tension was a significant contributor when modelling Marangoni effect based flow. The surface tension function used in the present simulation was based on the findings of Zacharia et al. 20 and McNallan and Debroy 21 and was modified for stability at high temperatures.
The simulation domain had dimensions of 0·7, 0·4 and 0·20 cm in the x, y and z-directions respectively. The size of the simulation space was sufficiently large to include the complete weld pool and avoid thermal effects from reaching the boundaries. Additionally, continuous boundary conditions were defined to make the simulation space semi-infinite and avoid all boundary effects on temperature related properties and fluid flow. The z-direction had 0·146 cm of material and 0·054 cm of void region. The 3D Cartesian system had 489 050 active cells with edge length 50 μm. Cell size optimisation was performed to ensure mesh size independence while conserving computer resources.
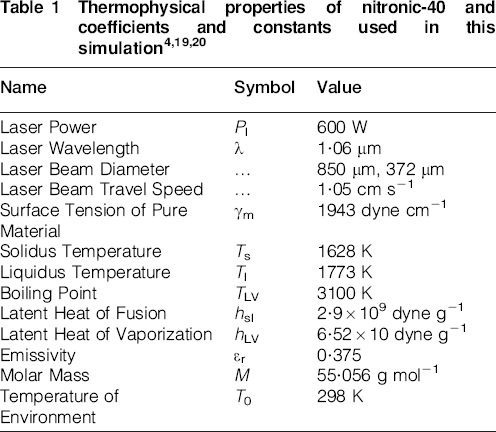
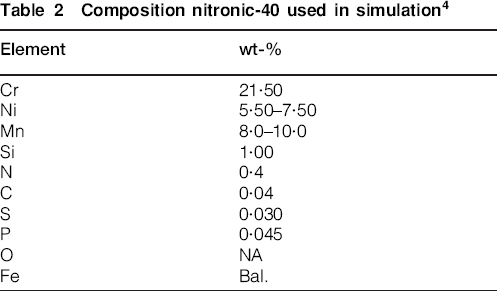
The density, viscosity and specific heat, and thermal conductivity as functions of temperature were based on data from Zacharia et al. 22 and Ho and Chu 23 for 304 stainless steel and were modified to reflect the properties of Nitronic 40 (Table 1). The chemical makeup of the welded material used in the simulation is presented in Table 2.
Composition nitronic-40 used in simulation 4
Nitrogen macroparticle model
The transport of nitrogen in the weld pool was represented by nitrogen macroparticles. The macroparticles were initiated along the x, y, and z direction with an average spacing of 10 μm resulting in 125 macroparticles per cell. Initially macroparticles covered the complete simulation block in the x-direction but were limited to the middle 0·3 cm in the y-direction and the upper 0·07 cm of the material in the z-direction which ensured that macroparticles encompassed a region larger than the steady state weld pool while conserving computational resources. Macroparticles were defined as point masses but were assigned a volume and density to calculate the body forces including drag, buoyancy, and gravitational force. The macroparticles were designed not to interfere with the natural flow of the weld pool and move in both directions across the free surface. Conversely, the movement of the macroparticles within the weld pool was dictated by the natural fluid flow and velocity of the weld pool. A sufficiently small fixed diameter and density were assigned to each macroparticle to minimise the effect of body forces on the particle and ensure laminar flow around the particles.
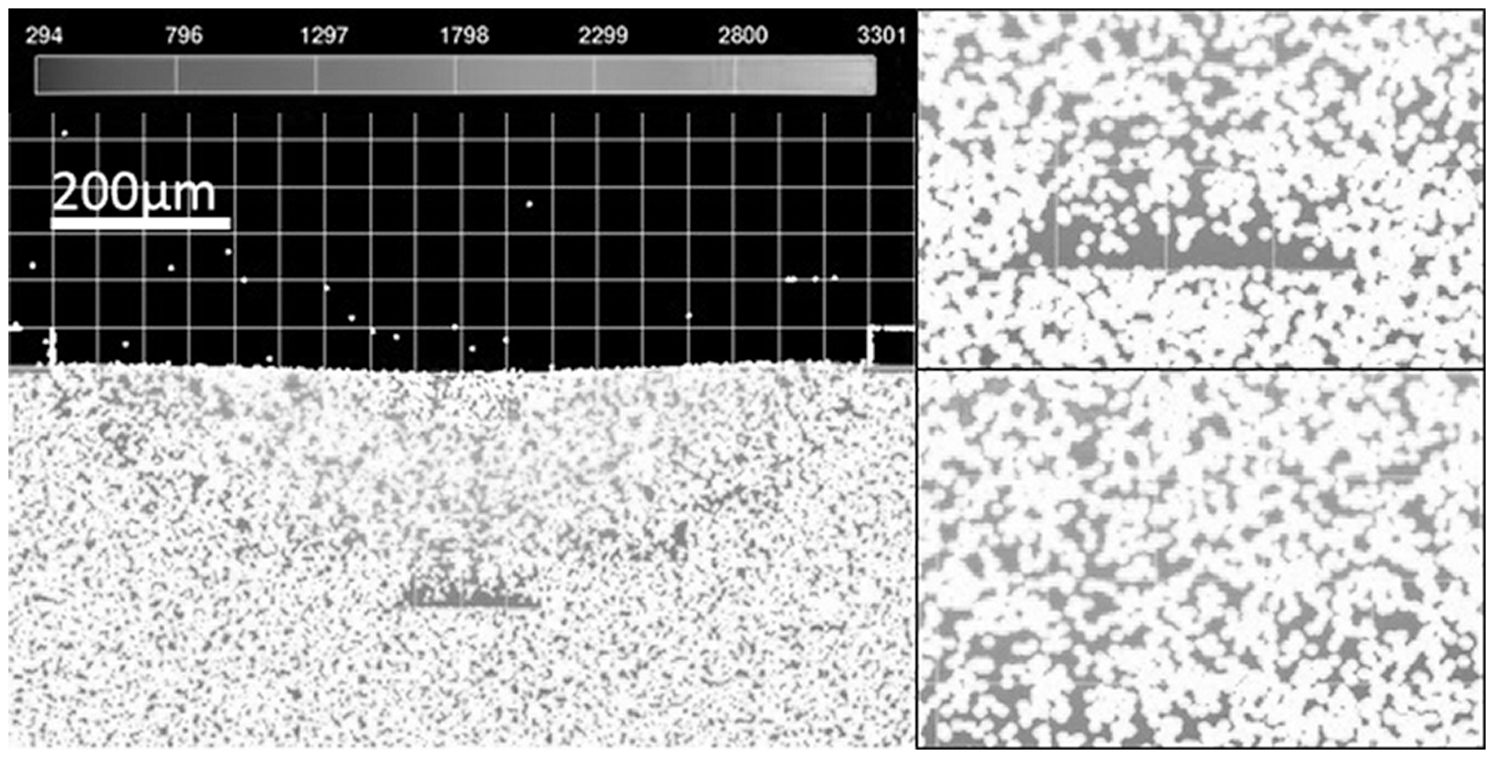
At the free surface of the weld pool, the loss rate was governed by a second order rate law. The rate law is expressed as
17
Results and discussion
The simulation used commercial code from Flow3D by FlowScience. Laser and pressure inputs were applied using custom subroutines. The simulation and experiments were performed using a travelling heat input similar to an IPG fibre laser of diameter 100 μm and collimator and focus lens with focal lengths of 120 and 200 μm respectively with a 167 μm sharp focus spot size and peak power of 600 W. The welding velocity of 1·05 cm s−1 and shielding gas was pure argon. Two specific test cases were used to test the fluid flow model of weld pool development.
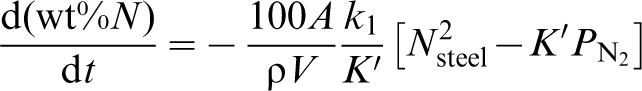
With the focus spot size for the laser beam set at 850 μm, the power density was sufficiently low for the simulation of a conduction mode laser weld. The maximum temperature of the weld pool reached 2300 K after 35 ms which corresponded with the peak of the surface tension curve causing inward directed Marangoni flow and a deeper penetration weld. A temperature of 2100 K was achieved in the first 5 ms after which the competing effects of heating and cooling slowed the increase in temperature. The weld pool reached a maximum velocity of 0·55 m s−1 and a depth of 400 μm as shown in Fig. 1. The hump at the centre of the weld pool was due to volume expansion during heating of the weld pool. 24 Penetration depth and width of the simulated weld were comparable with experimental results and differed by less than 10%.
Transverse cross-section of simulation overlaid on experimental micrograph for laser spot size diameter 850 μm: speed of flow is in shown in cm s−1
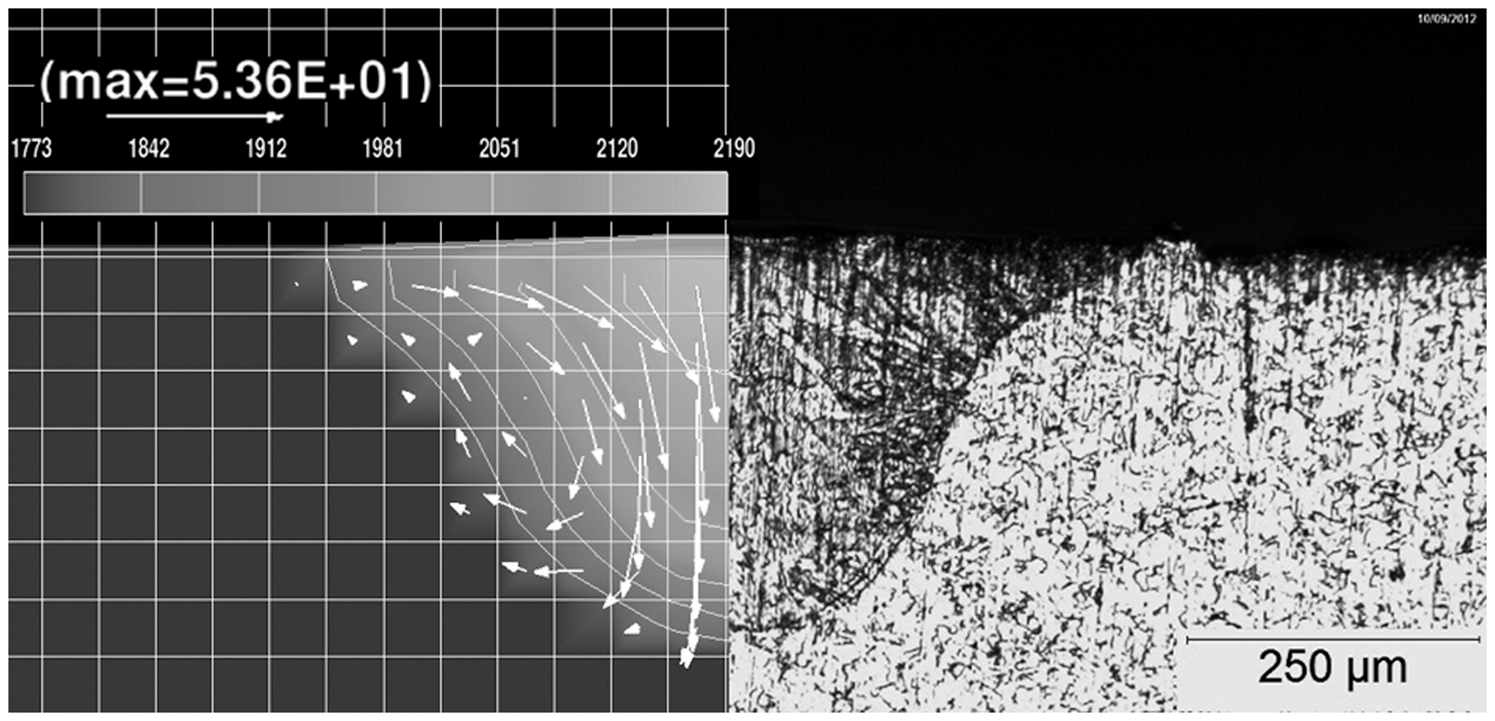
The second case examined weld pools formed in the initial stages of keyhole formation using a focus spot size of 372 μm. In this case, the maximum temperature reached 3400 K. The temperatures observed at the centre of the laser beam focus spot were sufficiently high for significant evaporation cooling. In contrast, for the higher power density case the large temperature gradient between the centre and edges of the transient weld pool drove the outward-directed Marangoni flow at the centre of the weld pool as depicted in Fig. 2.

Transverse cross-section of weld pool showing outward-directed Marangoni flow in weld pool formed in high laser power density simulation: speed of flow is in shown in cm s−1
This pattern of flow also reflected the low concentrations of surface active elements. At the edges of the weld pool the Marangoni flow is directed inward since the surface tension gradient at the edges is positive at lower temperatures. The presence of surface active elements shifts the peak of the surface tension curve towards higher temperatures moving the inward Marangoni flow region closer to the centre of the weld pool. The temperature gradient contributed to the buoyancy force present in the weld pool but it was found to have negligible influence on the flow compared to the effects of surface tension and recoil pressure. 18 The weld pool flow reached a maximum velocity of 0·9 m s−1. The flowrate was highest near the laser heat input and decreased at the edges. As shown in Fig. 3, the transverse cross-section macrographs and simulation results were comparable with the simulation producing a weld pool that was wider and shallower but still deviated by less than 10%. The observed left-right oscillations are consistent with research on Marangoni driven flow for materials with low sulphur content. 24
Transverse cross-section of simulation overlaid on experimental micrograph for laser spot size diameter 372 μm: speed of flow is in shown in cm s−1
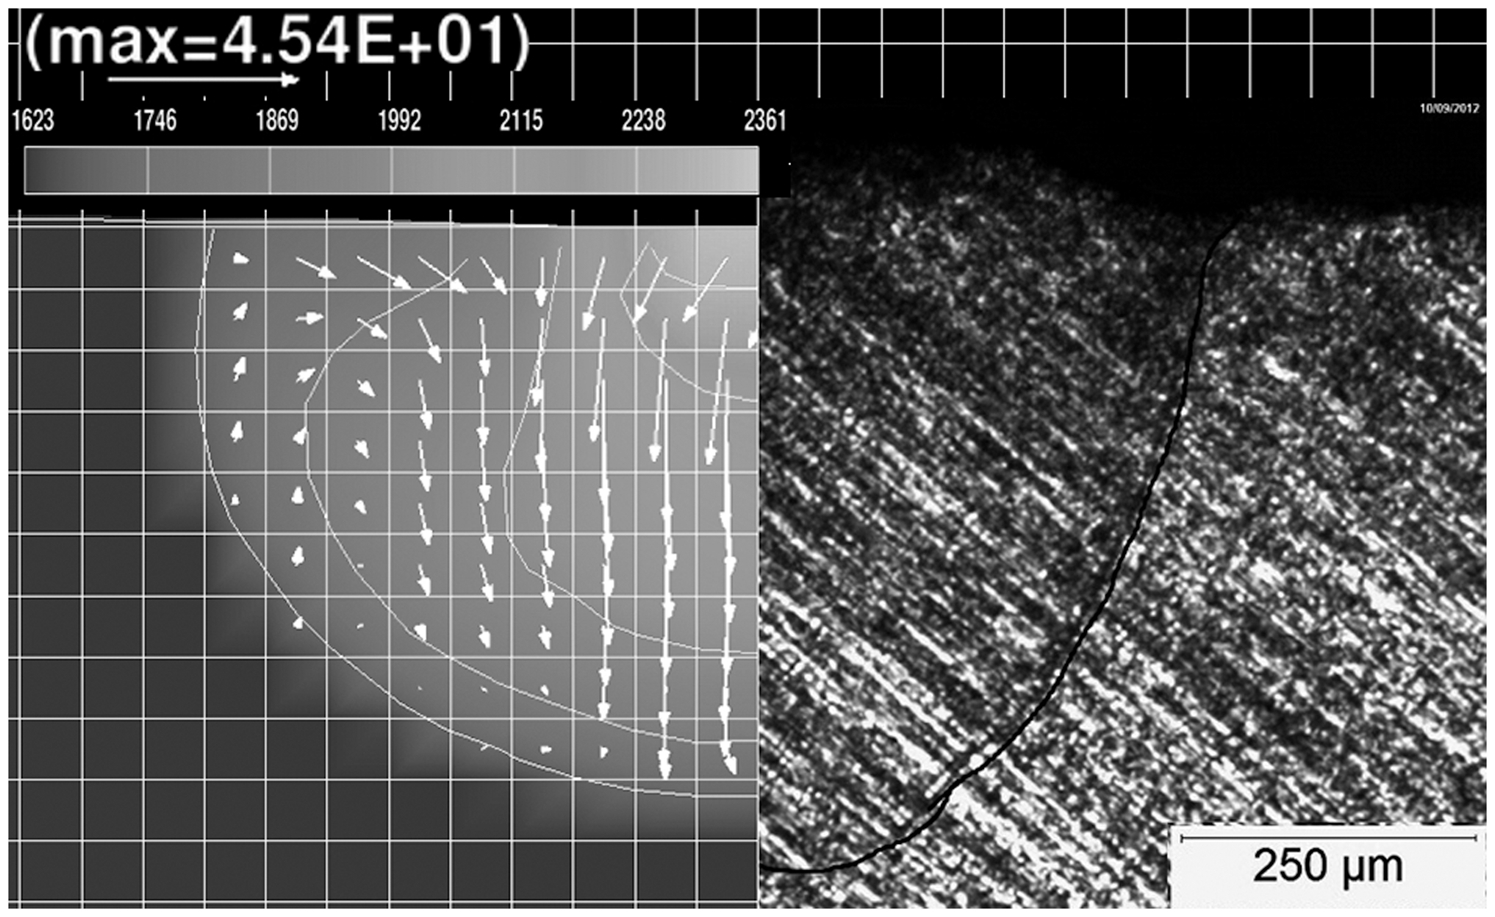
Du Toit and Pistorious 17 showed nitrogen concentration in the weld pool is affected by four sources. In the bulk of the weld pool, the nitrogen is transported by convection and diffusion. It is well established that diffusion has a relatively small effect compared to the convection in the weld pool. 10 The distribution in the active weld pool was non-homogenous as shown in the upper right portion of Fig. 4.
Inhomogeneous distribution of particles present in different locations in weld pool formed under higher laser power density
As the trailing edge of the weld pool solidified, the nitrogen was trapped in the solid. Visible loss was apparent in the solidified regions. Surprisingly, although the concentration of nitrogen in the bulk of the weld pool was constantly changing, the distribution was homogenous in the solidified regions possibly due to diffusion, as shown in the lower right portion of Fig. 4. 10
Previous research determined that the weld pool surface concentration may be limited either by the transport of nitrogen to the surface of the weld pool or by the number of available active surface sites. 13 Given the assumption that the weld pool is sufficiently mixed and the convection and concentration of nitrogen are sufficient for the transport of nitrogen to quickly replenish the surface active sites, the limiting factor for the desorption of nitrogen is the number of surface active sites, which is directly related to the concentration of surface active elements. The rate law in this simulation utilized a site blockage model which limited the fraction of surface sites available causing the rate to be based on the sulphur and oxygen content in the weld. The simulation calculated the amount of active sulphur as a function of the chromium content and the surface temperature of the weld pool. 10
A modification was made to the rate law of Du Toit and Pistorius for arc welding. Research by Katz and King
13
indicates that for weld pool flows where the rate limiting step for the desorption of nitrogen is the number of surface active sites, the rate constant is proportional to the fraction of active sites squared. This can be described by the expression
The relationship between the number of active sites
 and the concentration of surface active elements and is described by the following expression
13
and the concentration of surface active elements and is described by the following expression
13
Therefore, assuming the oxygen content in the weld is negligible in a shielded weld of chromium-rich stainless steel, the apparent rate constant, k1 should be modified to the following expression13, 14
This modification results in a lower desorption rate which improves the accuracy.
The desorption rate of nitrogen is also affected by the partial pressure of nitrogen above the weld pool. Even in argon shielded environments, the shielding is not complete and contaminants from the atmosphere are still present. Therefore, the partial pressure of nitrogen in a weld reasonably shielded by pure argon shielding gas was assumed to contain approximately 250 ppm.
A novel addition in this simulation was the macroparticle model, which provides a way to visualise the movement and desorption of nitrogen in a welding environment. Other models give prediction of gas movement and have been used to model the effect of shielding gases on gases exchanged at the weld pool surface during welding. However, these models are usually highly computationally intensive or partially empirical. 25 Using macroparticles to represent a material of interest allows for the tracking and visualisation of that material during the welding process and significantly decreases the computation time. Each macroparticle is representative of many nitrogen atoms within the base material while still preserving the density of nitrogen present in high nitrogen stainless steel. The arrangement represents the density of nitrogen normally found in Nitronic 40. The desorption rate of nitrogen was calculated for each simulation cell with its top edge adjacent to the weld pool surface which was then translated into the number of macroparticles lost per time step in the simulation. The macroparticles capable of escaping from the weld pool were chosen beginning with the particles closest to the surface of the weld pool. As the chosen macroparticles continued in their original trajectory, they escaped through the weld pool surface. The upward velocity (positive z-direction) of the macroparticles remaining in the cell was set to zero which returned those macroparticles to the bulk flow of the weld pool. Only nitrogen macroparticles in cells adjacent to the free surface were considered and controlled because the maximum distance any given macroparticle could travel within any given time step is one order of magnitude less than dimension of a simulation cell.
In lower power laser welds with this high travel speed, the loss of nitrogen is very low, consistent with experimental results. However, at powers suitable for the beginnings of keyhole formation, the elevated temperatures caused the loss rate to increase as seen in Fig. 5. The loss rate of nitrogen begins slowly as the weld pool forms and increases rapidly to the steady state loss rate after about 25 ms. This time corresponds to the time a steady state weld pool takes to form. Near the top of the weld, 32% is lost on average per cell whereas in the deeper part of the weld only 25% is lost per simulation cell in the weld pool. The overall loss rate is comparable to literature and experimental values.8, 26
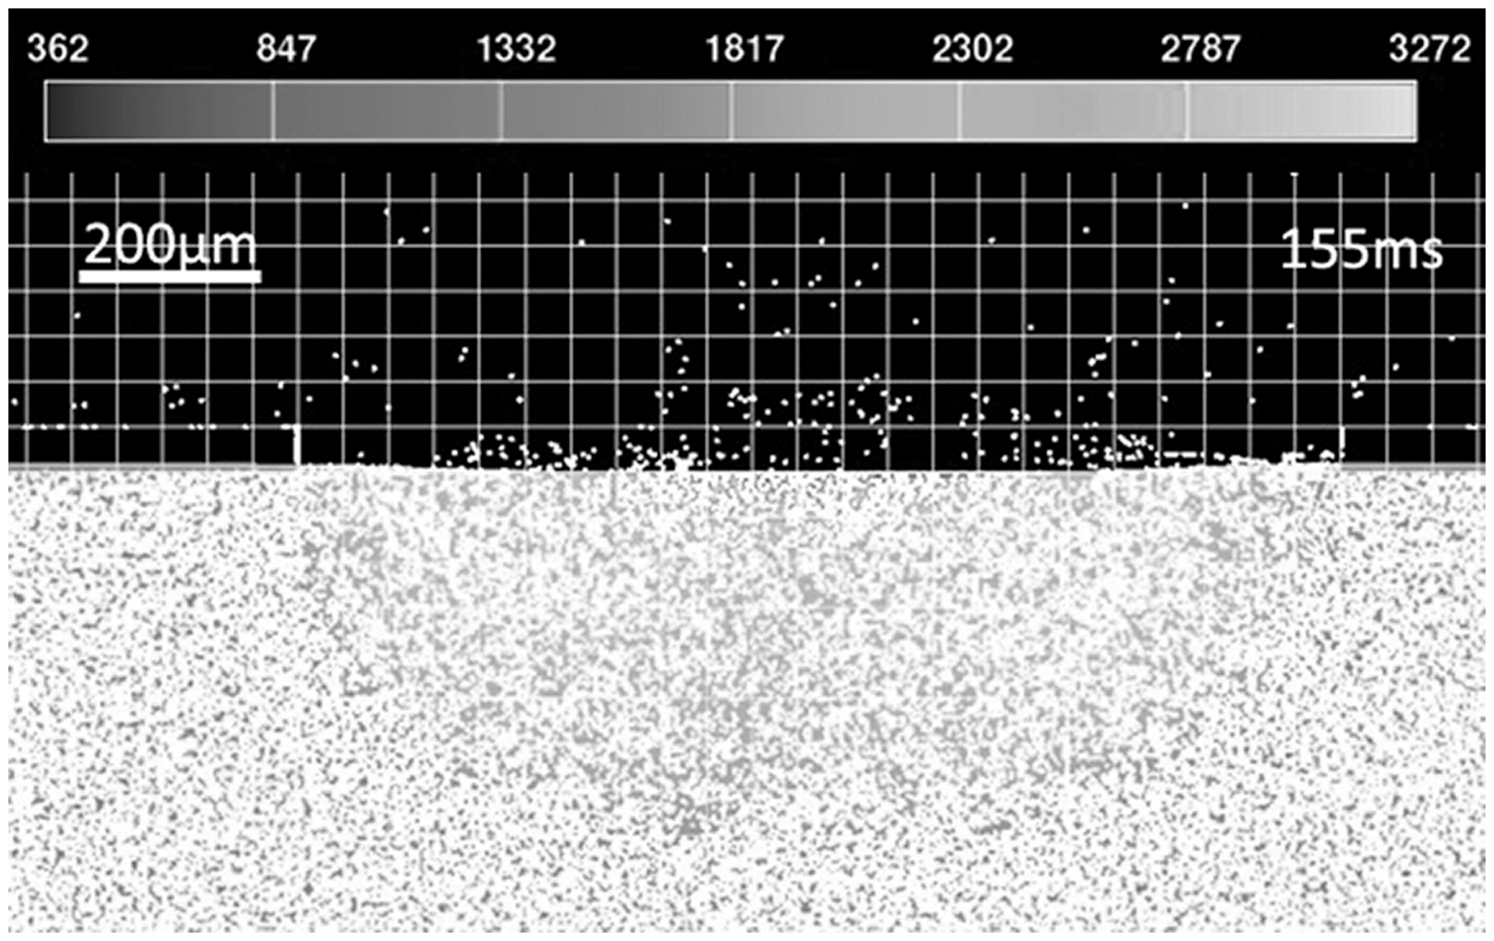
Transverse cross-section showing nitrogen loss from weld pool for high laser power density case
Summary and conclusions
The current simulation examined the evolution of nitrogen and flow patterns present in a conduction mode laser weld pool and their effect on nitrogen desorption from a high nitrogen stainless steel in an argon shielded welding environment. The weld pool was well mixed and macroparticles trapped in the solidifying metal at the trailing edge of the weld pool showed a homogenous distribution despite non-homogenous regions in the active weld pool. At the weld pool surface, the results of the new rate law indicated that the modified surface site model accurately predicted the loss rate of nitrogen through the weld pool surface. The loss rate predicted by the simulation showed a 25–32% loss of nitrogen which is comparable to values shown in the literature.
Footnotes
Acknowledgements
The authors would like to acknowledge the financial support and research opportunity from Los Alamos National Laboratories in conjunction with the National Science Foundation Industry/University Collaborative Research Center: Center for Integrative Materials Joining for Energy Applications (I/UCRC CIMJSEA). Funding was in part from National Science Foundation award no. 1034729. The authors would also like to give special thanks to Stephen Tate and Dr Stephen Liu at Colorado School of Mines for performing welds on Nitronic 40 and nitrogen content analysis as well as all their help with this work. The authors thank Dr Avraham Benatar for his help and advice on this manuscript. Additionally, thanks to Dr Sudarsanam S. Babu for the research opportunity as part of his I/UCRC center.