
Abstract
The mechanical properties of dissimilar weld joints between SAF 2205 and AISI 316L were investigated. Welding was accomplished by different types of welding wires: AWS ER 347, AWS ER 316L and AWS ER 309L. Microhardness and tensile tests were accomplished to evaluate hardness of the weld metal toward both sides of the base metals and to determine the strength of the weld joints. The weld metals of all samples exhibited higher hardness values than AISI 316L and lower values than SAF 2205 base metal. Welding wire 309L exhibited higher mechanical properties, while welding wire 347 showed weak mechanical properties. According to results, welding wire 309L was suitable for welding duplex stainless steel to austenitic stainless steel by gas tungsten arc welding process.
Introduction
Stainless steels are an important class of engineering materials that have been widely used in a variety of industries and environments, especially due to good mechanical properties and corrosion resistance. Welding is an important fabrication technique for stainless steels, and generally, the stainless steels are considered as weldable materials.1-4 Austenitic stainless steels represent the largest of the general groups of stainless steels due to the excellent properties such as corrosion resistance, ductility, toughness and weldability. Duplex stainless steels are compositionally formulated and thermomechanically processed to provide a two-phase microstructure exhibiting nearly equal proportions of ferrite and austenite.5, 6 The unique properties of duplex stainless steels strongly depended on their “50/50” ferrite–austenite balance. Duplex stainless steels are becoming increasingly popular in structural applications, requiring higher strength and corrosion resistance than austenitic stainless steels. Duplex steels have been employed in the onshore and offshore oil and gas, cargo holds in chemical tankers, petrochemical industries, and gas transmission lines. Therefore, a strong trend to use duplex steels as a structural material in the industry have been steadily increased.7-10
Arc welding of duplex stainless steels can produce alterations in microstructures of weldment. For welding duplex stainless steels, it is essential to use filler metals that can create 5–10% of delta ferrite in the welded microstructure, which is required to prevent solidification cracking. Although there is no specifically defined limit to ferrite content, the ferrite content at the weld metal should be in the range of 25–75% to give optimum mechanical properties and corrosion resistance.11, 12
Dissimilar metal welding is frequently used to join stainless steels together or to other materials in different situations such as gas pipeline and petrochemical industry. The reasons for these combinations may be economic property, transition or cladding. Stainless steels may be involved in joints with different degrees of dissimilarity. It is especially important to make an appropriate selection of filler metal to produce a sound joint with satisfactory service performance. Generally, in order to use benefits of both alloys, filler metals and welding process should be chosen precisely.13, 14 There is no slag in gas tungsten arc welding (GTAW), accompanied by a good control of welding parameters, making it practical for welding dissimilar weld joints.
In this study, two different stainless steels, SAF 2205 (duplex stainless steel) and AISI 316L (austenitic stainless steel), were welded together by the GTAW process, using different types of filler metals: AWS ER 347, AWS ER 316L and AWS ER 309L. These stainless steels have been individually welded under constant welding parameters in order to identify the appropriate filler material. The changes in the microstructures of weldments were studied. Hardness and round all weld metal and rectangular tensile of these weld joints were investigated for different types of filler metals.
Experimental
Materials
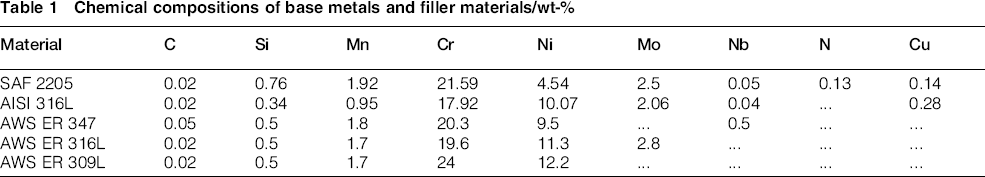
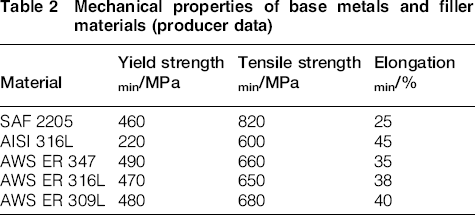
Plates of SAF 2205 (UNS 31803) duplex stainless steel and AISI 316L (1.4432) austenitic stainless steel with 8 mm thickness were used as base materials. AWS ER 347, AWS ER 316L and AWS ER 309L in the form of welding wires were used as filler materials. The diameter of filler wires was 2.4 mm, which is slightly overalloyed principally with respect to nickel. The chemical compositions and mechanical properties of the base and undiluted filler materials are presented in Tables 1 and 2 respectively.
Chemical compositions of base metals and filler materials/wt-%
Mechanical properties of base metals and filler materials (producer data)
Welding and non-destructive procedures
The dissimilar welded joints were made between SAF 2205 steel and AISI 316L steel using each of the welding wires. As illustrated in Fig. 1, a V-groove edge preparation was exercised. The base metals and welding wires were cleaned with acetone before welding. Base plates were fixed as the design of the fixture bars, allowing full access to the weld joint without any interference with the shielding gas flow. A welding power source (GTA welding machine) model (PARS-EL 6335 licensed Merkle Germany) was employed to execute GTA welding. A clamp meter (AC/DC) model (Kyoritsu Kew Snap 2003A) was used to quantify current and voltage accurately during the welding process. Non-consumable tungsten electrode AWS EWTh-2 with 2.4 mm diameter was utilised in a gas cooled torch to implement GTA welding using direct current electrode negative. A 100°C temperature sensitive crayon was exploited within 25 mm of the weld on the base metal to estimate interpass temperature. Weld joints were filled with two filler passes in addition to root and cap passes, as each layer was deposited in a single pass as well as all passes were scrubbed with an SS brush. Pure argon gas was used for gas shielding and back purging to impede oxidation of the welds. Welding procedure was accomplished according to AWS D1.1 and AWS C5.5/C5.5M standard, and the details of the welding parameters are listed in Table 3.
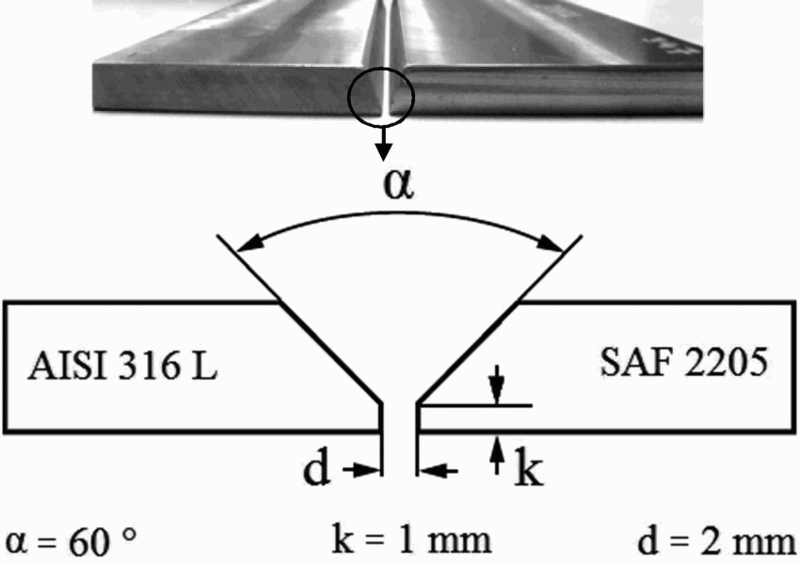
Edge preparation for dissimilar weld joints (V-groove joint design)
Welding parameters for GTAW process of dissimilar weld of SAF 2205 to AISI 316L
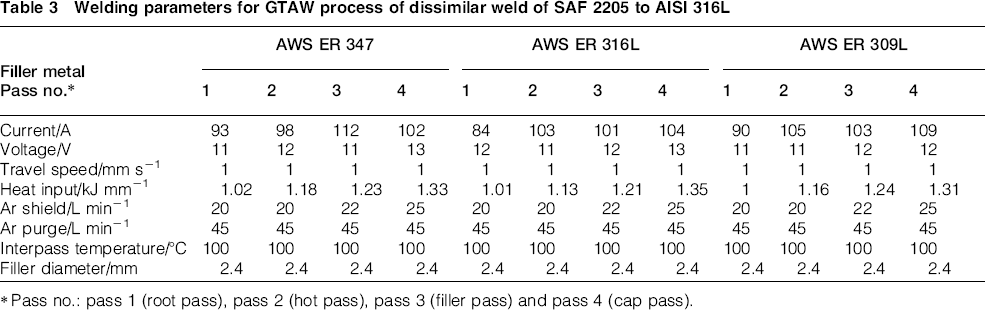
Pass no.: pass 1 (root pass), pass 2 (hot pass), pass 3 (filler pass) and pass 4 (cap pass).
Non-destructive tests were performed to verify that soundness of produced welds complied with the requirements based on AWS D1.1 standard. Visual inspections (VT) were carried out before and after welding. Before the welding process, cleanness of materials, alignment, set-up and dimensions of weld joints were checked. During welding, items such as root penetration, interpass temperature, cleanness of weld beads and conformance with the applicable procedure (i.e. voltage, amperage, heat input and travel speed) were controlled. After welding, the appearance of final welds was inspected and appraised to detect typical surface discontinuities as porosity, incomplete fusion, incomplete joint penetration and cracks. To detect any weld surface discontinuities, especially cracks, liquid penetrant (PT) was executed on the weld joints. Three spray packs were employed for PT examination, which was supplied by ELY Co. Eventually, all weld joints were examined via radiography test, using single wall single image technique, to get an assurance that the welds include no internal discontinuities especially cracks and tungsten inclusions. An X-ray generator model (Balteau 300 kV) was employed as the source of radiation. A wire type image quality indicator with seven wires from wires 10–16 as per DIN 62 and radiographic film model (Kodak MX 125) were used.
Microstructure examinations
The microstructural features were characterised using metallographic specimens, which were cut from cross-sectional areas of the welded plates by a bandsaw machine model Marvel series 8-mark-i. A coolant was applied in bandsaw machine to avoid any possible change in microstructure. Twenty-five millimetres from the end of each welded plate was discarded. According to ASTM E3, metallographic specimens were ground on wet SiC paper from 220, 400, 600, 800, 1000, 1200 and 2000, degreased with acetone, rinsed by distilled water, and dried in dry air. Then, a sequence of polishing through 1 μm diamond paste was performed before final polishing on 0.05 μm alumina. All metallographic specimens were electrolytically etched using 10% oxalic acid solution for 25–30 s at potential of 5–6 V to produce contrast among different phases. Microstructural investigations were conducted by an optical microscope model (Olympus DP 71) and scanning electron microscope (SEM) model (Philips-XL30) operating up to 30 kV equipped with an energy dispersive spectroscopy (EDS) to analyse chemical composition of weldments and intermetallic phases, and the results were gathered by ZAF software.
The macrosection of welded joints was evaluated to check the penetration and to measure the dilution. The ferrite content in the weldments was assessed using a computer image analysis programme. It is important for the ferrite content in the weld metals of duplex stainless steels to be crucial to obtain optimum mechanical properties.
Mechanical tests
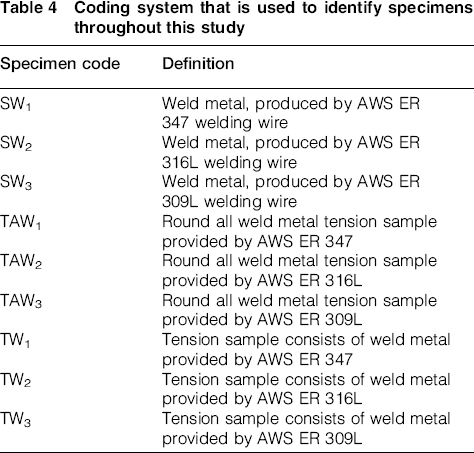
To obtain hardness profiles, cross-sectional Vickers microhardness measurements were conducted on the welds and base metals of etched specimens according to ASTM E384 at a load of 100 g, with loading time of 15 s, using a microhardness tester model (Leitz-Wetzler). It must be noted that three points were averaged for each zone. The round all weld metal tensile specimens were tested for evaluation of mechanical properties of the deposited weld metal including ultimate tensile strength, yield strength and elongation. As illustrated in Fig. 2a, these specimens were machined from the weldments with a gage length of 25 mm and diameter of 6 mm. In addition, uniaxial transverse tensile test, i.e. weld perpendicular to loading direction, was carried out on flat transverse tensile specimens with a gage length of 25 mm and width of gage section of 6.25 mm in cross-section. The weld metal is in the centre of the gage length, and the cutting axis length is perpendicular to the weld fusion line as illustrated in Fig. 2b. Transverse tensile tests were performed to characterise weld deformation and failure modes and also to compare the strength of weld zones to base metals. All produced tensile specimens were finely polished to remove the remaining scratches and to prevent stress concentration. To validate the accuracy of tensile test results, three specimens for both round all weld metal tensile test and uniaxial transverse tensile test were tested for each weld joint by employing a tensile tester instrument model (Hounsfield H50KS) as per ASTM E8. All tensile tests were conducted at a nominal strain rate of 0.1 s− 1 at room temperature, and the standard tensile properties of 0.2% offset yield strength, ultimate tensile strength and elongation (%) were determined. The fractured surfaces of specimens were examined by utilising an SEM equipped with an EDS. To sum up, the coding system that is used to identify all specimens throughout this study is described in Table 4.
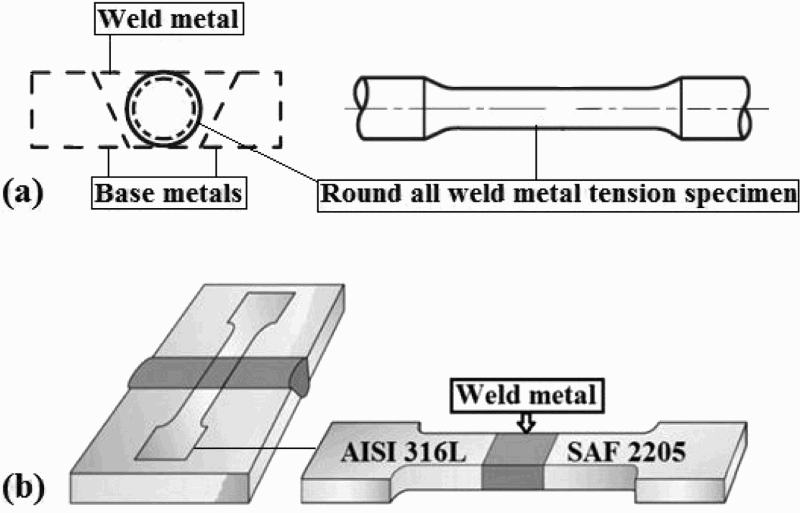
Tension test specimens schematically: a position of round all weld metal samples relative to weld fusion line; b position of transverse tension samples relative to weld fusion line
Coding system that is used to identify specimens throughout this study
Results and discussion
Non-destructive investigations
Visual assessments indicated no significant discontinuities in welded joints except a number of small undercuts, which were within acceptance criteria according to AWS D1.1. These undercuts were easily removable because of small depth, < 0.3 mm. The results of liquid penetration exhibited no existence of surface discontinuities for weldments. Radiographs indicated that except a number of small undercuts, no cracks were distinguished throughout the weld line of the specimens SW1, SW2 and SW3. No bright spots discerned within weld lines in radiographs, meaning that no tungsten inclusions were created in the weld metals of all specimens. Tungsten inclusions are brittle and decrease the mechanical properties of weldments. In accordance with non-destructive investigations, it was deduced that welding parameters and welding wires were opted appropriately for this dissimilar joint from standpoint of weldability, especially non-existence of cracks.
Microstructure of weld metals
Each welded joint was filled by four welding layers. Dilution levels were estimated using metallographic methods and image analysis programme to measure the individual geometric cross-sectional areas of the deposited filler metal and melted base metal. Average dilution level for each welded joint was 35 ± 2%. Chemical compositions of weld metals of specimens SW1, SW2 and SW3 were analysed by a metal analyser instrument, and the results are shown in Table 5.
Chemical compositions of weld metals/wt-%
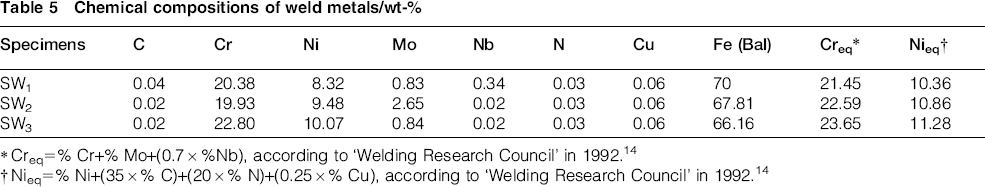
Creq = % Cr+% Mo+(0.7 × %Nb), according to ‘Welding Research Council’ in 1992. 14
Nieq = % Ni+(35 × % C)+(20 × % N)+(0.25 × % Cu), according to ‘Welding Research Council’ in 1992. 14
Figure 3 shows the microstructures of the fusion zone of the weld metals SW1, SW2 and SW3 by optical microscopy. The dark grey dendrites and the light grey regions are δ-ferrite and austenite phase respectively. At the beginning of solidification, the core of the δ-ferrite dendrites is richer in Cr, while the outer portions, which form in lower temperature, have lower chromium contents. Then, upon cooling, the outer portions of the dendrites, which have less Cr, transform to austenite and thus leave behind Cr rich skeletons of δ-ferrite at the dendrite cores. Austenite grows epitaxially from the unmelted austenite grains at the fusion boundary, and δ-ferrite soon nucleates at the solidification front. As illustrated in Fig. 3c, fine equiaxed grains are created in sample SW3. One of the main reasons for fine equiaxed grains is weld pool convection, which causes fragmentation of dendrite tips in the mushy zone. These dendrite fragments are carried into the bulk weld pool and act as nuclei for new grains to form.
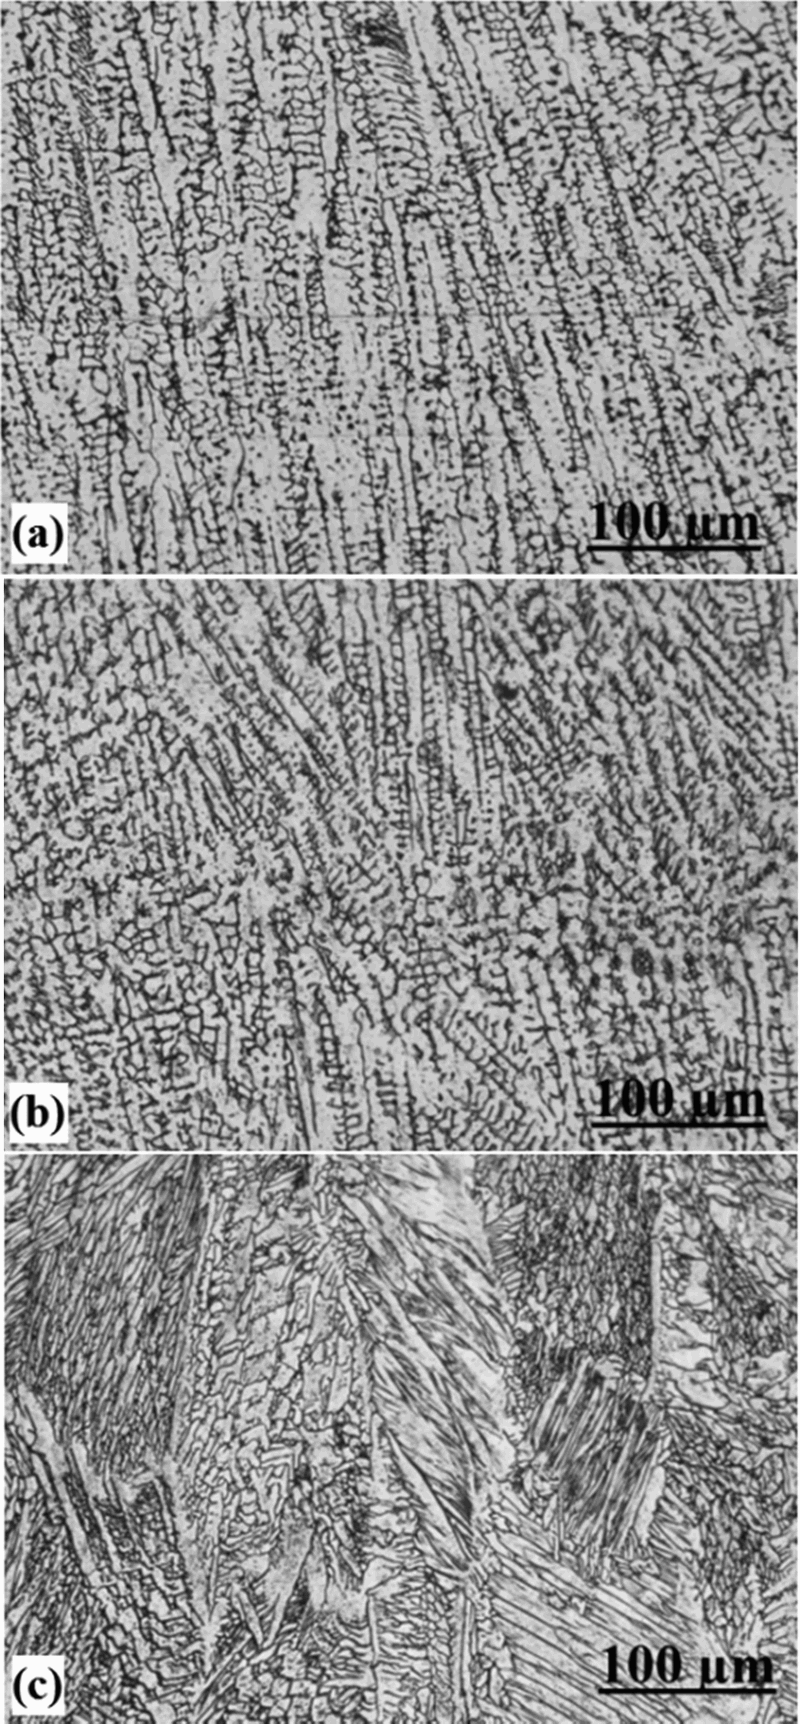
Optical micrographs of weld metals; light grey, austenite; dark grey, ferrite: a sample SW1; b sample SW2; c sample SW3
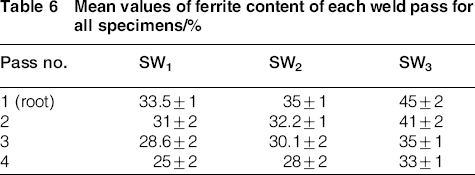
Ferrite contents in the weld metals were measured in three points of centreline of each weld pass for all samples, with the use of image analysis programme (Table 6). For all samples, upper weld passes contain lesser amounts of delta ferrite. This phenomenon is associated with slower cooling rate in upper weld passes due to the preheating of the base metals that resulted from prior weld passes. Table 6 reveals that the ferrite content in the fusion zone of SW3 is higher than the other samples. This is related to the highest Creq content of SW3. This phenomenon indicates the effect of chemical composition on ultimate fusion zone microstructure.
Mean values of ferrite content of each weld pass for all specimens/%
Hot cracks were not observed in the weld metal for all samples. Weld metals solidify partly as ferrite and show high resistance to hot crack formation. Therefore, from standpoint of cracking, combination of studied fillers seems to be a suitable choice for dissimilar austenite duplex joints.
Figure 4 depicts backscattered electron micrographs of fusion zone of SW1 and corresponding EDS spectrums. The assessment of the partitioning of major alloying elements between ferrite and austenite in SW1 by EDS analysis reveals that ferrite is enriched in Cr and Mo, 15 while austenite is enriched in Ni (Fig. 4b and c). As illustrated in Fig. 4a, sigma phase in the weld metal of SW1 is created. The sigma phase nucleates at the ferrite/austenite interface, which grows towards the ferrite grains as a result of the eutectoid reaction (α → σ+γ). 16 Corresponding EDS spectrum for chemical composition of sigma phase is indicated in Fig. 4d. In the presence of large quantities of Cr and Mo, the possibility of occurring the brittle tetragonal sigma phase (σ) rises.17-20 In addition, higher carbon content of SW1 leads to forming some carbide. As illustrated in Fig. 4a, the existence of higher values of carbides in SW1 results in the creation of some sigma phase in ferrite/austenite interface, which grows towards the ferrite grains in the weld metal. Backscattered electron micrographs of weld metals of SW2 and SW3 show no intermetallic particles especially due to the lower content of carbon (Fig. 4e and f).
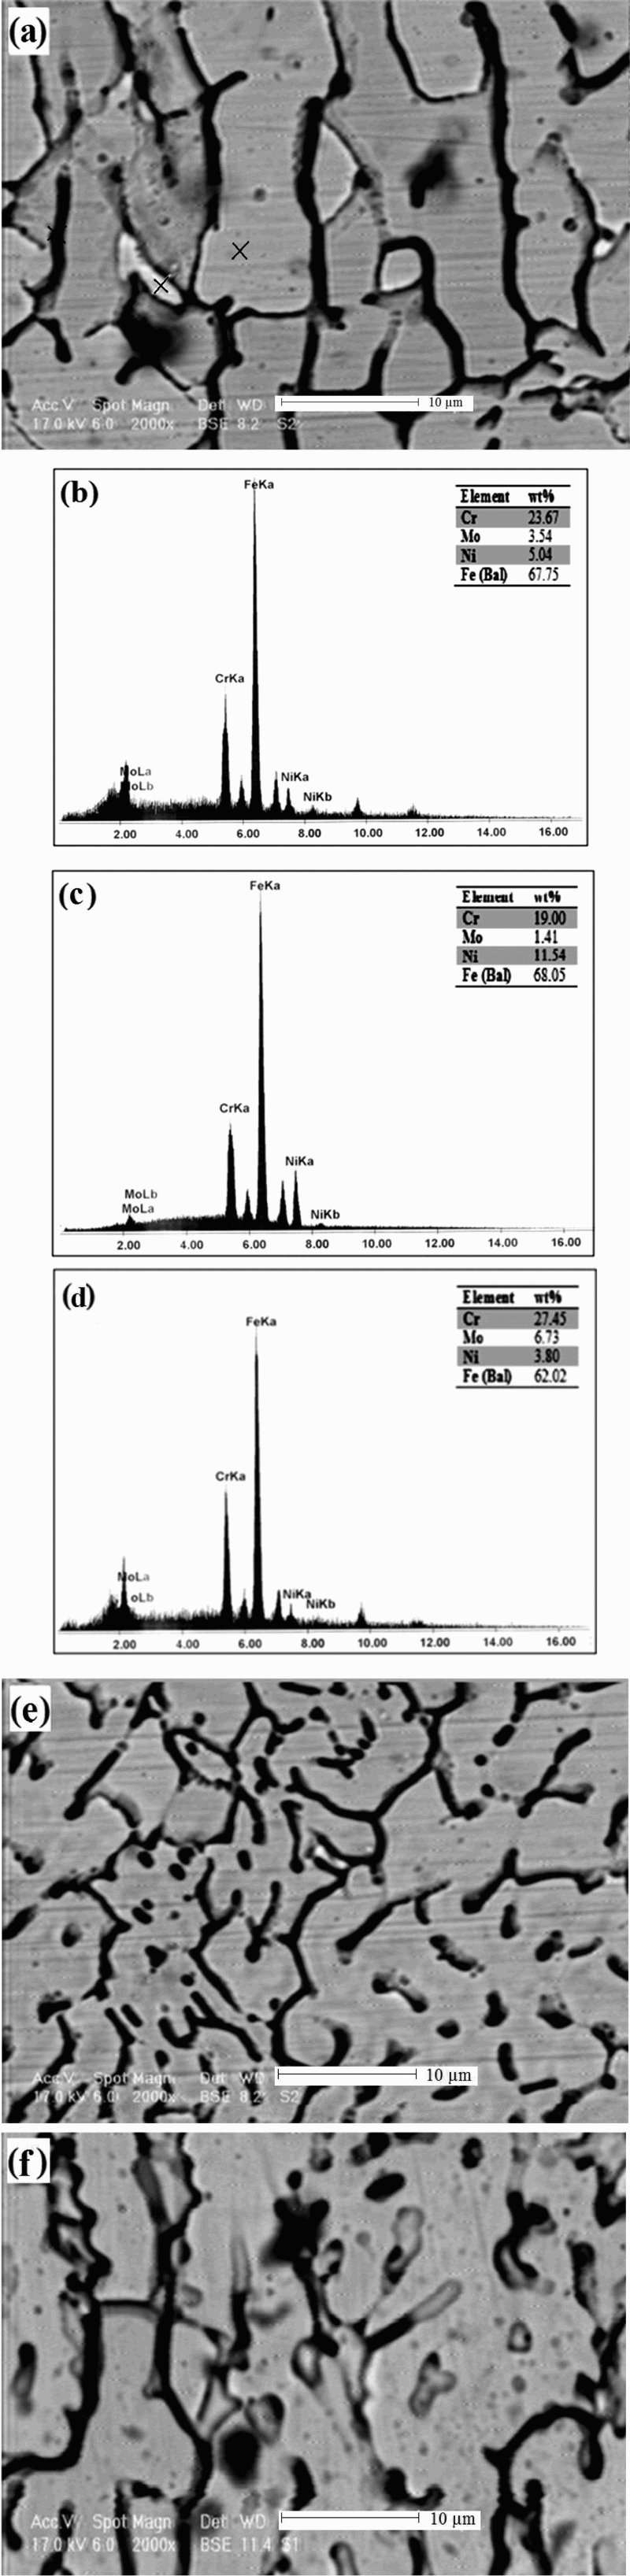
Backscattered electron micrographs of fusion zones: a sample SW1; b corresponding EDS spectrum for chemical composition of ferrite phase; c corresponding EDS spectrum for chemical composition of austenite phase; d corresponding EDS spectrum for chemical composition of sigma phase; e sample SW2; f sample SW3
Hardness investigations
Figure 5 shows the Vickers microhardness profiles of weldments. As illustrated, Vickers microhardness across the centreline of the weld metals is relatively flat for all samples. The weld metals of all samples exhibit higher hardness values than austenitic steel base metal and lower values than duplex steel base metal. In addition, the weld metals, which are produced by different filler metals, show variations in the average hardness values. Weld metal of sample SW3 displays the highest hardness value among the studied weld metals, whereas the weld metal of sample SW1 shows the lowest. This remarkable difference can be attributed to chemical composition and chromium equivalent differences (Table 5). In addition, the maximum hardness of SW3 among the investigated weld metals can be attributed to the higher ferrite content, which can enhance the strength and hardness.21, 22 The higher chromium equivalent in weld metals for all samples relative to austenitic steel base metal results in higher content of ferrite phase. Therefore, weld metals for all samples show higher hardness than austenitic base metal.
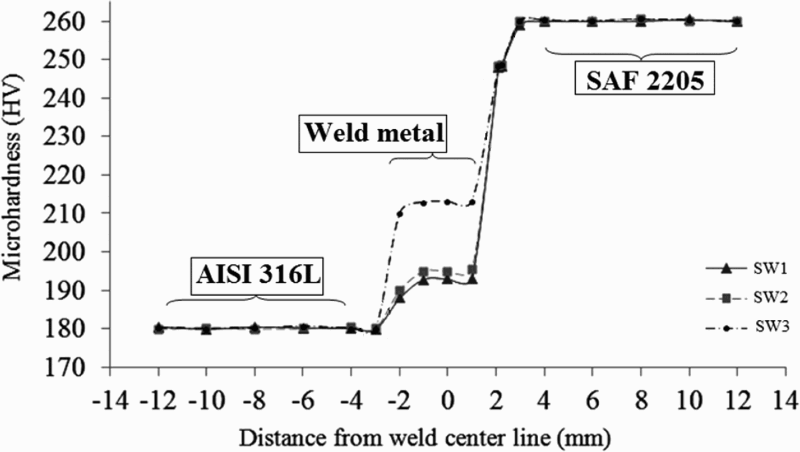
Microhardness profiles across centreline of weld metals of specimens
Although chromium equivalent in sample SW2 is higher than in sample SW1, there is no significant difference in their average hardness values. The weld metal of sample SW1 exhibits the increase in hardness in comparison with base metal due to sigma precipitation. Furthermore, the presence of niobium carbides in the weld metal can be influential on hardness in the weld metal of sample SW1. 23
Round all weld metal tensile specimens
The results of round all weld metal tensile tests at room temperature are illustrated in Table 7. In contrast to sample TAW1, sample TAW3 shows the best total elongation and resists higher amount of stress. It is obvious that the existence of brittle precipitated particles in the weld metal of sample TAW1 limits deformation and affects flow behaviour of weld metal.23–26
Quantitative results of tensile tests for round all weld metal tension specimens at room temperature
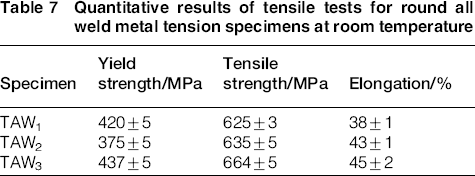
The higher value of yield strength of sample TAW1 rather than sample TAW2 can be attributed to the higher concentration of Nb element in its weldment, since the presence of Nb element increases the proof strength of stainless steels. 27 However, the yield strength of sample TAW3 has the highest value due to the existence of highest value of chromium. Chromium will provide some degree of solid solution strengthening since it is a substitutional atom in both body centred cubic and face centred cubic crystal lattices. 28
Figure 6 shows one set of fractured round all weld tensile specimens after completion of tensile tests. It is clear that all samples have dimples, which reveal plastic deformation for all samples. The tensile test fractured surfaces of the specimens were examined by SEM/EDS, and the results are presented in Fig. 7. The fractographs of fractured surfaces of samples TAW1, TAW2 and TAW3 exhibit surface inequalities, which are attributed to plastic deformation as shown in Fig. 7a, e and g respectively. As illustrated in Fig. 7b, the morphology of fractured surface of sample TAW1 exhibits mixed fracture, which consists of regions of cleavage fracture and plastic deformed interfaces. Moreover, it can be observed that a number of precipitated particles locate in the valleys of the weld metals (Fig. 7b). According to Fig. 7c, examination at higher magnification of fractured surface and using elemental analysis by EDS reveals that precipitated particles are Nb rich phases (Fig. 7d). This observation is evidence of mixed fracture and the detrimental effect of the solidification products on the weld metal ductility. Sample TAW1 has the lowest ductility.
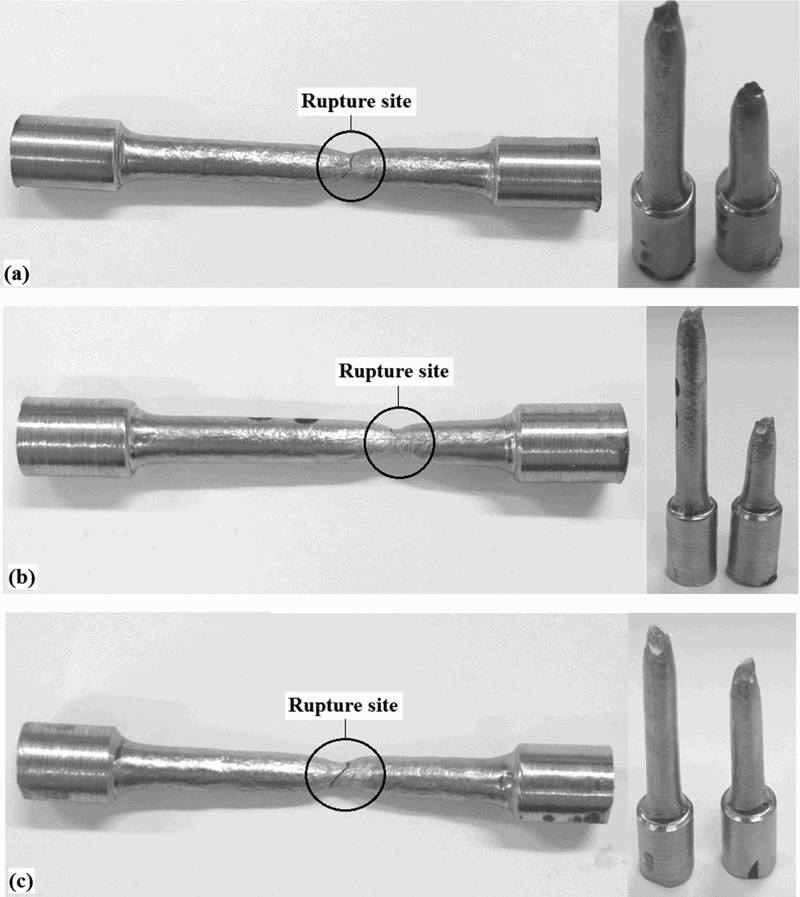
Fractured round all weld metal tension specimens: a sample TAW1; b sample TAW2; c sample TAW3
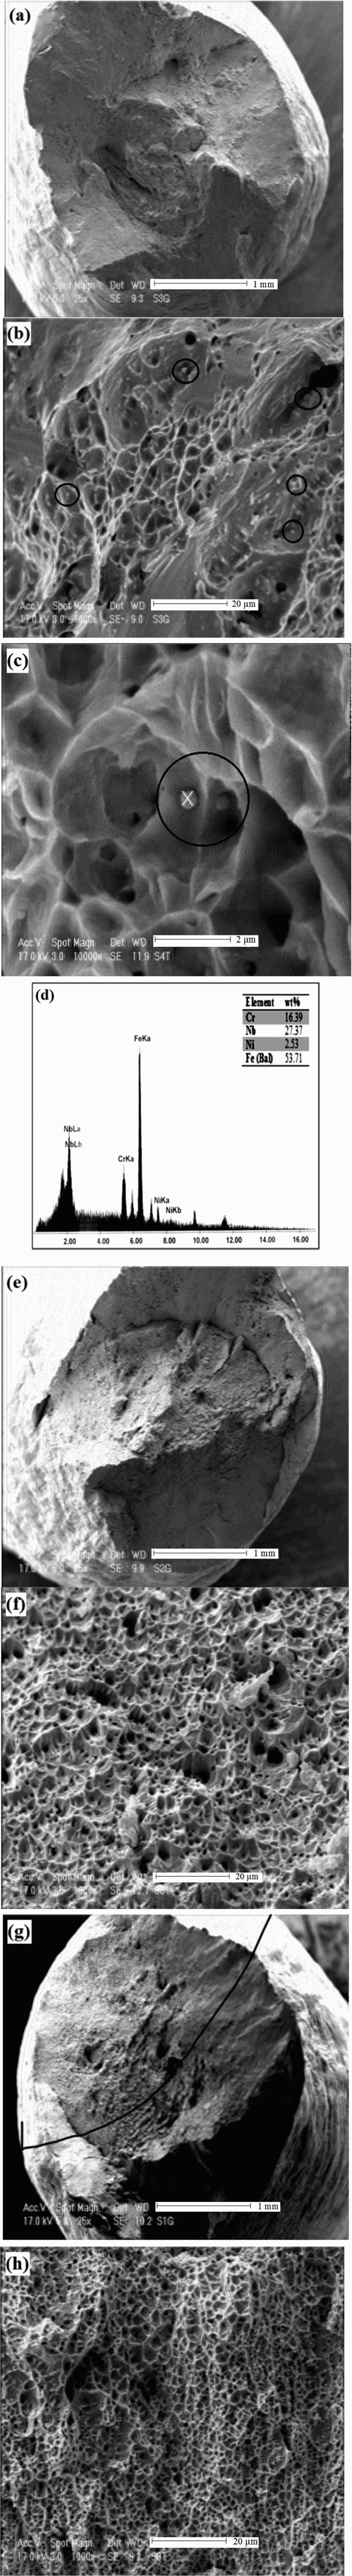
Secondary electron fractographs of fractured round all weld metal tension specimens: a fractured surface of sample TAW1; b morphology of fractured surface of sample TAW1 (circles show precipitated particles); c celtic cross shows precipitated particle in fractured surface of sample TAW1 at higher magnification; d corresponding EDS spectrum for chemical composition of precipitated particle; e fractured surface of sample TAW2; f morphology of fractured surface of sample TAW2; g fractured surface of sample TAW3; h morphology of fractured surface of sample TAW3
The morphology of fractured surfaces of samples TAW2 and TAW3 is covered with deep dimples, which reveals better tendency of steel to plastic deformation and shows fully ductile fracture (Fig. 7f and h). Enhancement in total elongation of samples TAW2 and TAW3 can be attributed to elimination of brittle precipitated particles in the weld metal and good homogenisation.
Rectangular tensile specimen
The results of rectangular tensile tests at room temperature are summarised in Table 8. The data indicate that the tensile strength of dissimilar welded samples is not below the minimum tensile strength for the weaker base metal (i.e. AISI 316L). Therefore, from standpoint of tensile strength, this welding condition is appropriate for the tested joints. Furthermore, sample TW3 has higher tensile strength and ductility compared to other samples.
Quantitative results of tensile tests for rectangular tension specimens at room temperature
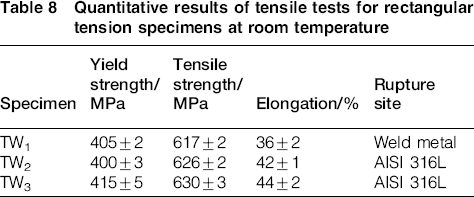
It is notable that, in contrast to sample TW1, samples TW2 and TW3 show excellent elongation and significant amounts of plastic strain, in spite of the higher weld metal hardness than the weaker base metal (i.e. AISI 316L). The low tensile properties of sample TW1 can be attributed to the inability of the sigma containing samples to work harden due to early fracture associated with the sigma particles. The role of the precipitated particles on the fracture process can be summarised as follows. 24 The sigma phase particles crack, while the matrix is still plastically deforming. If sigma phase particles are not present, the matrix can undergo extensive plastic deformations, which create microvoids.
One set of fractured rectangular tensile specimens obtained after tensile testing at room temperature is illustrated in Fig. 8. There is considerable necking before fracturing step, which produces the typical cup and cone fracture. As depicted in Fig. 8a, sample TW1 fails from the weld metal. As described previously, in the case of sample TW1, the formation of precipitated particles such as Nb rich particles and sigma phase led to embrittlement and a decrease in tensile properties. This depends not only on the amount of sigma phase but also on the size and distribution of other intermetallic particles that also precipitate during solidification of weldment.20, 24, 25, 29 Necking and failure occur in weaker base metal (i.e. AISI 316L) of samples TW2 and TW3 far away from weldments as shown in Fig. 8b and c respectively.
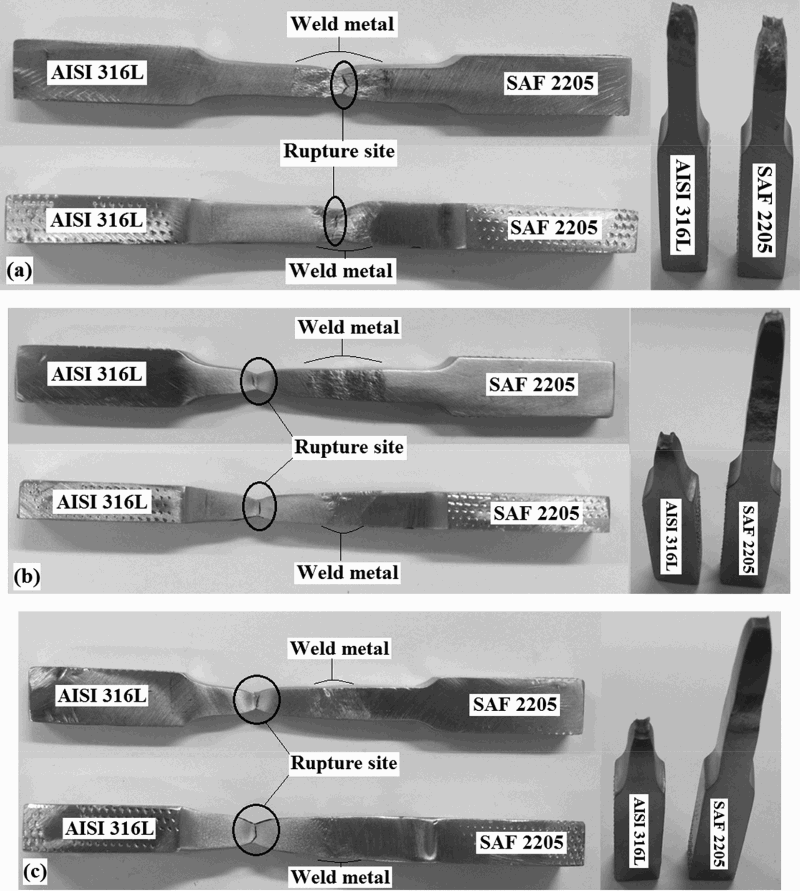
Fractured rectangular tension specimens: a sample TW1; b sample TW2; c sample TW3
The fractographs of samples and corresponding EDS spectrum for chemical composition of precipitated particles are illustrated in Fig. 9. As indicated in Fig. 9a, e and g, the fractographs of fractured surfaces of samples TW1, TW2 and TW3 exhibit surface inequalities and dimples, which are attributed to the plastic deformation. As depicted in Fig. 9b, the morphology of fractured surface of sample TW1 exhibits mixed fracture consisting of regions with flat and smoother surface. This suggests the cleavage fracture due to broken sigma phase particles 30 and dimples of a great variety of sizes. Moreover, a number of precipitated particles locate in the fractured surface. Figure 9c exhibits precipitated particles in the fractured surface at higher magnification. The EDS spectrum in Fig. 9d confirms that the particle indicated with celtic cross in Fig. 9c is Nb rich phases. This observation is proof of the mixed fracture and the damaging effect of the solidification products on the weld metal properties and fracture mechanism.
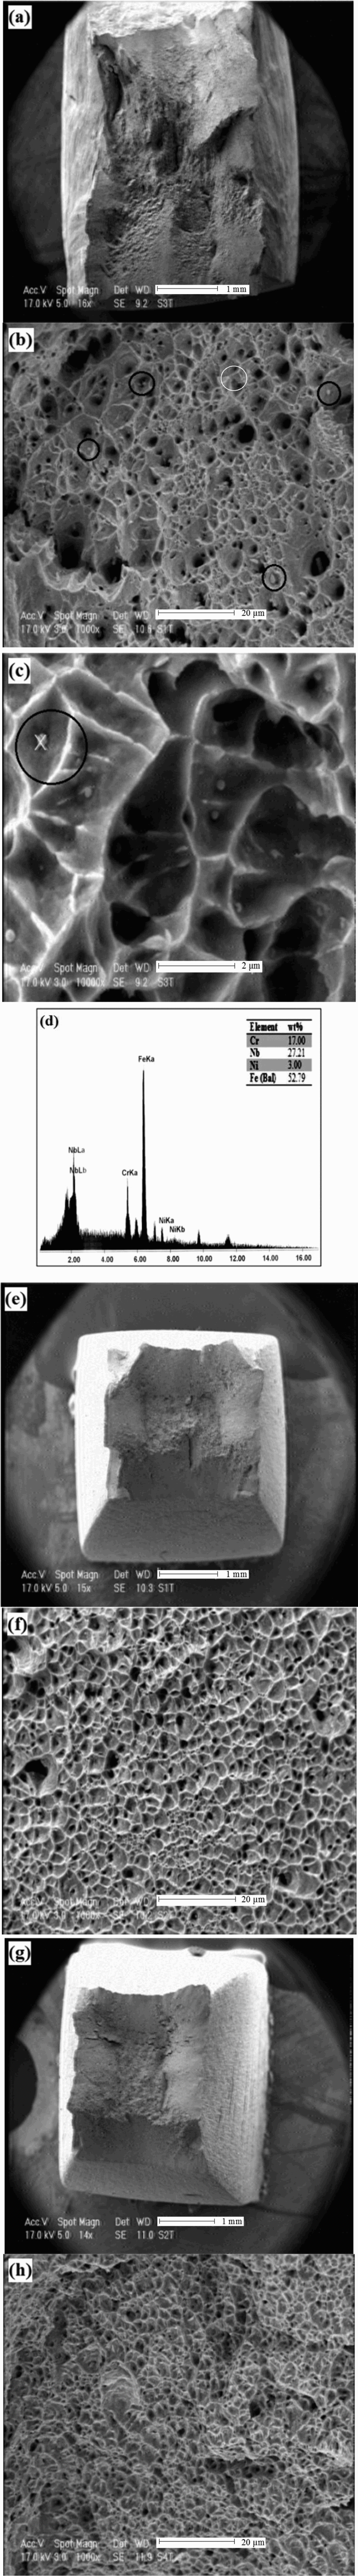
Secondary electron fractographs of fractured rectangular tension specimens: a fractured surface of sample TW1; b morphology of fractured surface of sample TW1 (circles show precipitated particles); c celtic cross shows precipitated particle in fractured surface of sample TW1 at higher magnification; d corresponding EDS spectrum for chemical composition of precipitated particle; e fractured surface of sample TW2; f morphology of fractured surface of sample TW2; g fractured surface of sample TW3; h morphology of fractured surface of sample TW3
In spite of sample TW1, the morphology of fracture surfaces of samples TW2 and TW3 contains dimples of different sizes, which exhibits pure microvoid coalescence and fully ductile fracture (Fig. 9f and h). In the case of sample TW1, although these weld metals have a proper tensile strength compared to the weaker base metal, the precipitated particles result in the decrease in ductility.
Conclusions
Two different stainless steels, SAF 2205 and AISI 316L, were welded together by the GTAW process using different types of filler metals. The results of non-destructive tests confirmed no internal discontinuity, especially cracks, and tungsten inclusions exist in produced welds. According to microscopic observations and energy dispersed spectrometry, the microstructures of all samples included austenite enriched in Ni and skeletal ferrite enriched in Cr and Mo. Both austenite and ferrite grew epitaxially at the fusion line. Moreover, the existence of higher values of carbon and carbides in sample SW1 relative to other samples resulted in the creation of some sigma phase in ferrite/austenite interface, while this phenomenon did not occur in samples SW2 and SW3.
The weld metals of all samples exhibited higher hardness values than AISI 316L base metal and lower values than SAF 2205 base metal. The weld metal of sample SW3 displayed the highest hardness value due to the presence of higher values of ferrite, which can enhance the strength and hardness.
Among round all weld metal tension specimens, sample TAW3 showed the best total elongation due to the existence of the highest value of chromium, which provided some degree of solid solution strengthening. In addition, sample TAW1 showed the lowest total elongation and tensile strength due to the existence of brittle precipitated particles in the weldment. The morphology of fractured surface of sample TAW1 exhibited mixed fracture, which is composed of regions of cleavage fracture and plastic deformed interfaces. The morphology of fracture surfaces of samples TAW2 and TAW3 was covered with deep dimples, revealing a fully ductile fracture.
According to uniaxial transverse tensile testing, the tensile strength of dissimilar welded samples was not below the minimum tensile strength for the weaker base metal (i.e. AISI 316L). Therefore, such welding conditions were suitable for tested joints. However, the weld metal of sample TW1 failed due to the formation of precipitated particles such as Nb rich particles and sigma phase. This led to embrittlement and a decrease in tensile properties. The morphology of fractured surface of sample TW1 exhibited mixed fracture, which was composed of regions of smoother and flat surface, suggesting cleavage fracture.