
Abstract
In the present study, 6 mm nominal thickness dissimilar steel plates were joined using friction stir welding. The materials used were duplex stainless steel and low alloy structural steel. The weld was assessed by metallographic examination and mechanical testing (transverse tensile and fatigue). Microstructural examination identified four distinct weld zones and a substantially hard region within the stir zone at the base of the weld tool pin. Fatigue specimens demonstrated high level fatigue life and identified four distinct fracture modes.
Introduction
Welds between dissimilar metals and alloys have become an integral component within several engineering sectors due to the numerous economic and engineering benefits. 1 Examples include lightweight aluminium alloy to steel for use in the automotive 2 and aerospace sectors and dissimilar steels within the shipbuilding, power generation, and oil and gas industries due to different thermal and corrosive properties. 3
Such joints are typically produced using fusion welding techniques. However, problems inherent with these techniques arise due to a number of issues, such as dissimilar thermal properties and melting temperatures.4–7 Joining aluminium and steel will form hard, brittle intermetallic compounds, 6 while using stainless steel in dissimilar joints can lead to poorer corrosion properties if the dilution is not correctly controlled. 7 Therefore, careful design considerations are critical in terms of selection and application of dissimilar joints. For these reasons, work was initiated to establish and assess the feasibility of joining dissimilar materials using friction stir welding (FSW).8–23
Extensive work has been carried out to demonstrate the advantages of FSW for a range of metals24–36 and a growing amount of work for dissimilar alloys.1, 8–23 Results from FSW of dissimilar materials highlighted the viability of such a process with the majority of reports concluding that high quality, defect free welds had been produced. Nevertheless, there were a few issues and considerations revealed: the level of material flow is closely linked to weld tool rotational speed, 8 high quality welds were produced when the material requiring the highest flow stress to induce thermomechanical deformation (i.e. greater hardness) was placed on the advancing side, 10 too great a traverse speed induced top surface groove-like defects due to lack of heat input, 14 and tool pin offset is an important factor to balance tool wear, material flow and weld penetration depth.11, 16
With supporting evidence that FSW could be applied to dissimilar materials,1, 8–23 some focus was shifted towards dissimilar steel joints. Research in FSW of dissimilar ferrous alloys is immature and continuing to develop, unlike more traditional fusion welding processes.
Wang et al. 4 report on the joining of API X70 low alloy steel to UNS S31803 duplex stainless steel (DSS) via both gas metal arc welding (GMAW) and gas tungsten arc welding (GTAW) and compare the results. It is reported that both fusion welding processes produced sound welds, but GMAW produced superior welds with better mechanical properties and corrosion resistance. Celik and Alsaran 5 discuss the quality of welds produced using steel st37-2 and stainless steel AISI 304 via GTAW. Reporting on the dissimilar welds, it was concluded that tensile strength was greater than the similar st37 weld, ductility was higher than either of the similar material welds, and the microstructure of the AISI 304 stainless steel close to the weld interface presented little change as a result of the welding process.
Published work on FSW of dissimilar steels is very sparse, with Jafarzadegan et al. 8 being one of the very few. This work reports on FSW of AISI 304 stainless steel to st37 steel at two different weld tool rotational speeds: 400 and 800 rev min− 1. The microstructural examination 8 identified four different microstructures within the weld material—st37 steel heat affected zone (HAZ), AISI 304 stainless steel thermomechanically affected zone (TMAZ) and both material stir zones (SZ)—and presented that the weld centre contained alternating bands of the two steels. It was also suggested that the 304 stainless steel within the SZ recrystallised due to the hot deformation during the welding process in the austenite region, leading to transformation of the austenite grains to two different microstructures: ferrite and pearlite, and Widmanstatten ferrite with colonies of ferrite and cementite. 8 The SZ of the AISI 304 stainless steel displayed evidence of dynamic recrystallisation, which was one of the reasons for the increase in hardness within the weld SZ, the other being the transformation of the st37 steel.
Jafarzadegan et al. 8 determined the yield strength (YS) and ultimate tensile strength (UTS) of the welds. The results confirmed that the weld was stronger than the st37 base material and had a comparable elongation at the lower rotational speed (400 rev min− 1), but the higher rotational speed (800 rev min− 1) weld had lower elongation. This was due to the presence of tungsten carbide–metallic cobalt (WC-Co) particles, resulting from tool wear, which reduced the weld's ductility.
The present study further develops the understanding of FSW between dissimilar steels by investigating the microstructural characteristics and mechanical properties of FSW between 2205 grade DSS and S275 low alloy structural steel (S275). It characterises the typical microstructure and identifies possible enhancements of key mechanical properties such as YS, UTS and fatigue life.
Experimental
Materials and welding process
The chemical composition was determined using inductively coupled plasma optical emission spectroscopy and combustion techniques; the results are shown in Table 1. The plates measured 2000 mm × 200 mm × 6 mm nominal thickness, which when butt welded produced a fabricated plate with dimensions 2000 mm × 400 mm × 6 mm nominal thickness.
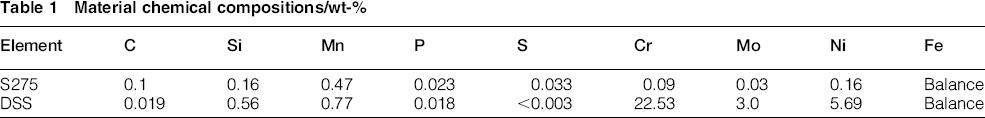
Material chemical compositions/wt-%
The welds were produced in an inert atmosphere using a PowerStir FSW machine and a MegaStir Q70 pcBN with W-Re binder tool, and a pin length of 5.7 mm. The plates were heavily clamped to a welding bed with the DSS on the advancing (AD) side, the side of the weld where the rotating FSW tool pushes the material in the same direction as the tool's traverse direction, and the S275 on the retreating (RT) side. The FSW tool's traverse speed was 100 mm min− 1 and rotational speed was 200 rev min− 1, with a 0.6 mm offset towards the AD side. Weld assessment focussed on microstructural evolution using light optical microscopy and examination of mechanical properties, such as microhardness, transverse tensile and fatigue tests.
Microstructural examination and mechanical property assessment
Five samples were sectioned along the length of the weld and prepared for microstructural examination using standard metallurgical preparation methods. Owing to the different etching requirements in dissimilar joints of this type, the final etching phase was performed in two stages: etching the S275 first, analysing the sample and then etching the DSS. The S275 was etched using 2.5% Nital solution, and the DSS was electrolytically etched using 10% oxalic acid, 1 V dc current and electrode contact for 20 s. The microstructural examination was performed using an Olympus GX-51optical microscope at varying magnifications. In addition, microhardness mapping was performed using a grid measurement technique with 250 μm grid spacing and an applied load of 1 kg.
A scanning electron microscope (SEM) with energy dispersive spectroscopy (EDS) was utilised to assess atomic diffusivity between the dissimilar materials. The machine used was a Hitachi S-3700 (2010) tungsten filament SEM with an Oxford Inca 350 with 80 mm X-Max detector.
Three specimens were sectioned that transverse to the weld in accordance with ISO standard 37 for tensile testing. The transverse tensile tests were performed using an Instron 8802 servo-hydraulic, uniaxial tensile testing machine following the appropriate ISO standard. 38 All tests were completed using the same consistent test method: initial extension rate of 0.5 mm min− 1, measured using an extensometer, up to an extension of 1.25 mm and then an extension rate of 5 mm min− 1 up to fracture, with the 0.2% proof stress results used as the basis for calculating fatigue test stress ranges.
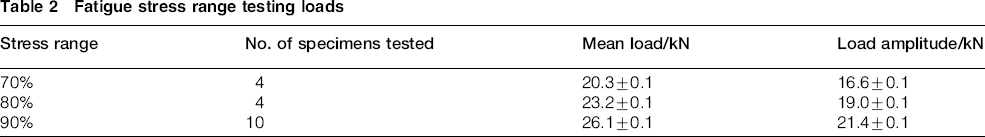
Fatigue testing was completed using the same Instron machine as tensile testing with specimens sectioned, prepared and tested in accordance with the published guidance report. 39 The testing consisted of 18 transversely sectioned specimens tested at three different stress ranges as shown in Table 2.
Fatigue stress range testing loads
Results and discussion
Microstructural examination
Macrographs were taken after each etching phase (Fig. 1a and b) and illustrate the recurring weld material mix. The welds displayed complex stirring producing interlocking ‘fingers’ of both materials on either side of the weld centreline. Thin layers of the S275 material had been stirred to the very extreme of the DSS TMAZ in many of the prepared samples; the thin layers' flow orientation was in a similar way to the boundary between parent material (PM) and TMAZ of the DSS (∼45° angle to top and root surfaces).
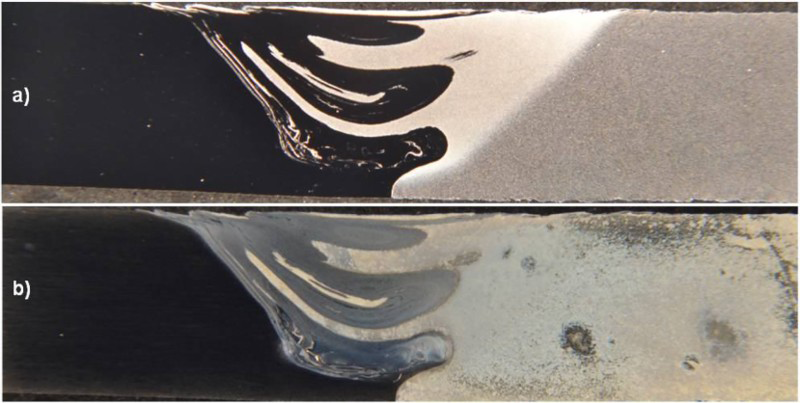
a typical weld profile with S275 etched; b typical weld profile with DSS etched
The microstructural examination was undertaken to identify the material changes as a direct result of the FSW process and to study the dissimilar material interactions and weld interface. The four identified weld zones are characterised as the DSS TMAZ, the DSS SZ (which was the DSS material in direct contact with the tool pin tip during the FSW process), the S275 TMAZ and the S275 HAZ. Figure 2a presents the transition between the different weld zones within the DSS. There was no identifiable HAZ within the DSS, also reported by Saeid et al., 26 so the weld zones on the AD side were PM, narrow TMAZ and SZ. At the boundary between the DSS PM and TMAZ, the austenite and ferrite grains were reorientated as a result of the stirring inputs, before significant deformation in the outer SZ. From PM to HAZ within the S275 (Fig. 2b), there is significant grain refinement, as is commonly observed.8, 28, 31 The TMAZ demonstrated a microstructure consistent with dynamic recrystallisation, evidenced by the refined, equiaxed grains. Figure 2c displays the unaffected DSS PM, which consists of an ∼50:50 ratio of elongated ferrite and austenite grains.26, 27 Furthermore, Fig. 2d shows the S275 PM, which consists of equiaxed ferrite grains and distributed pearlite colonies, a typical mild steel microstructure.28-31
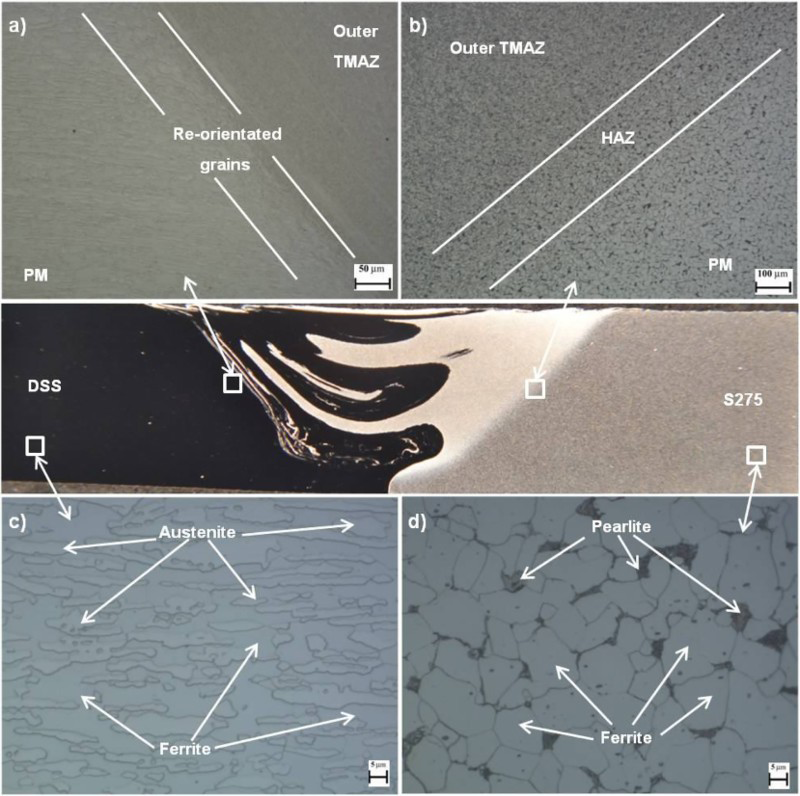
Central macrograph showing weld profile with highlighted areas of analysis: a DSS grain reorientation; b S275 HAZ grain refinement; c DSS PM; d S275 PM
Figure 3a shows the typical weld top surface, at the centre of the weld's width and to an approximate depth of 0.25 mm. This is where the FSW tool's rotating shoulder made direct contact with the two alloys. This region exhibits good material mixing with both alloys experiencing sufficient thermomechanical stirring to allow them to be stirred past the weld centreline to the opposing side of the weld. Also presented (Fig. 3b) is the top surface at the edge of the weld at the RT side where a surface breaking non-metallic inclusion is present; such inclusions 34 were not identified in all microscopy samples and those that had an ∼0.25 mm penetration depth. Such inclusions created a discontinuity in the weld's top surface and were reported to be primarily oxide scale with traces of paint primer 34 since the plates received no prior preparation. Figure 3c displays the frequently seen thin layers of S275 material within the DSS TMAZ near its boundary with the DSS PM. The layers followed the direction of the DSS boundary line, as can be deduced from Fig. 1a, and varied significantly in thickness (Fig. 3c). The layers nearer the DSS zone boundary were narrower, only a few grains wide in many cases and tailing off on approaching the top surface. The identified weld root flaw (WRF) varied in magnitude between 0.5 and 0.75 mm; an example is shown in Fig. 3d measuring 0.6 mm depth from the root surface, which is a large portion of the plate thickness, ∼10%.
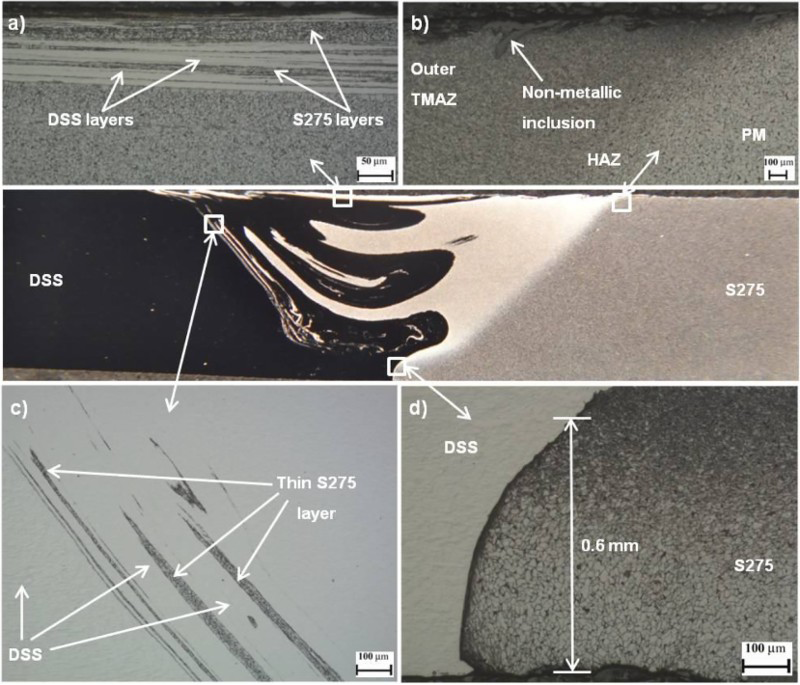
Central macrograph showing weld profile with highlighted areas of analysis: a top surface material mix; b S275 top surface; c thin S275 layers in DSS outer TMAZ; d typical WRF
The SZ at and near the tip of the weld tool pin was very complex; Fig. 4a, c and d demonstrates this observation and identifies the intermittent voids created. Figure 4a also shows the SZ within the DSS near the tip of the weld tool pin, and with AD side position bias. This figure demonstrates the significant deformation and grain refinement experienced, and also the complexity and randomness of the stir pattern and material flow. Figure 4b illustrates the dissimilar material interface near the centre of the weld at the end of a mid-depth DSS ‘finger’ with the S275 steel etched. Diffusion of carbon from the S275 to the DSS7, 40-42 is clearly indicated by the presence of a fine single phase ferrite (approximately one single grain) boundary at the interface between the two alloys and the absence of pearlite within the S275 (Fig. 4b). Optical microscopy examination demonstrated that this was common at the dissimilar material interface within the weld, regardless of depth from the top surface. The SZ is also displayed from within a large depth DSS finger that extends into the S275 material near the S275 HAZ (Fig. 4d). The central portion of the DSS finger exhibits a similar complex microstructure as that shown previously, but the outer edge of the finger has a less refined microstructure.
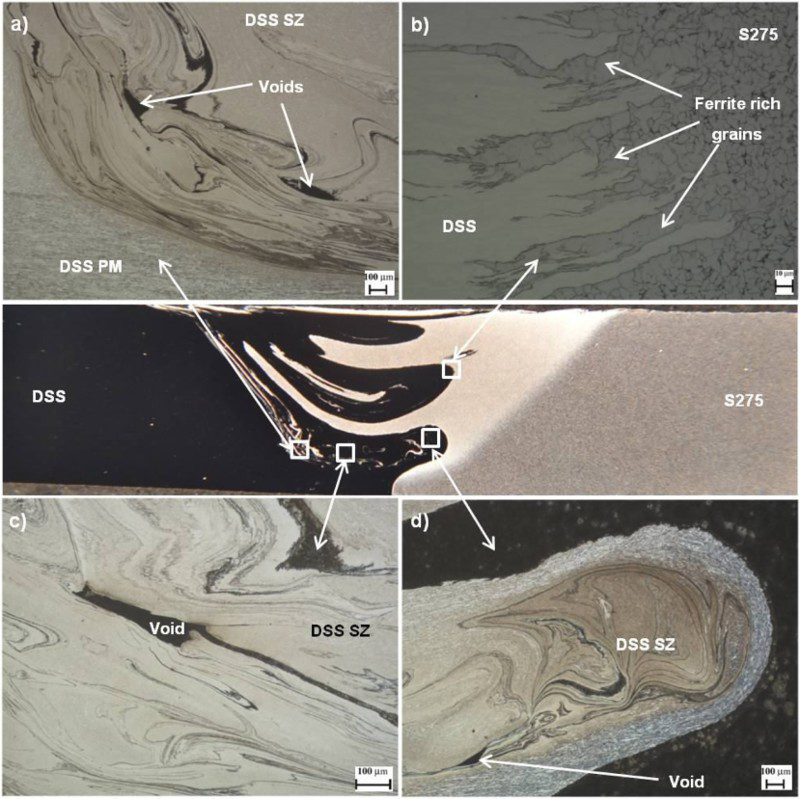
Central macrograph showing weld profile with highlighted areas of analysis: a DSS SZ with voids highlighted; b ferrite rich grains within S275 at dissimilar material interface; c DSS SZ with void highlighted; d lower DSS finger with SZ
Microhardness
Results highlighted the difference in hardness of the dissimilar PMs; hardness measurements were 250HV and 160HV for the DSS and S275 respectively, and the significant hardness increases inside each material's TMAZ. The DSS SZ within the vicinity of the tool pin tip produced the area of greatest hardness with measurements exceeding 385HV, widely reported elsewhere.8, 11, 12
Figure 5 shows the microhardness map, displaying the varying microhardness readings and highlighting the S275 thin layer, and intermittent voids. The S275 layer is presented as a series of separate low hardness readings, but in reality, this is one continuous layer of low hardness. As previously identified (Fig. 4a, c and d), the SZ material near the tip of the weld tool pin contained intermittent voids, which varied in size and location.
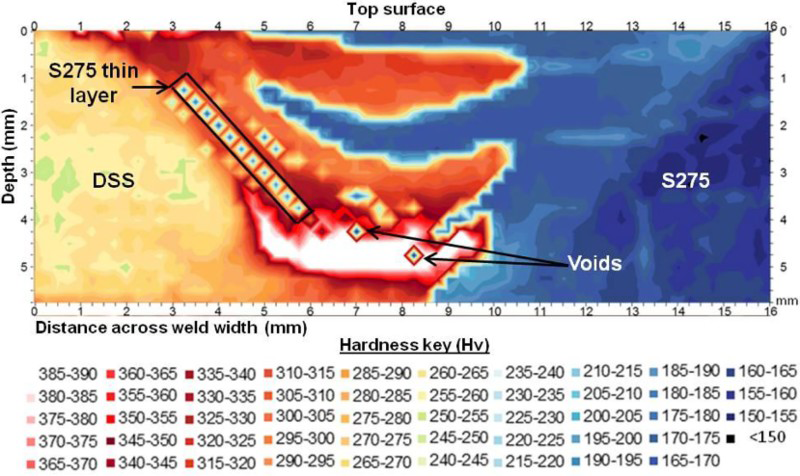
Microhardness surface map with hardness magnitude key
The DSS SZ is where the high hardness values were recorded, as shown in Fig. 5. The severe strain induced deformation and significant grain refinement observed at this location were the reasons for this high hardness region.
SEM with EDS
Evidence of carbon diffusion from the S275 material to the DSS was observed, as shown in Fig. 4b. SEM was used to identify other elements that had diffused from one material to the other during the FSW process, namely, chromium (Cr), nickel (Ni) and molybdenum (Mo) from the DSS to the S275 in the SZ. Jafarzadegan et al. 8 also discussed the diffusion of elements within the SZ and found that alloying elements diffused from one material to the other at the dissimilar material interface due to the high temperatures and strain induced diffusion.
There was significant evidence demonstrating the diffusion of Cr from the DSS to the S275 at the material interface, at all depths and locations within the weld, and reaching up to ∼80 μm into the S275 material. There was, however, very little diffusion of Ni or Mo measured. The DSS-S275 interface on the RT side of the weld centreline exhibited no such diffusion, whereas the interface at the furthest reaches of the DSS rich AD side demonstrated Ni and Mo diffusion. One such example is illustrated in Fig. 6 as a line of measurements; the tabulated results are provided in Table 3. The line consisted of seven point readings separated by ∼10 μm, with the first reading in the DSS, the second reading at the dissimilar material interface and the remaining five readings within the S275.
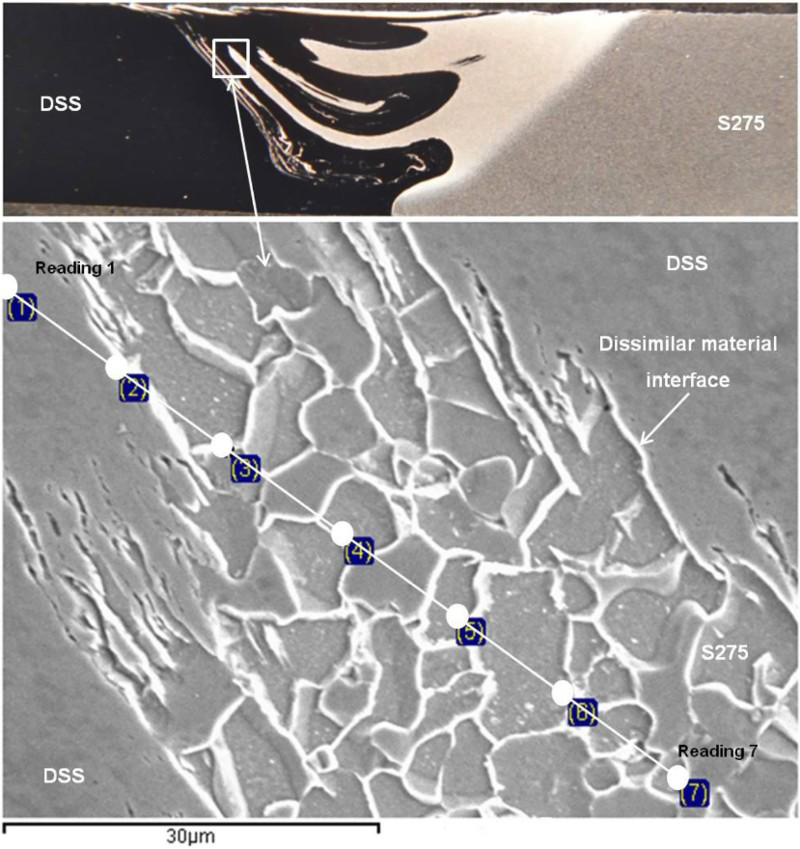
SEM measurement line at material interface and macrograph showing location
SEM/EDS elemental analysis results
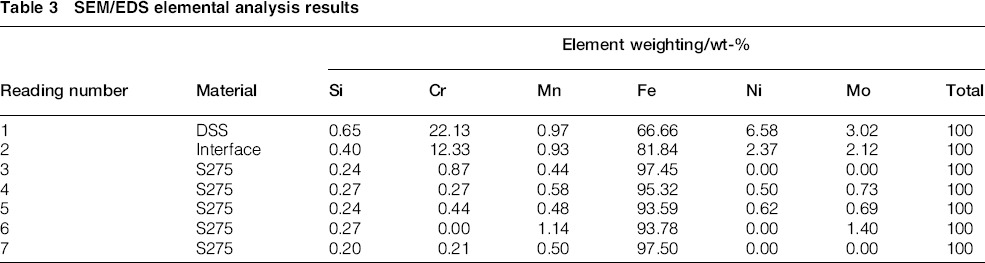
Cr, Ni and Mo were the three elements of interest from Table 3. Cr was found within the S275 material at multiple readings in the highlighted region of all samples, up to ∼80 μm from the dissimilar material interface. Ni was detected within the S275 at readings 4 and 5, ∼10 and 20 μm respectively from the material interface and over triple the wt-% value from the initial elemental analysis (Table 1). Mo was also detected within the S275 at readings 4, 5 and 6 up to ∼25 μm from the material interface. The Mo concentration was found to be substantially higher than the measured wt-% from the initial element analysis (Table 1).
The diffusion of such elements (C, Cr, Ni and Mo) indicates that the dissimilar materials were not just mechanically bonded but also chemically bonded, and these collectively contributed to the FSW bond integrity.
Mechanical property assessment
Transverse tensile testing
All three of the tested specimens fractured in the S275 steel PM, far from the weld itself and in a ductile manner with notable necking. This confirms that the weld is stronger than the S275 steel, the weaker of the two materials, as extensively reported elsewhere.8, 18 The measured YS as 0.2% proof stress was 335 MPa with a UTS of 451 MPa.
Fatigue testing
The four tests at the 70% stress range were terminated at 2.5 × 10⁶ cycles before fracture occurred, as were three of the four specimens tested at the 80% stress range and one specimen tested at the 90% stress range. This run-out point was chosen as it demonstrated that the weld could withstand the load levels applied while still reaching high cycle fatigue life.
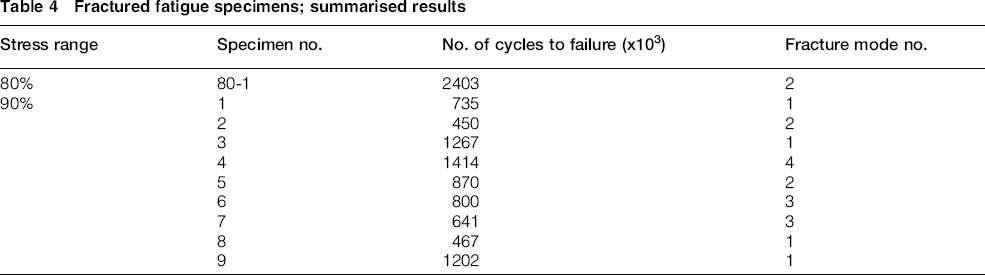
Table 4 summarises the results for the 10 specimens that did fracture, with Fig. 7 displaying the S–N (stress–life) data points plotted in double logarithmic scale. This same figure features results typical of a low alloy steel FSW joint produced at welding speeds of 250 mm min− 1 and 300 rev min− 1, and tested at 90% of YS. 36 Although the welding speeds differed, testing at 90% of YS in both cases makes such a comparison possible. This comparison highlights the similarities in fatigue life for each joint at the same stress range, with the dissimilar joint producing less scatter. This figure is then followed by a description of each fracture mode.
Fractured fatigue specimens; summarised results
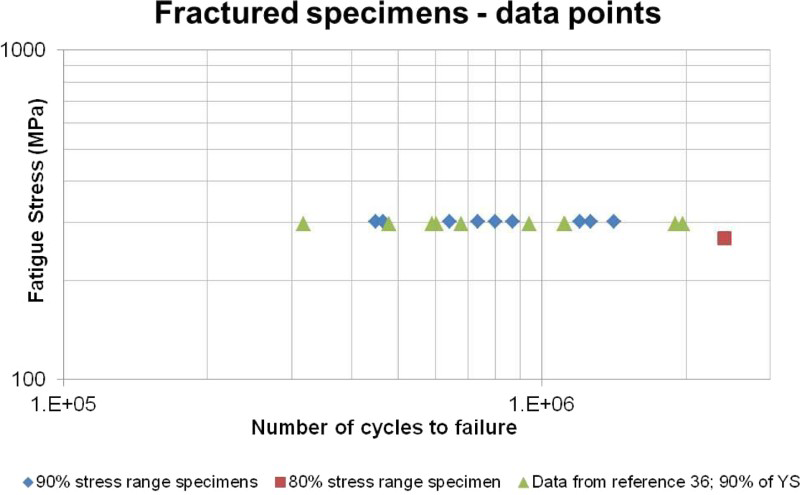
S–N data plot for fractured fatigue test specimens
The fractured specimen tested at the 80% stress range had a high fatigue life, 2.4 × 10⁶ cycles. The nine fractured specimens tested at the 90% stress range exhibited fatigue life ranging from 4.5 × 10⁵ to 1.4 × 10⁶ cycles, with a mean value of 8.7 × 10⁵ cycles. No correlation was found linking fatigue life to the manner in which the specimens fractured.
Mode no. 1 describes a fracture that initiated at a discontinuity in the weld's top surface (non-metallic inclusions) within the outer TMAZ of the S275 (Fig. 3b) and propagated straight through the specimen thickness, mainly through the PM (Fig. 8a and b). Three of the specimens tested at the 90% stress range fractured according to this fracture mode (no. 1). The fracture surface (Fig. 8a) clearly illustrates how the specimens fractured, demonstrating the typical fatigue semicircular pattern.
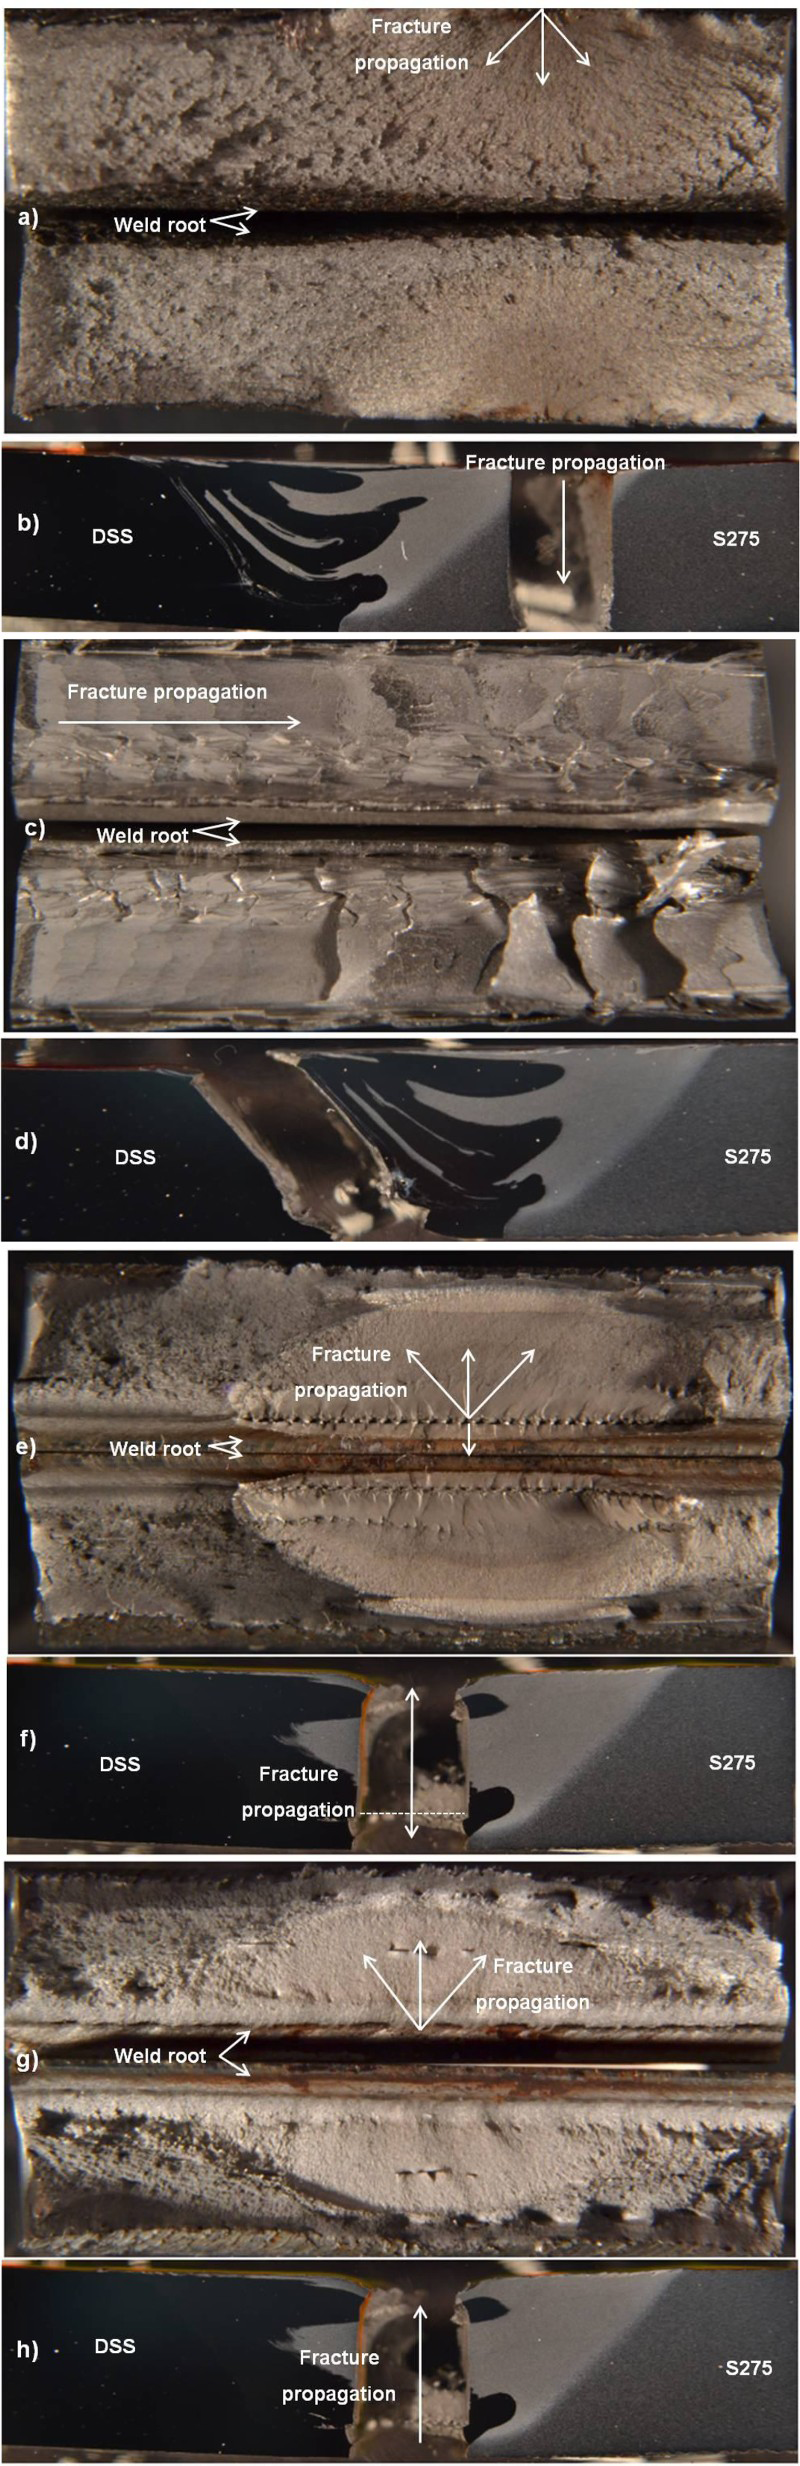
Fracture face and weld profile fracture path respectively for each fracture mode: a,b mode no. 1; c,d mode no. 2; e,f mode no. 3; g,h mode no. 4
Mode no. 2 describes fracture initiation at the thin layers of S275 within the DSS outer TMAZ (Fig. 8d) and propagation across the specimen's width (Fig. 8c), following the dissimilar material interface across the entire specimen width, a plane of weakness. One specimen tested at the 80% stress range and two of the specimens tested at the 90% stress range fractured according to mode no. 2.
Mode no. 3 defines fracture as initiation from the intermittent voids (Fig. 4a, c and d) and propagation to both the WRF and the top surface with straight line propagation through the centre of the weld (Fig. 8e and f). The fracture did not deviate from its straight line path and bisected the interlinking material fingers; no attempt was made to follow the dissimilar material interface. Two of the 90% stress range specimens fractured according to mode no. 3. These flaws could be addressed through process optimisation.
Mode no. 4 is fracture initiation from the WRF and propagation in a straight line through the centre of the weld to the top surface (Fig. 8g and h). Only one of the specimens tested at the 90% stress range fractured according to mode no. 4, which was surprising due to the WRF, ∼10% of specimen thickness (Fig. 3d).
Conclusions
FSW of 2205 grade DSS to low alloy structural steel grade S275 is feasible. This study demonstrates the extensive material mix across the weld centreline for both materials, especially the structural steel, and the positive mechanical property results, in particular the fatigue life at such high stress ranges. Several key conclusions are highlighted:
Fatigue fracture modes were unpredictable and varied, and did not occur for any of the 70% strength range specimens. Only one specimen tested at the 80% stress range fractured. Nine of the 10 specimens tested at the 90% stress range fractured, exhibiting fatigue life values between 4.5 × 10⁵ and 1.4 × 10⁶ cycles. The layers of S275 material within the outer TMAZ of the DSS were detrimental in a number of the 90% stress range fatigue tests. The hardness map identified significant variations in hardness at the region of heterogeneous microstructure (root cause of the failures). The complex microstructure within the DSS at and near the tool pin tip during the FSW process exhibited features such as poor mixing and intermittent voids. These were confirmed to have had a negative impact on fatigue life at the highest stress range (voids causing fracture at 6.4 × 10⁵ and 8 × 10⁵ cycles). SEM and EDS work identified chemical bonding between the dissimilar materials, with Cr, Ni and Mo being diffused across the dissimilar material interface from the DSS to the S275. Cr, Ni and Mo diffusion was greatest at the dissimilar material interface furthest into the DSS (AD side) and non-existent for Ni and Mo within the S275 rich regions (RT side).
Footnotes
Acknowledgement
The authors gratefully acknowledge the financial support of the European Union, which has funded this work as part of the Collaborative Research Project HILDA (High Integrity Low Distortion Assembly) through the Seventh Framework Programme (SCP2-GA-2012-314534-HILDA).