
Abstract
An efficient energy management of a building requires optimum use of the light energy, which is strongly dependent on optical properties of used materials. In the lighting sector, aluminium is generally employed as substrate for the reflectors. Nowadays, new steel substrates combining good corrosion resistance and flexibility are developed to answer the growing need of this market. Specific requirements for optical applications are a high reflectivity (total reflectivity >82%), a high superficial hardness and durability and also a suitable formability. The sol–gel layer is used in this particular application for its levelling properties before depositing of the reflective layer and good barrier properties to avoid contact between the metallic layers. The corrosion protection and the barrier properties of the sol–gel layer are investigated as a function of the thickness. The protection conferred by the sol–gel layer on stainless steel substrate is studied by the electrochemical measurements in a sodium chloride solution (electrochemical impedance spectroscopy and polarisation curves). The stress generated in the layer is determined versus temperature, humidity and hygrothermal conditions.
Introduction
An efficient energy management of a building requires optimum use of the light energy, which is strongly dependent on optical properties of used materials. In the lighting sector, aluminium is generally employed as substrate for the reflectors. Nowadays, new steel substrates combining good corrosion resistance and flexibility are developed to answer the growing need of this market. Specific requirements for optical applications are a high reflectivity (total reflectivity >82%), a high superficial hardness, durability and also a suitable formability.
The corrosion behaviour of sol–gel coating deposited on metallic substrate was strongly studied during the recent years1 – 19 and particularly on stainless steel.1 – 7 The classical sol–gel principle is the creation of a solid oxide network by progressive reactions (hydrolysis and condensation) of a molecular precursor in a liquid medium.19 – 21 Indeed, sol–gel coatings are formed from a colloid by evaporation of the liquid phase. Sol–gel based on silica precursor has very good chemical stability and provides an effective protection for steel substrate. An improvement in oxidation and acidic corrosion resistance of metals was shown by the use of silica sol–gel coating.3,6 This is due to its high thermal and chemical resistances. Inorganic oxide coatings are very effective against corrosion for short time, but the presence of micropore cracks and areas with low cross-link density limits the long term corrosion resistance.
A lot of studies are focused on the drying of sol–gel process and on the solvent evaporation step to avoid cracking and to control the pore structure.22 – 31 The main reason of this cracking or porosity is linked to the capillary pressure within the gel during drying. Indeed, some stress caused by the existence of a meniscus at the liquid/vapour interface appears and generates a differential capillary pressure. Then, the sol–gel network shrinks until it becomes stiff and resists to the stress imposed by capillary pressure. After that, the interface between the liquid and vapour withdraws itself into the gel structure and disappears when the drying is completed. Damages are the result of the pressure gradient in the network. The biggest pressure gradient appears with the highest evaporation rates, and therefore, the first solution to avoid any cracking is to dry slowly the coating. To suppress the liquid/vapour interface, some scientists treat gel in autoclave under supercritical conditions.25 Another approach is to use some drying control chemical additives; the low surface tension of this additives reduces the capillary tension.23,24
One approach to obtain crack free and dense sol–gel coating is to synthesise organic–inorganic hybrid coatings. A lot of workers try to form hybrid sol–gel coatings by the introduction of organic components in the inorganic sol–gel solution.5,8,9,13,30 – 36 The main advantage of hybrid coating is the combination of properties obtained from the inorganic and organic components. Latella et al.34 studied the cracking and decohesion of sol–gel hybrid coating on metallic substrates. They show that the modification of an inorganic coating by the organic substituent induces a quasi-plastic response and an improvement of adhesion compared to classical inorganic coatings. Some studies emphasised good corrosion protection behaviour of hybrid coatings on different metals.9,34
The schematic representation of the system investigated in the present work is shown in Fig. 1.
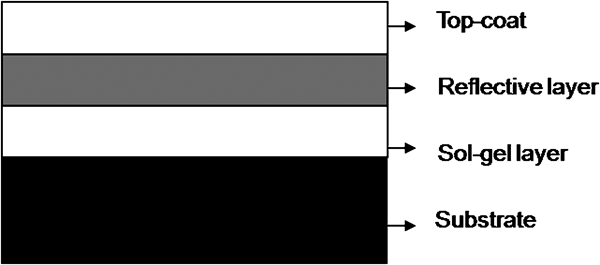
Investigated reflective system
This study concerns only the performances of the hybrid organic–inorganic sol–gel layer deposited on the stainless steel substrate. The role of this layer is essential and can be described in terms of levelling and barrier properties. Indeed, the optical properties of the system are strongly dependent on the roughness of the substrate, and the barrier properties must be as high as possible in order to avoid any contact between the substrate and the reflective layer. Moreover, this protection has to be stable with time in aggressive climatic conditions. A metallic contact between the substrate and the reflective layer due to layer failure of the sol–gel film could alter and destroy the reflective properties of the system. The sol–gel layer must also improve pitting corrosion resistance of the stainless steel (known to be sensitive in chloride media) and avoid delamination. Another parameter is the aptitude of the coating to forming. Indeed, the layer must follow the substrate during deformation after application and drying.
In this paper, the barrier properties of the sol–gel layer are investigated by electrochemical measurements in a sodium chloride solution [electrochemical impedance spectroscopy (EIS) and polarisation curves]. Different thickness ranges of the sol–gel layer were tested to evaluate the influence in terms of corrosion protection. For polarisation curves, the effect of the sol–gel layer on the pitting corrosion resistance for thicknesses <1 μm was considered. This technique is not valid for important barrier coatings. The barrier properties and the stress generation were evaluated on layers thicker than 1 μm by EIS and stressmeter respectively.
As explained before, the sol–gel layer is known to be stiff and sensitive to cracking, so it is very important to evaluate the influence of real climatic conditions on the generated stress in the coating. In this work, the stress is determined using a technique based on the cantilever method.37 – 40 The influences of temperature, relative humidity (RH) and hygrothermal cycles are studied.
Experimental
Material and sample preparation
The sol–gel used for all measurements is a commercially available product named Nanoxid SLS-UV supplied by Nanoxid (Liers, Belgium). Nanoxid SLS-UV is an organic–inorganic hybrid sol–gel coating based on silicon precursor. This sol–gel combines hardness and transparency. The investigated substrate is a stainless steel grade 304 with a bright finishing supplied by ArcelorMittal (Liege, Belgium). Before the sol–gel application, the substrate was degreased with ethanol. The sol–gel was applied using a roll coater. The distance between the rollers determines the thickness of the layer. After application, samples were cured at 200°C for 15 min.
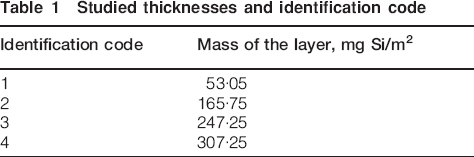
The thickness of the sol–gel layer was determined via fluorescence X (currently used in industrial sector) in all thickness ranges and glow discharge optical emission spectroscopy (GDOES) for layer thicknesses superior to 1 μm. The fluorescence X analysis was carried out using a Bruker AXS S4 Pioneer X-ray fluorescence equipment (Bruker AXS, Karlsruhe, Germany) with a rhodium tube. This technique is based on the excitation by bombarding with high energy X-rays of the analysed material. The material emits characteristic fluorescent X-ray. This is widely used for elemental and chemical analysis. In this case, the thickness is represented by the Si weight by unit area. The studied thicknesses determined by fluorescence X are shown in Table 1. The GDOES analysis was carried out using a JY RF-GD PROFILER HR instrument, manufactured by HORIBA Jobin-Yvon (Longjumeau, France). The instrument is equipped with a standard 4 mm diameter anode, a polychromator with 28 acquiring channels and a Quantum XP software. The source conditions, employed for the analysis, were Ar pressure of 650 Pa and applied power of 35 W. All results shown were obtained with the same source conditions and with the same calibration method. The calibration was performed with 31 samples selected among setting up sample and certified reference material.41 Table 2
Studied thicknesses and identification code
Coating thicknesses determined from capacitance values, by fluorescence X and by GDOES*
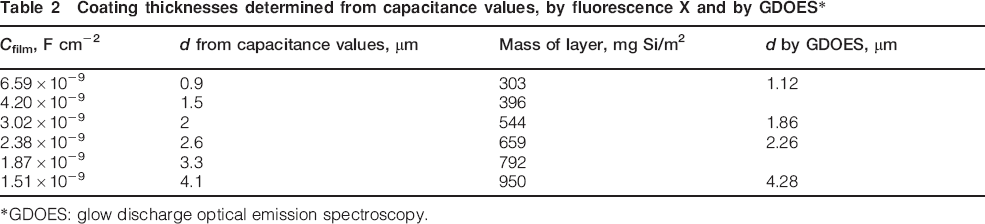
*GDOES: glow discharge optical emission spectroscopy.
For the stress measurements, the sol–gel was applied by a bare coater with humid coating thickness of 30 μm on calibrated stainless steel substrates (282×12·6×0·1 mm) degreased with ethanol. After application, samples were cured at 250°C for 3 min, and the dried thickness of sol–gel determined by GDOES is measured accurately and is ∼2·5 μm for stress determination.
Testing methods
Electrochemical measurements
In this study, polarisation curves and EIS measurements were carried out on uncoated and coated stainless steel samples. A conventional three-electrode cell was used. The working electrode was the investigated sample. The counter electrode was a platinum plate, and all potentials were measured with respect to an Ag/AgCl reference electrode [197 mV(SHE)]. In order to minimise external interference on the system, the cell was placed in a Faraday cage. The electrolytic solution was 0·5M NaCl, and the immersed areas were 4·5 and 7·07 cm2 for the polarisation curves and for the EIS measurements respectively. The impedance measurements were performed over frequencies ranging from 100 kHz to 10 mHz using an amplitude signal voltage of 20 mV. The anodic potentiodynamic polarisation curves were collected after an initial delay of 15 min. The potential was scanned from the open circuit potential to 1·3 V(Ag/AgCl) (anodic polarisation) at a scan rate of 10 mV min−1. The polarisation curves were obtained using an EG&G 273A potentiostat (EG&G Princeton Applied Research, Oak Ridge, TN, USA) computer controlled using Softcorr software. The impedance spectra were obtained using an Ametek Parstat 2273 (Ametek, Inc., Paoli, PA, USA) controlled by Powersuite software. All of the measurements were repeated three times.
Stress measurements
The method used to measure the stress is based on the works by Perera and Schutyser37 – 40 and Romano et al.,42 which is the cantilever method. The principle of this method is based on the fact that, for a coating under stress applied on a substrate, the coated substrate will deflect in the direction that relieves the stress. The mathematical equation proposed in the literature to calculate the stress is as follows
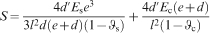
To measure the deflection in the middle of the substrate, a commercial equipment, the CoRI Stressmeter, was used. This apparatus can measure the deflection from −40 to ∼200°C under various RHs. For each measurement, the stress of an uncoated plate, used as reference, was always subtracted from data obtained with a coated plate, and the measurements were repeated three times.
Results and discussion
Electrochemical measurements
Potentiodynamic polarisation curves
Figure 2 shows the anodic polarisation curves obtained on uncoated and coated stainless steels with Nanoxid sol–gel for various thicknesses.
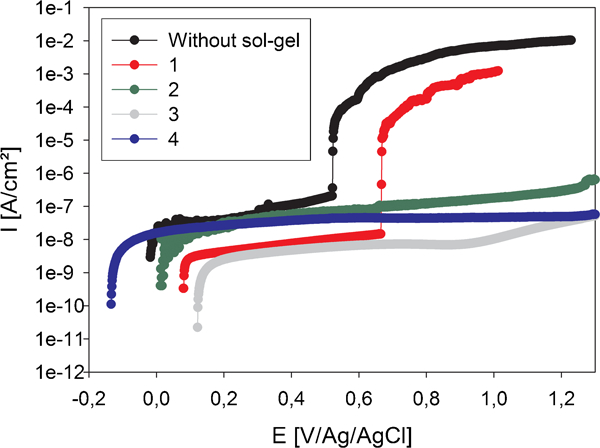
Anodic polarisation curves (10 mV min−1 and 0·5M NaCl): uncoated stainless steel and coated stainless steel with different thicknesses of sol–gel (Table 1)
Stainless steel is a passive metal, and although it contains chromium and nickel, it remains sensitive to pitting corrosion. The efficiency due to the barrier properties of the sol–gel layer should raise the pitting potential and thus lead to an increase in the substrate's pitting resistance. The anodic polarisations are used to determine the pitting corrosion potential43 – 48 and to characterise the influence of sol–gel coating on this parameter.
The Nanoxid layer strongly increases the pitting potential. Indeed, while no pitting is observed for thick sol–gel coating, the stainless steel without treatment shows a pitting potential of +0·5 V(Ag/AgCl). The thickness of the layer is an important parameter. The thicker the sol–gel layer; the higher the pitting potential. Moreover, for the highest thicknesses investigated, no pitting is observed. Indeed, the passive region spreads towards higher potentials than the potential corresponding to water oxidation


Electrochemical impedance spectroscopy: Immersion test
The EIS is a non-destructive technique that allows characterising the corrosion performance of coated and uncoated systems. Indeed, this technique gives some information about barrier properties, water uptake of a coating and corrosion at metal/coating interface. The low frequency modulus takes into account all resistances of the system as pore resistance, charge transfer resistance and electrolytic solution resistance. Therefore, this parameter gives an idea of the global resistance of the system against corrosion. The higher the low frequency modulus, the higher the corrosion resistance. In general, the interpretation of the impedance spectra gives also information about the coating capacitance and about the double layer capacitance. Capacitance values give information about the water uptake for a barrier coating and about the wet area for the double layer capacitance.
The evolution of modulus and phase Bode plots with immersion time in NaCl solution for uncoated stainless steel is given in Fig. 3.
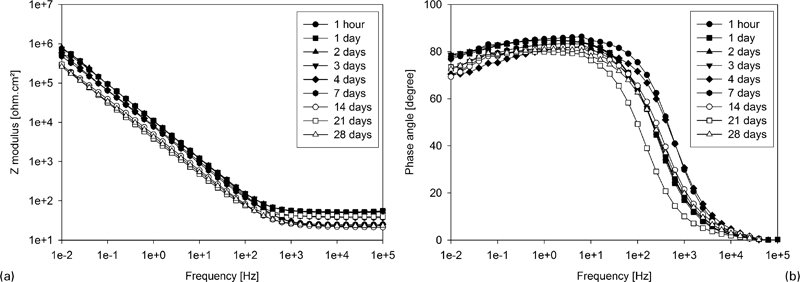
a Bode modulus diagram and b Bode phase diagrams of uncoated stainless steel for different immersion times in 0·5M NaCl solution
The electrochemical behaviour of the system can be interpreted using an equivalent circuit consisting of one parallel resistor–capacitor circuit in the experimental frequencies ranging up to 28 days of immersion. The behaviour at low frequencies corresponds to a pure capacitive behaviour, which can be associated to the double layer capacitance of the stainless steel at the electrolyte/metallic substrate interface.
By fitting the classical EIS spectra with the electrical equivalent circuit shown in Fig. 4, where R s is the electrolytic solution resistance, C dl is the double layer capacitance and R p is the polarisation resistance,44,46,48,49 a double layer capacitance of ∼1·5×10−5 F cm−2 is obtained.
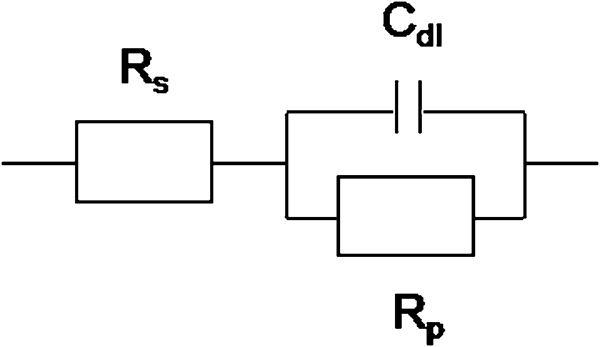
Electric equivalent circuit used for stainless steel
The capacitance values determined from impedance at 1 Hz give the same results.
The impedance diagrams obtained for the sol–gel coated samples are shown in Fig. 5.
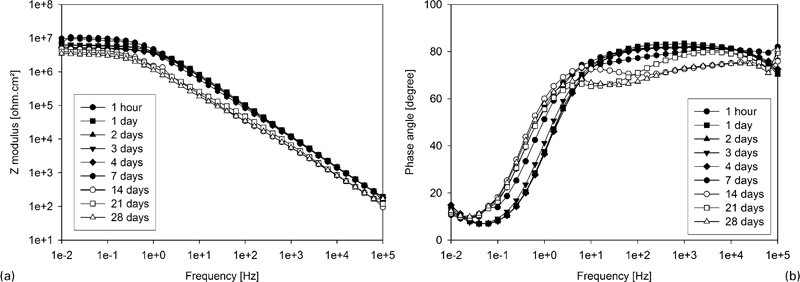
a Bode modulus diagram and b Bode phase diagram of coated stainless steel for different immersion times in 0·5M NaCl solution (thickness of Nanoxid layer: 165·75 mg m−2)
Low frequency modulus is higher for the coated samples (∼107 Ω cm2) compared to that for the uncoated ones (∼106 Ω cm2). This value decreases only slightly over time, which means that the sol–gel coating has good barrier properties even after 28 days of immersion in the aggressive solution. At high frequencies, a capacitive behaviour is observed; this behaviour corresponds to the sol–gel coating capacitance.
The coating capacitance was determined not only by calculation at 1·584 kHz but also by fitting the EIS spectra with the electrical equivalent circuit in Fig. 6.
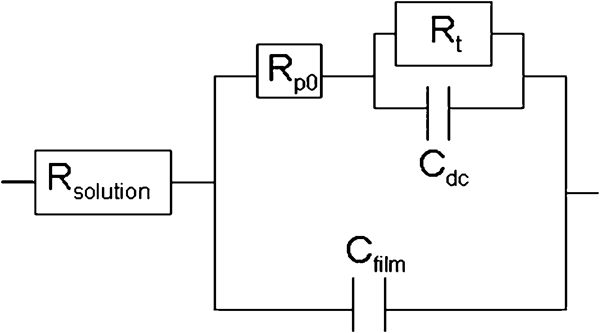
Electrical equivalent circuit for degraded coating
This equivalent circuit is classically used for the interpretation of organic coating properties48 – 52 and is representative of the behaviour observed by sol–gel coating protection. The usual interpretation of the impedance diagrams is the following: the high frequency part is related to the coating, while the low frequency part corresponds to the reactions occurring on the metal through defects and pores in the coating. In this circuit, C film is the sol–gel coating capacitance, R t is the charge transfer resistance and R po is the pores resistance. The coating capacitance values obtained by these two methods gave the same results.
Figure 7 gives some values of the coating capacitance versus immersion time for two thicknesses of sol–gel layer (obtained by calculation at 1·584 kHz).
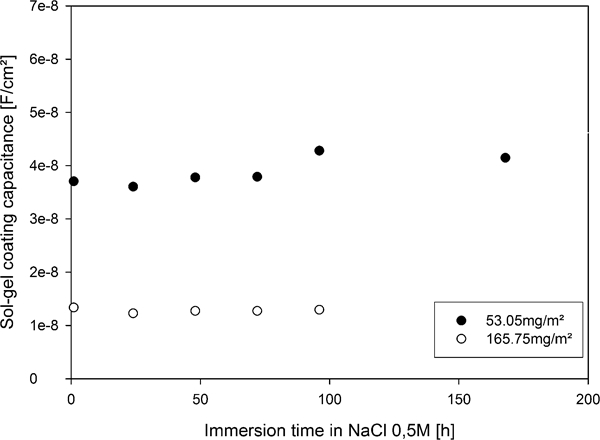
Evolution of coating capacitance with immersion time in 0·5M NaCl solution for two thicknesses of sol–gel layer
The capacitance is smaller for the layers with higher thicknesses. For both systems, the capacitance remains constant with time, indicating that the water uptake does not increase with long immersion time.
The thickness of the sol–gel layer was determined using the film capacitance, given by the following equation

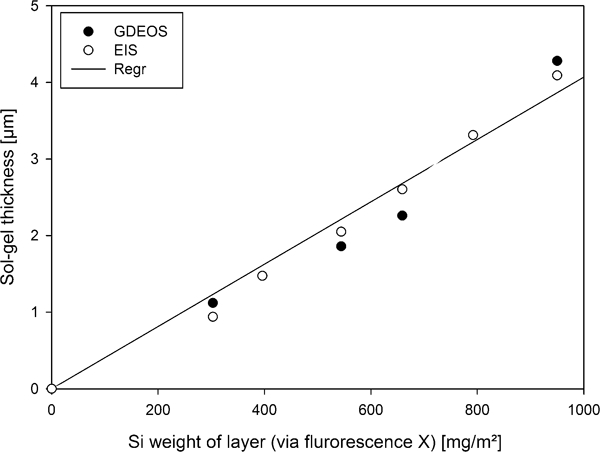
Sol–gel thickness as function of Si weight of layer
Values determined by the capacitance measurements are in agreement with the values determined by GDOES (Table 2). Moreover, a linear relation is observed between the value obtained via EIS and GDOES and values resulting from the fluorescence X analysis. Indeed, 400 mg m−2 of Si corresponds to 1·6 μm. This linearity and the good correlation with the GDOES measurements show that the EIS is a good tool to determine the sol–gel thickness for a sample showing good barrier properties.
Stress measurements
The three main causes of stress development in a coating are the film formation and the variations in temperature and in RH.37 – 42,54 The total stress can be defined as follows

Influence of temperature
In order to determine the influence of temperature on the generated stress in the Nanoxid coating after curing, the sample was placed in the stressmeter and submitted to the following thermal conditions: from 30 to 130°C, from 130 to 50°C, from 50 to 130°C and from 130 to 50°C, with a slope of 1 °C min−1. During the measurement, the RH was very low (<10%) and constant during the thermal cycle, so only the thermal stress component changes. The internal stress of the sol–gel layer depends on temperature (Fig. 9).

Stress as function of temperature for Nanoxid coated system
The initial stress value at 40°C is relatively high (∼15 MPa) due to the tridimensional network formation during the curing of the sol–gel film, which induces a tensile stress (positive sign). This value is quite high compared to a classical organic coating, which is in this case <5 MPa.54 This high value can be explained by the formation of a hybrid inorganic–organic tridimensional network and by the thin thickness of the sol–gel layer. The generated stress decreases linearly with the temperature, which is characteristic of a material in glassy state.55 The T g of the layer is higher than 130°C and is not reached during the experimental procedure. The T g value corresponds to a complete relaxation of the stresses. After T g, the stresses should remain constant with increasing temperature.
Nevertheless, the sol–gel layer shows an irreversible behaviour during the first thermal cycle. The reverse curve is not superposed to the forward curve and shows a hysteresis after one cycle. This tendency means that the tridimensional network is still sensitive to chemical or physical changes after curing when submitted to significant thermal variation. The reticulation of the sol–gel may be not complete or there is an evaporation of residual solvent. This result seems to be confirmed by performing a second thermal cycle: the forward and the reverse curves became superposed showing that the structure does not change anymore and that generated stresses do not induce the cracking and failure in the network. This relative good flexibility of the layer can be attributed to the organic contribution.
Influence of humidity
In order to determine the influence of humidity on the generated stress in Nanoxid coating, the sample was placed in the stress meter at 25°C, and a humidity cycle composed of four steps was performed. The humidity changes from 30 to 85%RH during 30 min, from 85 to 30% during 30 min, from 30 to 10% during 30 min and finally from 10 to 30% for 30 min, as shown in Fig. 10. The temperature is constant during the measurement, so only the hygroscopic stress component changes.
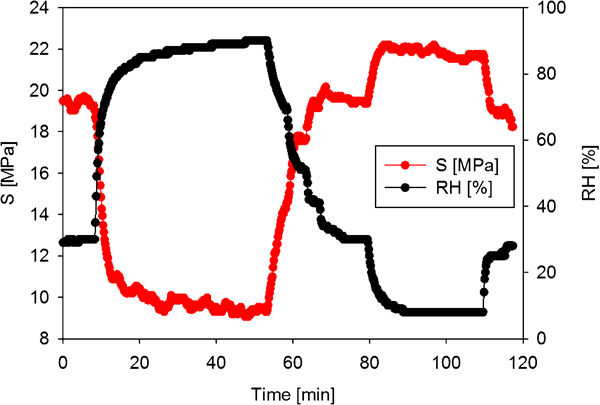
Influence of humidity on stress at 25°C for Nanoxid coated system
During the high humidity period, water adsorption occurs and induces stress relaxation. On the opposite, during the low humidity period, the water desorption generates a tensile stress in the coating. The stress gap between the high and low RH is ∼12 MPa, which is very important. The relaxation and the formation of stress during a humidity cycle are very fast and correspond to reversible phenomena. These important changes of the generated stress do not induce failure or cracking of the sol–gel. The measured stress is the same at the beginning and at the end of the hygroscopic cycle in the same humidity conditions.
Influence of hygrothermal cycles
To evaluate the stress development in the coating during aging in real conditions, the samples are submitted to zero, one, two, four and 13 hygrothermal cycles. Each cycle is composed of a period of 20 h at 55°C–84%RH followed by a period of 4 h at 23°C–40%RH before stress measurement. After each hygrothermal cycle, the stress of the coating is measured at 23°C and 50%. Figure 11 shows the evolution of stress as a function of the number of hygrothermal cycles.
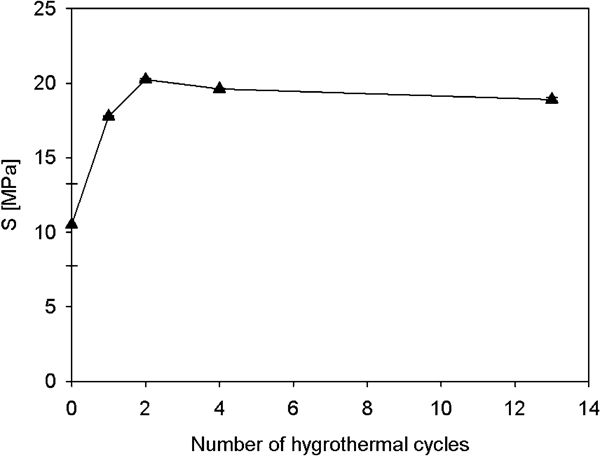
Stress (at 23°C–50%RH) as function of number of hygrothermal cycles
The initial value of the stress is 13·2 MPa and increases significantly during the two first cycles to reach 20·2 MPa. After four cycles, the stress is stabilised. Therefore, the first hygrothermal cycle seems to mainly provoke physical and chemical irreversible changes in the sol–gel layer.
To evaluate the evolution of the sensitivity of the coating at humidity after hygrothermal cycle, humidity cycle, as mentioned in the section on ‘Influence of humidity’, was performed on a sample submitted to 13 hygrothermal cycles and compared with the behaviour of a sample without aging test (Fig. 12).
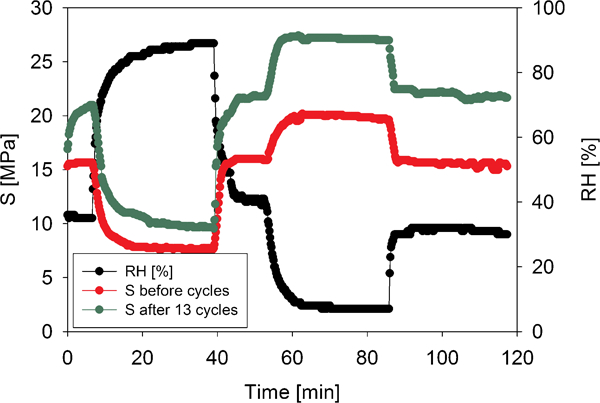
Influence of relative humidity (RH) on sample not aged and after 13 hygrothermal aging test
The gap between the high and low RH increases from 12 MPa for a system not aged to 17 MPa for a system submitted to 13 hygrothermal cycles. The water uptake and desorption are higher than for a layer not aged, but the layer behaviour during the humidity cycle is reversible at ambient temperature and does not induce failure or cracking in severe atmosphere conditions.
Conclusions
In the reflector investigated in this study, the sol–gel layer applied on the substrate has essential roles: corrosion protection, barrier and levelling properties. Different electrochemical tests were performed. Anodic polarisation curves were carried out to measure the pitting potential of coated and uncoated stainless steel. These curves show the important role of the thickness of the sol–gel layer. Indeed, the pitting potential increases with the thickness. A thickness of ∼0·7 μm allows avoiding the pitting corrosion by the formation of a thin barrier layer. The EIS confirms the good barrier properties and stability of the sol–gel layer during immersion. The analysis of spectra allowed the determination of the thickness of the sol–gel layer using the coating capacitance values. The climatic changes, such as temperature and humidity cycles, induced an important stress variation in the sol–gel layer. Indeed, an increase in temperature induces a decrease in stress, which is characteristic of a glassy state. Nevertheless, the sol–gel layer shows an irreversible behaviour during the first thermal cycle. This means that the tridimensional network is still sensitive to chemical or physical changes after curing. The hygroscopic test shows the reversible and quick behaviour of the sol–gel layer as a function of RH. After several hygrothermal aging cycles, the internal stress increases between zero and two cycles. This increase induces a higher sensitivity to humidity. Nevertheless, it is very important to note that all of these stresses do not provoke the failure and the cracking of the layer.
Footnotes
Acknowledgements
This work was supported by the Walloon Region (Belgium) within the framework of the Project (Plan de compétitivité MecaTech, Plan Marshall, Projet Mirage). The authors would like to thank A. Lanzutti, from University of Udine (Udine, Italy), for measurements of sol–gel thickness via GDOES.