
Abstract
Geochemical mapping of North and Central Madagascar was carried out using stream sediments at an average density of one sample per 11 km2. Over 50 elements were determined from some 13 300 stream sediments using a sample size fraction of <150 μm following hot aqua regia digestion. Partially extractable concentrations of six major elements and seven base metals reveal that the Andriamena ‘greenstone’ Belt of the Tsaratanana Complex is geochemically distinct from the other geological divisions within the Precambrian basement of central and northern Madagascar. In particular, this study has shown the detailed spatial distribution of anomalous concentrations of base metals which confirm known areas of chromite mineralisation within the Andriamena Belt. Base metal anomalies also occur in relation to Cretaceous and Neogene volcanic rocks, for example at Nosy Be, and mafic-ultramafic intrusions such as along the Maroala deformation zone. The distribution of anomalous Au in stream sediments showed good correspondence with known gold districts of central and northern Madagascar. Highest concentrations were measured in stream sediments from within the Ampasary-Mananjary (southern Androna-Mandritsara) and Andavakoera (northern margin of North Bemarivo) gold districts. The results of the stream sediment geochemistry show that these new data provide valuable information for current and future mineral exploration and environmental studies in Madagascar, at both regional and local scale.
Keywords
Introduction
Regional geochemical maps and data are considered to be a national asset for resource evaluation and environmental management (Johnson and Ander, 2008) and many national geochemical surveys have been undertaken at different scales and by using different sample media such as regolith (De Caritat et al., 2008), soils (Liao et al., 2007; Klassen, 2001), tills (Salminen and Tarvainen, 1995), stream sediments (Ali et al., 2006; Lombard et al., 1999; Johnson et al., 2005), stream waters (Johnson et al., 2005; Simpson et al., 1993) and plant material (Reimann et al., 2001). These analyses have been carried out for a variety of purposes with the common objective to distinguish geochemical signals from different sources, either of exploration or environmental interest, in the context of natural background variation (e.g. Klassen, 2001). The use of stream sediments in geochemical mapping is based on the observation that active sediment can provide an approximation of the chemical composition of materials derived from the catchment area upstream of the sampling site (Johnson et al., 2005). Therefore, stream sediment has been the preferred sample media for many regional geochemical mapping projects, e.g. in Asia (Cheng, 2007; Ujiie-Mikoshiba et al., 2006; Machali Muchsin et al., 1997), Africa (Lapworth et al., 2011; Key et al., 2004; British Geological Survey, 1999) and Europe (Johnson et al., 2005; Salminen et al., 2005; Reimann et al., 2002; British Geological Survey, 2000).
The work covered in this paper was undertaken as part of the Madagascar Geological Mapping Project carried out by a consortium consisting of the British Geological Survey (BGS), the United States Geological Survey (USGS) and local consultancy GLW Conseil (BGS–USGS–GLW) between 2005 and 2008. Geochemical mapping included the collection of stream sediment samples from low order streams for geochemical and mineralogical analysis and was carried out within three distinct project zones; zone A in northern Madagascar, covering an area of 72 000 km2 and zones B and D (North) of central Madagascar, covering 58 600 km2 and 8500 km2, respectively (Fig. 1).
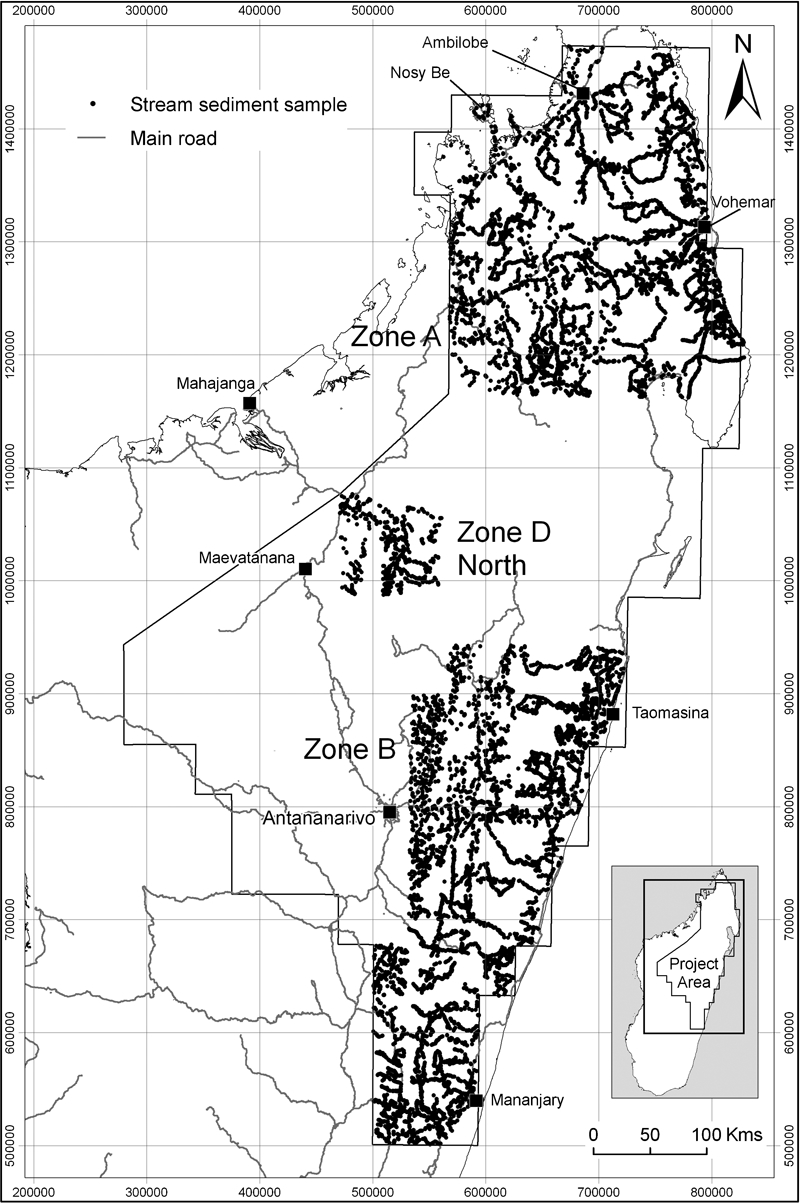
BGS–USGS–GLW project area in Madagascar and the distribution of stream sediment sample site locations (black dots) for which analytical data is available. Map projection: Madagascar Laborde Tan 1925
This paper describes the sampling procedures and methodologies used during the mapping campaign and discusses aqua regia extractable concentrations for a selection of major elements and base metals in stream sediments; an aim is to outline major geological divisions of the crystalline Precambrian basement of Madagascar. The authors will also give a brief insight into the distribution of Au anomalies and their relation to known gold deposits and districts.
Geological setting and mineralisation
The major geological domains within the BGS–USGS–GLW project area are shown in Fig. 2. The Precambrian basement of northern and east-central Madagascar comprises the Archaean to Palaeoproterozoic domains of Antongil, Masora and Antananarivo (Schofield et al., 2010) locally separated and overthrust by Neoproterozoic belts during the Neoproterozoic-Cambrian events in the East African Antarctic Orogen.
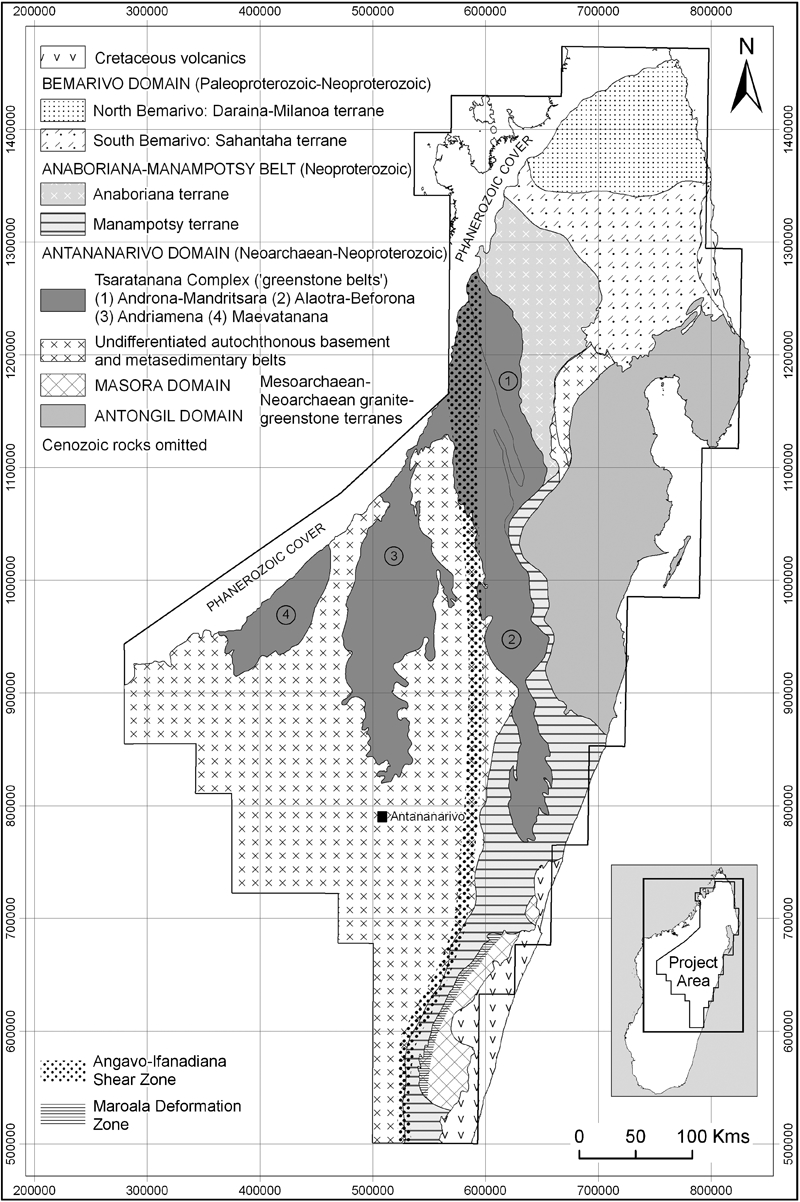
Map of the major geotectonic domains and terranes occurring within the BGS–USGS–GLW project area of central and northern Madagascar [after DeWaele et al. (2011)]. Map projection: Madagascar Laborde Tan 1925
The easternmost Antongil and Masora domains comprise tonalite-trondhjemite-granodiorite orthogneiss in excess of 3·1 Ga in age. The Antongil Domain includes Meso- and Neoarchaean supracrustal sequences (Tucker et al., 2011) and voluminous Neoarchaean plutonic rocks with two geochemically defined groups (Masoala Suite). It is host to chromitiferous ultramafic lenses and placer gold and platinoid occurrences. The Masora Domain includes volcano-sedimentary rocks with greenstone affinities (Vohilava Group) of presumed Archaean age. Unlike the Antongil Domain, it has a paucity of Neoarchean magmatic rocks and it was reworked during the mid-late Neoproterozoic, especially along the western marginal Maroala Deformation Zone (BGS–USGS–GLW, 2008; Fig. 2).
The central Antananarivo Domain comprises an autochthonous basement of Neoarchaean high-grade gneisses and meta-sedimentary rocks, the tectonically overlying Tsaratanana sheet dominated by Neoarchaean metamafic rocks, and numerous Neoproterozoic granitic and less common, more mafic intrusions. The Tsaratanana Complex is preserved as a number of infolded belts that have been described as greenstone belts (Fig. 2). They contain the principal chromite deposits, dispersed gold and base metal mineralisation and some beryl-columbite pegmatite fields. Palaeoproterozoic meta-sedimentary rocks tectonically overlie all three Archaean domains and locally host gold mineralisation. Mid-Neoproterozoic ultramafic to felsic plutonism of the Imorona-Itsindro Suite is widespread in the Masora and Antananarivo domains and is prospective for magmatic Cu–Ni and PGE mineralisation (BGS–USGS–GLW, 2008; Tucker et al. 2011).
The central Antananarivo and eastern Antongil-Masora domains are separated by the Neoproterozoic Anaboriana-Manampotsy Belt (BGS–USGS–GLW, 2008; Fig. 2) or Betsimisaraka Domain (Kröner et al., 2000; Tucker et al., 2011). The Manampotsy Complex comprises high metamorphic grade graphite-bearing meta-sedimentary rocks and metabasite to locally nickeliferous meta-ultramafite lenses. The northern Anaboriana Terrane is typified by amphibolite facies metamorphism and widespread anatexis of the Neoproterozoic sedimentary rocks (Bealanana Group). The magmatic rocks range from mid-Neoproterozoic subduction-related arc-type magmas to (sub-) alkaline types with a within-plate geochemistry (BGS–USGS–GLW, 2008; McMillan et al., 2003).
In the north of the island (Zone A) the broadly east–west trending Bemarivo Domain (Thomas et al., 2009) formed part of an Early to Mid-Neoproterozoic supracrustal magmatic arc that tectonically juxtaposes and overthrusts the amalgamated Antongil-Antananarivo domains and parts of the Anaboriana-Manampotsy Belt (BGS–USGS–GLW, 2008; Buchwaldt et al., 2003; Collins, 2006). There is a southern high grade meta-sedimentary region and a northern lower grade region of granite, migmatite, orthogneiss and supracrustal calc-alkaline volcanosedimentary rocks (Daraina, Milanoa and Betsiaka groups). These rocks have a juvenile island-arc geochemical signature and are host to gold and base metal occurrences, especially copper (BGS–USGS–GLW, 2008).
A major north–south trending Cambro-Ordovician curvilinear high strain zone, termed the Angavo-Ifanadiana Shear Zone (Fig. 2), is the final major tectonic feature of the East African Antarctic Orogen in Madagascar and has been a locus for more recent rifting.
The Precambrian basement is unconformably overlain in the northwest by Palaeozoic to Mesozoic sedimentary and mafic volcanic successions of the Karoo Supergroup (Phanerozoic Cover, Fig. 2) that pre-dates the rifting of Madagascar from Africa and is comparable to other Gondwanan sequences (De Wit, 2003). The unconformity is a site of epithermal gold, baryte and base metal mineralisation. The Karoo sediments may also contain stratabound Pb–Zn deposits, sedimentary Mn deposits, bedded baryte, phosphate, evaporite deposits and sandstone U deposits (Peters et al., 2003).
The East Coast hinterland is overlain by Cretaceous and lesser Neogene volcano-sedimentary rocks. The Cretaceous magmatism, associated with the break-up of Gondwana, gave rise to extrusive magmatism and emplacement of plutons and coast-parallel mafic dyke swarms (Coffin and Rabinowitz, 1988). Neogene volcanic and intrusive mafic to alkaline magmatic rocks mainly occur in the northwest coastal region. They exhibit geochemical features consistent with an enriched, mantle plume or sub-continental lithosphere source in contrast to the depleted mantle signature of the Cretaceous volcanic rocks. The Cenozoic igneous centres are associated with tin, rare earth elements and other base metal occurrences. They are also prospective for columbite-tantalite metals and uranium.
Materials and methods
Sample collection, preparation and analysis
Field sampling campaigns were predominantly carried out between May and November. The sample collection was supervised by staff from BGS and carried out with the assistance of local geology students and graduates. Sampling procedures are based on a simplified version of methodologies from the Geochemical Baseline Survey of the Environment Project of BGS (G-BASE; Johnson et al., 2005, 2008) and are summarised below.
The stream sediment sampling was a non-grid based survey and samples were collected from low order streams where the sediment was retrieved from the active part of the stream channel with a small spade or trenching tool. The material was then placed on a wooden sieve and screened through a 1 mm mesh into a fibreglass bowl. Up to one kilogram of this material (<1 mm) was then transferred into a Kraft bag. Panned concentrate samples were also routinely collected from streams with sufficient flow. Additionally to the 13 300 stream sediments, a total of 6800 panned heavy mineral concentrates were collected for mineralogical analysis at approximately every second drainage site; however, their results will not form part of this publication.
Stream sediment samples were air dried and then sieved to <150 μm, homogenised, coned and split into two subsamples. One subsample, labelled ‘A’ was used for analysis and the other subsample, labelled ‘B’, was archived.
A total of four replicate and reference material control samples were inserted in each analytical batch of a 100 samples prior to shipment to ACME laboratories for chemical analysis. Samples were analysed for a suite of 53 elements (Ag, Al, As, Au, B, Ba, Be, Bi, Ca, Cd, Ce, Co, Cr, Cs, Cu, Fe, Ga, Ge, Hf, Hg, In, K, La, Li, Mg, Mn, Mo, Na, Nb, Ni, P, Pb, Pd, Pt, Rb, Re, S, Sb, Sc, Se, Sn, Sr, Ta, Te, Th, Ti, Tl, U, V, W, Y, Zn and Zr) by inductively coupled plasma mass spectrometry and inductively coupled plasma atomic emission spectroscopy after aqua regia digestions, leaching 1 g of sample with 6 mL acid reagent (2–2–2 HCl, HNO3–H2SO4) at 95°C for 1 h and diluting to 20 mL. This geochemical analysis gives partial concentrations depending on the extractability of each element. Hence, elements bound up in silicate minerals and other resistant accessory and refractory minerals (e.g. wolframite, chromite, zircon or magnetite) may be under represented as a result of incomplete dissolution (Darnley et al., 1995). Therefore, if the text refers to element concentrations, these are aqua regia extractable concentrations.
To describe the geochemical signatures of the major geological domains and terranes (Fig. 2), results for the main mineral forming elements of aluminium (Al), calcium (Ca), iron (Fe), potassium (K), magnesium (Mg) and sodium (Na) and base metals cadmium (Cd), cobalt (Co), chromium (Cr), copper (Cu), nickel (Ni), lead (Pb) and zinc (Zn) as well as gold (Au), were selected.
Quality control
The quality of analytical data was assessed by collecting field duplicate samples and by inserting secondary internal reference materials for each batch of 100 samples. These were analysed blind by ACME. The performance of the three internal reference materials (S34B, S22B and S13B), which were used throughout the sampling programme, was assessed (Table 1). Most elements performed well overall, with less than 20% relative standard deviation (RSD) for standards that have significantly high concentrations and a general trend of poorer precision with decreasing standard concentration. A Shewhart plot shows 55 results for Au (mean of 2·1 ppb) in standard S24B across all the analytical batches (Fig. 3). The precision and accuracy of the results show no trend with time as well as a random distribution of results around the mean and within the analytical quality control limits (±3σ mean).
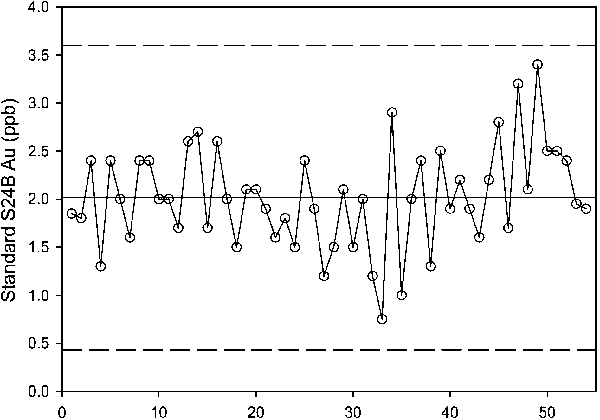
Shewhart plot for Au (ppb) in internal reference standard S24B. Dashed line shows control limits (mean ±3σ). Solid line shows the average value obtained across all the analytical batches
Quality control results for internal reference standards used in this study*
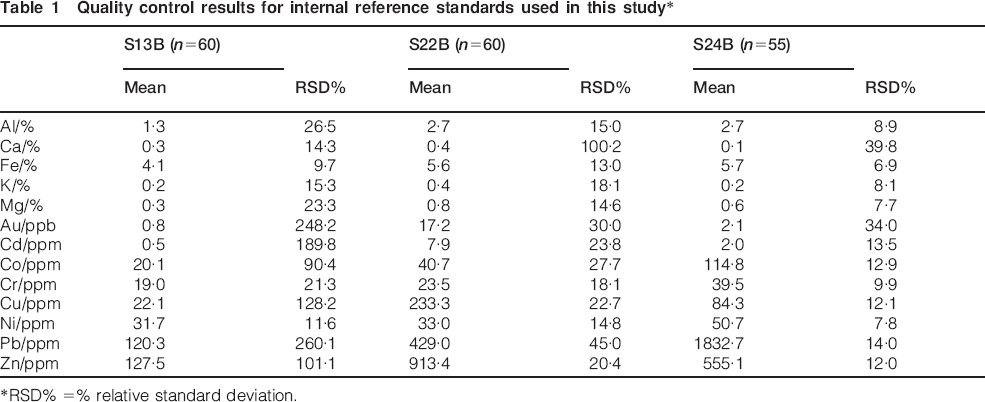
RSD% = % relative standard deviation.
Statistical and spatial analysis
Statistical analysis of the data was carried out with the software packages R (v2·8·1; R Development Core Team, 2008; Reimann et al., 2008). Mean concentrations were estimated using Kaplan-Meier (KM) and Maximum Likelihood Estimation (MLE) methods of the NADA package (Helsel, 2005) within the R software. For elements where there were <50% samples below the lower limit of detection (LLD), KM estimates were computed as this method does not depend on the assumption of a distributional shape. At 50 to 80% below the LLD, the Maximum Likelihood Estimation method was used after log transforming the data to approximate normality. Where over 80% of values were below LLD, the mean concentration was not estimated and only high sample percentiles (90th and 95th) were reported. R software was also used to calculate median values and selected percentiles for each element within each geological domain.
Box plots (Figs. 4 and 5) were also produced in R (v2·8·1) using the censored box plot function which shows each of the inter-quartile range (IQR, shown as the box), the median (horizontal line), the whiskers (±1·5×IQR), and the outliers (open circles for values greater or less than 1·5×IQR). The box plots are notched, with notches placed at 1·58×IQR/n1/2 on either side of the median, where n is the number of samples; this enables comparison of median values between geological domains. These notch positions represent 95% confidence bounds on the median and are not sensitive to the underlying sample distribution (Chambers et al., 1983). If the notches do not overlap there is strong evidence (p<0·05) that the medians are significantly different. The y axis is shown on a log scale because of the wide concentration range and outliers within the data sets.
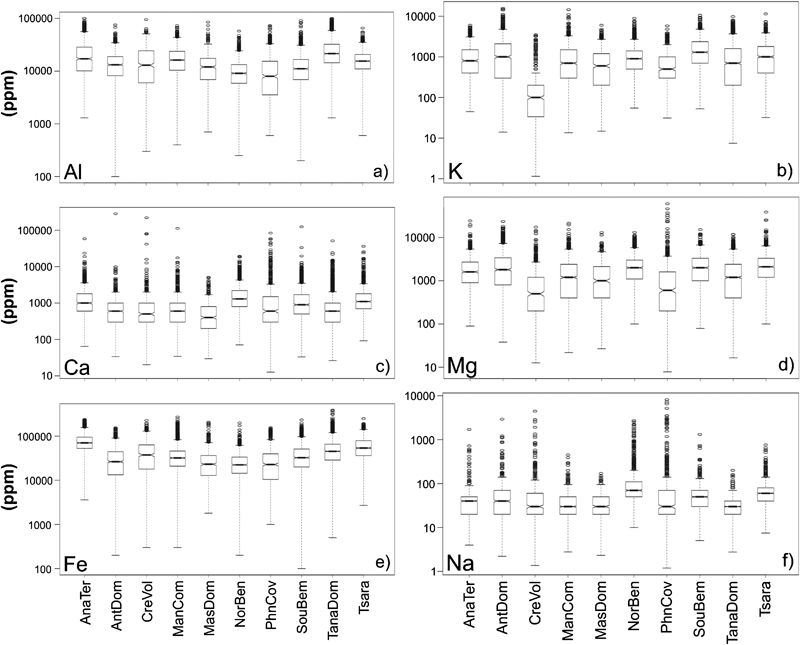
Box plots for elements a Al, b Ca, c Fe, d K, e Mg and f Na grouped by geological divisions: Anaboriana Terrane (AnaTer), Antongil Domain (AntDom), Cretaceous Volcanics (CreVol), Manampotsy Complex (ManCom), Masora Domain (MasDom), North Bemarivo Terrane (NorBem), Phanerozoic Cover (PhnCov), South Bemarivo Terrane (SouBem), Antananarivo Domain, undifferentiated basement unit (TanaDom) and Tsaratanana Complex (Tsara). Element concentrations (ppm) are shown on a log scale
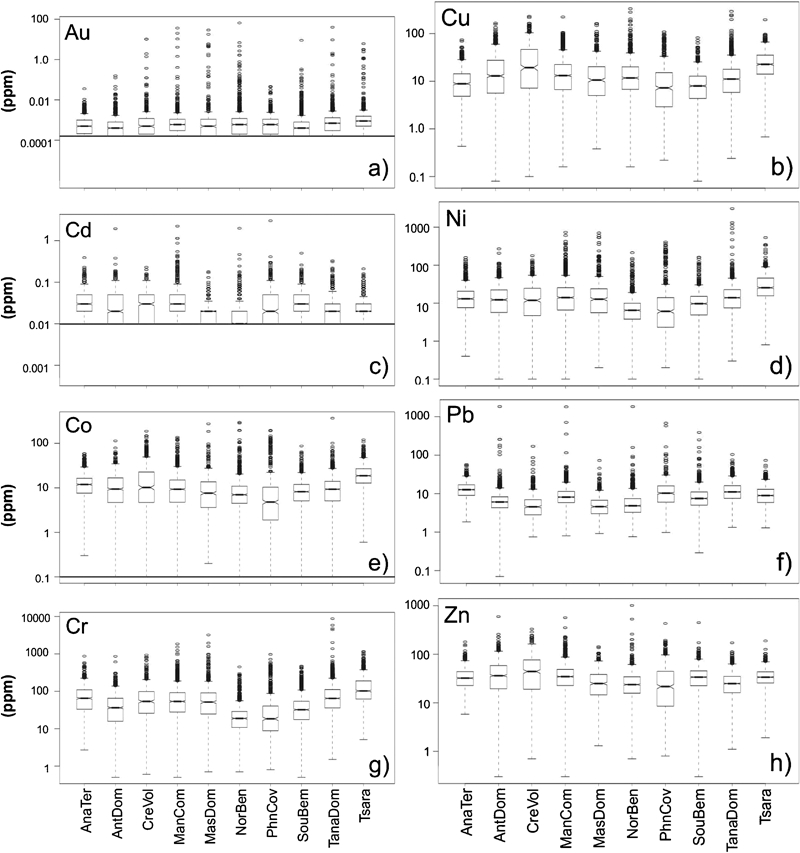
Box plots for elements a Au, b Cu, c Cd, d Ni, e Co, f Pb, g Cr, and h Zn grouped by geological divisions: Anaboriana Terrane (AnaTer), Antongil Domain (AntDom), Cretaceous Volcanics (CreVol), Manampotsy Complex (ManCom), Masora Domain (MasDom), North Bemarivo Terrane (NorBem), Phanerozoic Cover (PhnCov), South Bemarivo Terrane (SouBem), Antananarivo Domain, undifferentiated basement unit (TanaDom) and Tsaratanana Complex (Tsara). Element concentrations (ppm) are shown on a log scale. Horizontal lines show the LLD (ppm) where there is a significant proportion of samples below LLD: Au (0·0002), Cu (0·1), Cd (0·01), Ni (0·1), Co (0·1), Pb (0·1) and Cr (0·5)
The interpolated geochemical maps in Fig. 6 have been generated in ESRI ArcGIS v9·2 using the Inverse Distance Weighting methodology, applying a cell size of 2000 m and a fixed search radius of 10 000 m. This method was chosen as it is fast and easy to compute and one of the most frequently used tools adopted by geoscientists (Lu and Wong, 2008). Class intervals of the colour ramp correspond to the 25th, 50th, 75th, 90th, 95th, 97·5th, 99th and 99·9th percentile values.
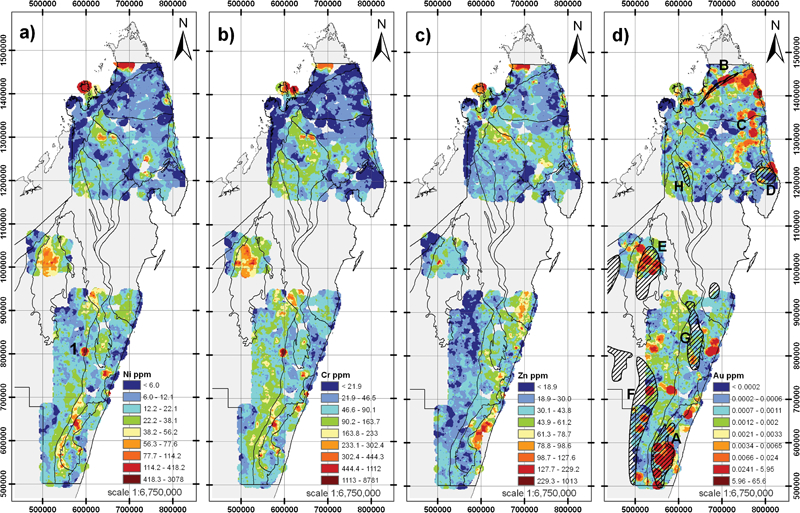
Interpolated geochemistry maps of a Ni, b Cr, c Zn and d Au with the geological line work as shown in Fig. 2. Figure 6d includes the major known gold districts within the project area, shown as hashed areas (A = Ampasary-Mananjary; B = Andavakoera; C = potential placer; D = Antalaha; E = Tsaratanana; F = Ambositra-Antananarivo; G = Beforona; H = Bas-Androna) [based on BGS–USGS–GLW (2008)]. Colour ramps correspond to percentile classes 25th, 50th, 75th, 90th, 95th, 97·5th, 99th and 99·9th. Map projection: Madagascar Laborde Tan 1925
Results
The result section presents analytical data for 6330 stream sediment samples collected in zone A, 6359 in zone B and 668 in zone D North (Fig. 1) in relation to the main geological terranes and domains of Madagascar; and the distribution of sample sites across the BGS–USGS–GLW project area (Fig. 1). The average sample density is one sample per 9 km2 in zone B, one per 11 km2 in zone A and one per 13 km2 in zone D (North). Apparent linear features are relating to sampling teams working either along vehicle accessible major and minor roads or to foot or river traverses across the more remote and inaccessible parts. In latter scenario, catchments of very remote areas were covered by sampling streams near the confluence with main rivers or large drainage systems.
Geochemical signatures of the main mineral forming elements
The most abundant mineral and rock forming elements are Al, Ca, Fe, K, Mg and Na. Their concentration range, including outliers, are shown as series of notched box plots grouped by the 10 geological divisions described above, allowing direct comparison of aqua regia extractable concentrations across the geological divisions. Descriptive statistics are listed including the most dominant lithologies that occur within the 10 major geological domains and terranes (Table 2).
Descriptive statistics for Al, Ca, Fe, K and Mg grouped by main geological divisions and their main lithologies*
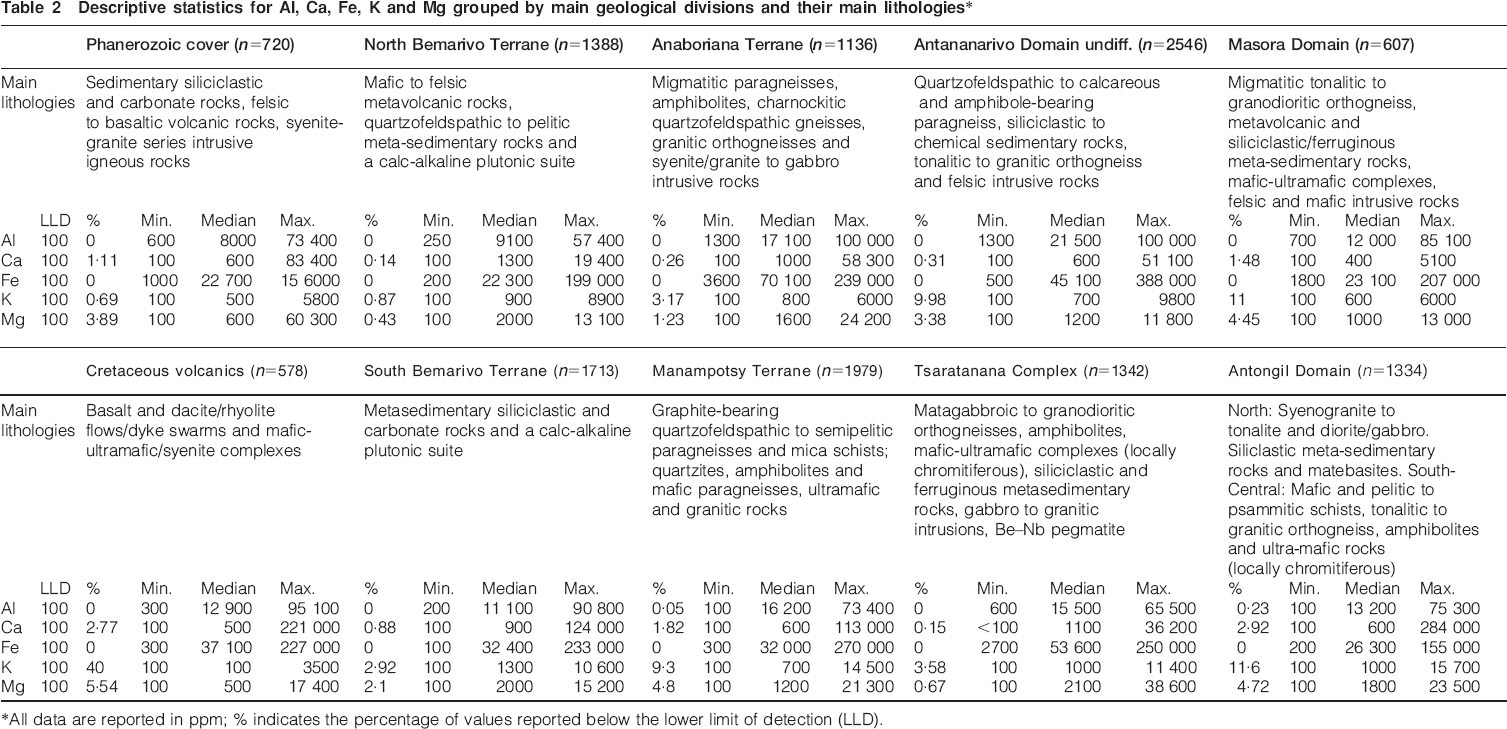
All data are reported in ppm; % indicates the percentage of values reported below the lower limit of detection (LLD).
The lowest median concentrations for most of the major elements were measured in sediment samples collected within the Phanerozoic cover sequence which crops out along the western margins of the basement (Fig. 2). Although, a large number of anomalous analyses are reported for Ca, Mg and Na (Fig. 4).
Median concentrations of K and Mg for samples collected from Cretaceous volcanic rocks are similar to the Phanerozoic cover and significantly lower than the older Palaeoproterozoic to Archaean divisions (p<0·05). Conversely, medians of Al and Ca for Cretaceous volcanic rocks are comparable to the Precambrian geological divisions, with the exception of the Anaboriana Terrane and Antananarivo Domain which have significantly higher median Al and Ca concentrations.
The Palaeo- to Neoproterozoic Bemarivo Domain comprises the North and South Bemarivo terranes and shows distinct geochemical signatures (Fig. 4). Median Ca and Na concentrations for North Bemarivo are significantly higher than those from South Bemarivo. Median concentrations of K, Fe and Al for South Bemarivo on the other hand are higher than North Bemarivo.
The Neoproterozoic Anaboriana-Manampotsy Belt underlies large parts of the project area (see Fig. 2) and comprises the Anaboriana Terrane and Manampotsy Terrane. Concentrations of Ca and Fe for the Anaboriana Terrane are significantly higher than measured for the Manampotsy Terrane. The median concentration of Fe (70 100 ppm) in sediments from Anaboriana Terrane is twice as high as the Manampotsy Terrane and much higher than any other geological division. Aluminium concentrations of both terranes are similar and among the highest.
Within the Antananarivo Domain median concentrations are significantly higher in the Tsarantana Complex with the exception of Al, which is with 21 500 ppm highest in the undifferentiated autochthonous basement.
The Antongil Domain and the Masora Domain have similar median concentrations, except K and Mg which are significantly higher in sediments from the Antongil Domain. Sediments collected from the Masora Domain have the overall lowest median concentrations within the Precambrain basement.
Geochemical signatures of base metals
This section presents geochemical data for Cd, Co, Cr, Cu, Ni, Pb and Zn in stream sediments and their aqua regia extractable concentrations in relation to the major geological divisions. The distribution of concentrations as individual notched box plots, including outliers (Fig. 5), are grouped by the 10 major geological divisions (Fig. 2). With median values of 18·7 ppm (Co), 102 ppm (Cr), 22·6 ppm (Cu) and 25·4 ppm (Ni) the Tsaratanana Complex is geochemically distinct. The listed median values are almost twice as high as values reported for sediments collected from the other geological divisions (Fig. 5). However, some of the highest concentrations (shown as outliers) are reported for stream sediments from the undifferentiated autochthonous basement and meta-sedimentary belts (see Fig. 5b, d, e and g).
The affinity of base metals within the Tsaratanana Complex is also highlighted by geochemical maps of Cr and Ni (Fig. 6a and b). These maps show elevated base metal concentrations across the Andriamena Belt of the Tsaratanana Complex, a complex association of orthogneisses, mafic to ultramafic igneous and meta-sedimentary rocks (Table 2). The southern half of the Andriamena Belt has produced high grade chromite ore for over 40 years (BGS–USGS–GLA, 2008).
Some of the lowest base metal concentrations are reported for North and South Bemarivo as well as for the Phanerozoic Cover. In the South Bemarivo Terrane, however, some 20 sediment samples, collected from the northern edge of the project area and on Nosy Be, yield concentrations for Ni and Cr above the 99th percentile of 114·2 and 444·4 ppm, respectively. Sediments collected over the contact of the Manampotsy Complex and Masora Domain in the southern part of the project area also show anomalous Cr and Ni concentrations. These coincide with the Ampasary Group within the Maroala deformation zone. Another more localised anomaly of both elevated Ni and Cu concentrations is located within the upper half of the Masora Domain (Fig. 6a, No. 1).
Median concentrations of Pb range from 4·6 to 12·7 ppm. The two geological divisions with the highest medians (>11 ppm) are the Anaboriana Terrane and the undifferentiated Antananarivo Domain. The widest concentration ranges of Pb, including the highest maxima, are reported for the Antongil Domain, North Bemarivo Terrane and Manampotsy Complex. Lowest median concentrations were found in sediments of the Cretaceous volcanic rocks, Masora Domain and North Bemarivo Terrane.
Median concentrations of Zn range from 21·6 to 44·1 ppm, and the Antananarivo Domain, Phanerozoic Cover and North Bemarivo Terrane are the divisions with the lowest medians. Highest median concentrations were calculated for sediments intermixed with Cretaceous volcanic rocks (Fig. 5h). The Antongil Domain (36·1 ppm) and Manampotsy Terrane (34·7 ppm) present the second and third highest median concentrations as well as the second and third highest maxima. There are significant correlations between Zn and Pb within the Antongil Domain (Pearson correlation coefficient r = 0·44), North Bemarivo (r = 0·40) and Manampotsy Complex (r = 0·39). Median concentrations of Zn in stream sediments of the Anaboriana Terrane, Tsaratanana Complex and South Bemarivo Terrane range from 33·7 to 32·2 ppm, but did not show any correlation with Pb. A geochemical map for Zn indicates areas of elevated concentrations >128 ppm (99th percentile) near the coast in the southeast of the project area as well as along the northern edge of the project area and Nosy Be (Fig. 6c). Lowest Zn concentrations occur predominantly across the Phanerozoic cover, undifferentiated Antananarivo Domain and North Bemarivo.
Geochemical signatures of Au in stream sediments
The statistical summary for Au within each domain includes Au concentrations based on the main 10 geological divisions (Table 3), and notched box plots (Fig. 5a). The percentage of values reported below the LLD of 0·2 ppb was found to be just over 20%.
Descriptive statistics of Au grouped by the main geological divisions*
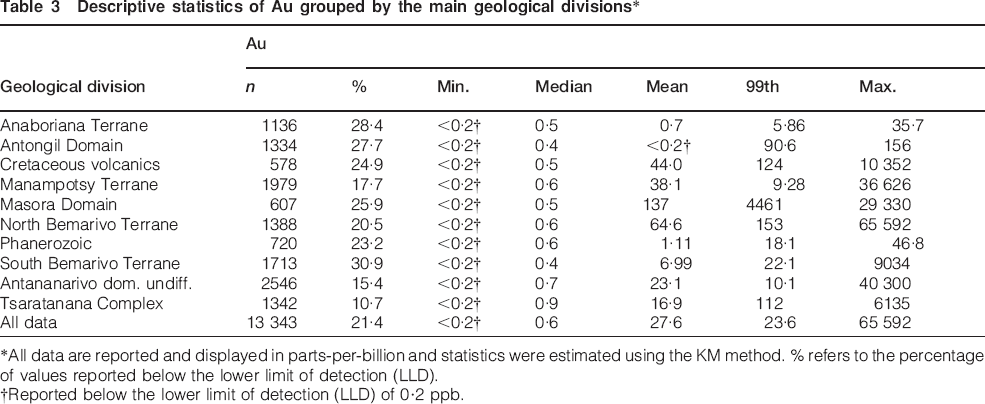
All data are reported and displayed in parts-per-billion and statistics were estimated using the KM method. % refers to the percentage of values reported below the lower limit of detection (LLD).
Reported below the lower limit of detection (LLD) of 0·2 ppb.
Median Au concentrations range from 0·4 to 0·9 ppb with the highest median calculated for sediments collected within the Tsaratanana Complex and the lowest for the South Bemarivo Terrane and Antongil Domain.
Table 3 also lists values of the 99th percentile class, representing anomalous samples from an exploration and prospecting point of view. The highest 99th percentile class corresponds to stream sediments of the Masora Domain, where the top 1% (equivalent to six sites) of data range from 4461 to 29 330 ppb. The second to fourth highest 99th percentiles, ranging from 112 to 153 ppb, relate to sediments from North Bemarivo Terrane, Cretaceous volcanic rocks and Tsaratanana Complex, respectively.
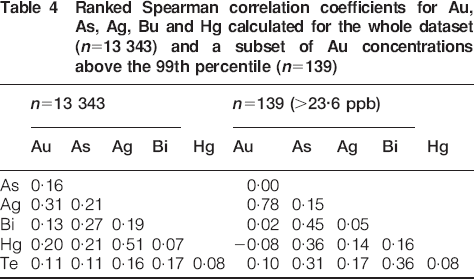
The correlation of potential pathfinder elements associated with Au mineralisation, such as As, Bi, Hg, Te or Ag, was investigated. A ranked Spearman correlation was carried out on the whole data set and a subset, comprising data for sites measuring Au concentrations >23·6 ppb (99th percentile). The strongest correlation exists between Au and Ag (Table 4), which shows a particularly strong positive correlation within the subset of samples of Au concentrations above the 99th percentile.
Ranked Spearman correlation coefficients for Au, As, Ag, Bu and Hg calculated for the whole dataset (n = 13 343) and a subset of Au concentrations above the 99th percentile (n = 139)
Elevated Au concentrations of >23·6 ppb (99th percentile) occur within (i) the Bemarivo Domain, largely along the northern edge and the east coast, (ii) the Andriamena Belt of the Tsaratanana Complex, (iii) the Manampotsy Complex, near the southeast coast, and (iv) the southern extent of the Masora Domain (Fig. 6d).
The highest Au concentration in a stream sediment sample is 65 592 ppb (65·6 ppm) and relates to a site within North Bemarivo. The second to fourth highest maxima relate to sediment samples from within the undifferentiated Antananarivo Domain, Manampotsy Complex and Masora Domain, respectively (Table 3).
With the exception of sediment samples collected across the Antongil Domain and Anaboriana Terrane, remaining geological divisions contain at least one site with a concentration of above 5954 ppb (99·9th percentile). Spatially, lowest Au concentrations occur across the Anaboriana Terrane, the north and south Antongil Domain and the western half of the South Bemarivo Terrane (Fig. 6d).
Discussion
The results section established that the geochemical data for central and northern Madagascar provide new information on the main geological divisions. At this point the authors would like to acknowledge that the use of partial digestion analytical techniques may not be the most effective method for geochemical mapping as it tends to under-report many of the potentially useful and less mobile high field strength elements. However, as the discussion will show, geochemical data for some 13 300 stream sediment samples highlight some distinct regional and local geochemical signatures in relation to the major geological domains and terranes.
Dominant geochemical signatures of Madagascar
The geochemical signatures of the aqua regia extractable concentrations of major elements Al, Ca, Fe, K, Mg and Na are lowest in sediments collected over Phanerozoic sedimentary rocks including the Cretaceous to Neogene volcanic rocks (Fig. 4). Within of the Precambrian rocks, the Masora Domain has one of the lowest and least significant major element concentrations.
The geochemical signature of Fe is particularly high in stream sediments from within the Neoproterozoic Anaboriana-Manampotsy Belt. In particular, the northern Anaboriana Terrane is geochemically distinct from other geological domains, with median concentration of 70 100 ppm Fe. The undifferentiated autochthonous basement and meta-sedimentary belts of the Antananarivo Domain reveal a distinct enrichment in Al, a feature that is not shared by the tectonically overlying Tsarantanana Complex, but which in turn displays strong geochemical signatures for the remaining mineral forming elements.
Geochemical signatures for alkalis Ca, K and Mg are overall high in sediments from the Palaeo- to Neoproterozoic Bemarivo Domain, which may be a reflection of meta-sedimentary carbonate lithologies and calc-alkaline plutonic rocks.
Anomalous concentrations of base metals (Cr, Co, Cu, Cr and Ni) relate predominantly to sediments from the Tsaratanana Complex (see Fig. 6). In particular, the Andriamena Belt (see Fig. 2, No. 3) is geochemically distinct from all the other geological divisions that crop out in the project area. These results confirm known mineralisation and existing mining activities in the area. Outside the Tsaratanana Complex, base metal anomalies of Cr, Ni and Zn concentrations are also observed in relation to Cretaceous and Neogene alkaline volcanic rocks, for example of Nosy Be. Other anomalies of Cr, Cu and Ni are located along the Maroala deformation zone and are associated with the Vohipaha mafic to ultramafic intrusion within the Masora Domain, which has known Ni–Cu(–PGE) mineralisation (BGS–USGS–GLA, 2008). The Cretaceous magmatism, associated with the break-up of Gondwana, gave rise to extrusive magmatism and emplacement of plutons and coast parallel mafic dyke swarms (Coffin and Rabinowitz, 1988), which have profoundly modified the drainage geochemistry. This is evident in streams sediment geochemistry around the Ambatovy lateritic Ni–Co deposit east of Antananarivo (Fig. 6a, No. 1), which has developed over the ultramafic parts of a late Cretaceous intrusive complex localised on a NW–SE fracture system (BGS–USGS–GLW, 2008).
The Bemarivo Domain should also have a distinctive Cu–Zn signature as it is characterised by calc-alkaline volcano sedimentary arc associations with scattered Cu–Zn prospects (BGS–USGS–GLA, 2008; Thomas et al., 2009). Correlation coefficients between Cu and Zn are significant with r = 0·55 and 0·31 for both the South and North Bemarivo terranes, respectively; but the interpolated map for Zn (Figs. 5 and 6c) does not indicate any significant regional geochemical signature.
Relation of anomalous Au in stream sediments to known gold districts
Madagascar has many known Au districts, which have been described by Andriamampianina (1999) and most recently by BGS–USGS–GLW (2008). These are largely found in primary deposits that relate to both epi- and mesothermal deposits within the crystalline basement, especially the Proterozoic and Archaean greenstone belts (Andriamampianina, 1999). Equally important are secondary deposits associated with lateritic and alluvial placers.
Geochemical data for elements associated with occurrence of Au, such as As, Bi, Hg, Te or Ag showed that the highest positive correlation exist between Au and Ag, and as such may be a useful pathfinder element for Au.
The spatial distribution of Au concentrations is interpolated on the geochemical map featuring the principal goldfields described in latter publications (Fig. 6b).
The Masora Domain has known mesothermal and intrusion related Au occurrences within the Ampasary-Mananjary gold district (shown as A in Fig. 6d) which is located in the southern part of zone B adjoining the Betsimisaraka suture zone.
Some of the highest Au concentrations were measured in stream sediments from within the Ampasary-Mananjary area (A), which contains six sampling sites with Au concentrations above 4·46 ppm (99th percentile).
The second highest 99th percentile (0·1 ppm) corresponds to elevated Au concentrations along the SW-NE trending northern margin of the North Bemarivo Belt (Betsiaka Group, district B in Fig. 6d) comprising Permo-Triassic sedimentary rocks (Phanerozoic rocks). This anomaly relates to primary epithermal Au deposits of the Andavakoera gold district (B) (Daraina-Milanoa in Andriamampianina, 1999). A geochemical map of Au indicates a strong Au signature beyond latter district spanning further east towards Vohemar (Fig. 6d).
West of Vohemar, one Au anomaly (Fig. 6d, C) straddling the boundary between the North and South Bemarivo terranes and one in the centre of South Bemarivo has not been previously described. The former could be related to Neoproterozoic gabbro and dioritic gneiss, which crop out within granite of this area.
Mesothermal deposits of the Antalaha gold district (D) are located in the northeastern part of the Antongil Domain. However, elevated Au concentrations only occur in streams towards the east coast, which may relate to the Andaparaty Thrust described by Schofield et al. (2010).
The Tsaratanana (called Andriamena in Andriamampianina, 1999) gold district (E) within project zone D (north) is also clearly highlighted by elevated Au concentrations in stream sediments (Fig. 6d).
Stream sediment data from the Ambositra-Antananarivo gold district (F), which stretches southwards from Antananarivo and covers most of the western half of Zone B, show only few localised anomalies of elevated Au concentrations.
Similarly, in the Beforona gold district (G), which comprises most of the southernmost tip of the Alaotra-Beforona Belt (Fig. 2), Au concentrations in sediments are relatively low with only one Au anomaly in the south that relates to migmatitic gneiss. One Au anomaly that does not correspond to known gold districts, is located to the east of the Beforona district (G) close to the coast south of Taomasina (Fig. 6d). It lies within the Manampotsy Complex, which in this area comprises mainly pelitic to quartzo-feldspathic gneiss and migmatitic orthogneiss. Stream sediments from the Bas-Androna district (H), located within the Androna-Mandritsara greenstone belt, do not show elevated Au concentrations (Tsaratanana Complex, Fig. 2).
Conclusions
The geochemical data of aqua regia extractable concentrations for over 13 300 stream sediment samples provide an extensive dataset which was collected and analysed using well-established methods and protocols.
The use of element concentrations allowed effective discrimination between various geotectonic domains and constituent terranes within north and central Madagascar. This is despite the internal heterogeneity, varied lithological associations and complex tectono-metamorphic history of the project area. This demonstrates that this dataset contains valuable information even for elements for which partial digestion may not be the most suitable technique.
Geochemical signatures of six major elements and seven base metals reveal that the Andriamena greenstone belt is geochemically distinct from all other basement divisions within the project area. However, base metal anomalies also occur in relation to Cretaceous and Neogene volcanic rocks, for example at Nosy Be, and mafic-ultramafic intrusions, for example along the Maroala deformation zone.
The distribution of anomalous Au concentrations in stream sediments showed strong correspondence with known gold districts of central and northern Madagascar, and may be used to identify new areas of potential mineralisation. Highest concentrations were measured in stream sediments from within the Ampasary-Mananjary (southern Androna-Mandritsara) and Andavakoera (northern margin of North Bemarivo) gold districts.
The stream sediment geochemistry dataset will be an important asset for national mineral exploration studies as well as environmental studies in Madagascar (both current and future work) at regional to local scale.
Footnotes
Acknowledgements
The authors are grateful to the Ministère de L'Energie et des Mines of the Republic of Madagascar for granting permission to publish the stream sediment data. The authors also thank all Madagascan student samplers and counterparts from Projet de Gouvernance des Ressources Minérales (PGRM) involved in mapping campaigns. The authors thank staff of GLW Conseil for their support during the duration of the project, in particular, the valuable contribution of Navoko Rakotomahefa in coordinating sampling campaigns, processing, preparation and shipment of samples. Many thanks to Roger Key, Paul Lusty and two external reviewers for their valuable comments on earlier versions of this manuscript. This paper is published with the permission of the Director of the British Geological Survey (NERC).