
Abstract
Grade control is a process of maximising value and reducing risk. It requires the delivery of tonnes at an optimum grade to the mill, via the accurate definition of ore and waste. It essentially comprises data collection, integration and interpretation, local resource estimation, stope design, supervision of mining and stockpile management. The foundation of all grade control programmes should be that of geological understanding led by clear and accurate mapping and representative sampling to drive appropriate estimation strategies and mining. Gold veins show features relating to erratic grade distribution (nugget effect), and variable geometry and internal architecture. These features include variations in dip, strike and width, late-stage faulting/shearing effects and vein continuity and type. Variations generally require close geological understanding to ensure optimum grade, minimal dilution and maximum mining recovery. A well-designed grade control programme will prove to management and stakeholders that by applying geological knowledge, the mining process can be both efficient and cost effective.
Overview
Ore and waste must be defined effectively to ensure an economic mill feed (Fig. 1). Ore grade and physical characteristics influence the mineral processing procedure and the mine economics in the short- and medium-terms. Grade control is essential for efficient mine operation, with key performance indicators including:
Bendigo gold mine, Australia – Gill reef at 124 205 m N showing the core zone of a saddle reef structure. The prime focus of grade control is the discrimination of ore and waste. In this example, the ore lies on the margins of the reef in laminated quartz material, with low-grade ‘bucky’ quartz on the middle. Pink circles on the margins show the locations of visible gold. This situation may be a prime candidate for blasting one side of the vein first and then the ore, to separate ore from waste (e.g. resue mining). The operator applied a proxy-based method to determine face grade (see Dominy et al., 2009b). Drive profile approximately 5 m by 5 m
effective definition of ore and waste
minimal dilution
maximum ore recovery
optimised mill feed grade.
The process of grade control broadly comprises:
data collection, integration and interpretation
local resource and reserve estimation
stope design
supervision of mining
stockpile management.
Grade control practices have evolved over the past 15 years or so from the use of paper-based methods, through to three-dimensional (3D) modelling and geostatistical simulation. However, the underlying foundation of all grade control programmes is still based on geological understanding led by mapping and sampling, and often supported by diamond and/or sludge drilling. The principles of geological mapping and sampling to support grade control are well-known and documented over a number of years (Schmitt, 1936; James, 1946; McKinstry, 1948; Peters, 1987; Marjoribanks, 2010). Grade control strategy is intimately linked to mine size and mining method.
Vein systems typically contain both barren and productive segments with gold grade varying laterally, vertically and across the body (Dominy et al., 2003; Platten and Dominy, 2003). Vein formation generally has a complex and extended history, related to the emplacement of relatively barren and gold-rich vein elements at different stages. Although it is a comparatively easy matter to establish the geological continuity of the global structure by drilling, the tracing of individual gold-rich veins (e.g. local geological and grade continuity) and determining their extent within the main structure is difficult without underground exposure to allow geological mapping. This is accentuated when the gold distribution in the vein shows a high nugget effect.
This contribution reviews the issues of grade control in underground gold mines and focuses on integrated mapping and sampling.
Mining method and grade control
Grade control strategy is related to mining method, which can be either an entry or non-entry type (Table 1). Stopes provide 3D exposure, with entry methods such as shrinkage and cut-and-fill stopes offering opportunities for on-going mapping and sampling (Fig. 2). These are well-suited to complex systems that require strong control, and some selectivity and flexibility.
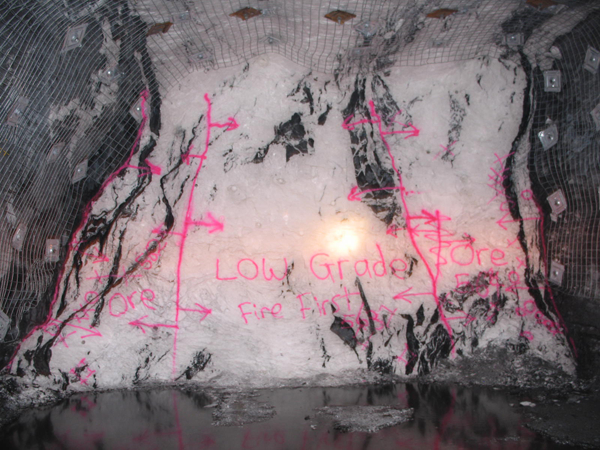
Gwynfynydd gold mine, Wales – stope back mapping and sampling undertaken in the Chidlaw Link Zone, 110 west shrink stope. Back samples were collected across the principal geological domains either side of the fault that crosses the stope. The western section (left of the fault) was not on the footwall, as this had been displaced south by the fault. The eastern section (right of the fault) was located on the footwall and locally presented small patches of fine visible-gold clusters. A few metres above this horizon, the vein rolled to the south and mapping allowed this to be predicted and the stope modified accordingly
Mapping and sampling type for different stoping methods during the mine production chain
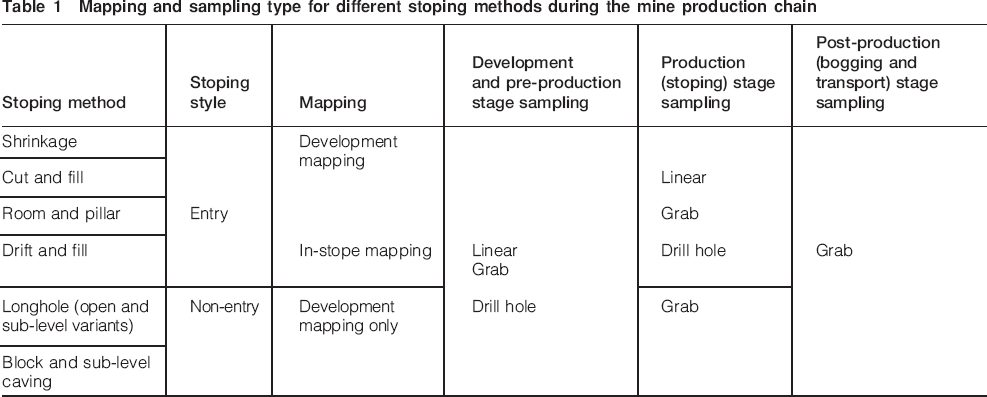
Non-entry methods such as longhole open stoping/retreat stoping can only be mapped and sampled in development drives, sub-levels and slot raises. These methods are suited to simpler planar structures where geological control is less critical and bulk extraction of the vein is appropriate. Longhole stoping has minimal in-stope flexibility if the structure proves more complex than expected (Dominy et al., 2009b). Non-entry methods encourage the tonnes not grade approach, whereas entry methods generally produce lesser, but higher grade tonnes.
Geological mapping
Introduction
Both surface and underground geological mapping has a positive impact on resource estimation and grade control (Schmitt, 1936; James, 1946; Forrester, 1947; McKinstry, 1948; Nugus et al, 2003; Dominy et al, 2009a). Grade control mapping supports dynamic mine development, particularly where geology is variable and mine openings may need to respond accordingly. Mapping contributes to the wider geological knowledge of the deposit and is part of the learning process.
General mapping issues
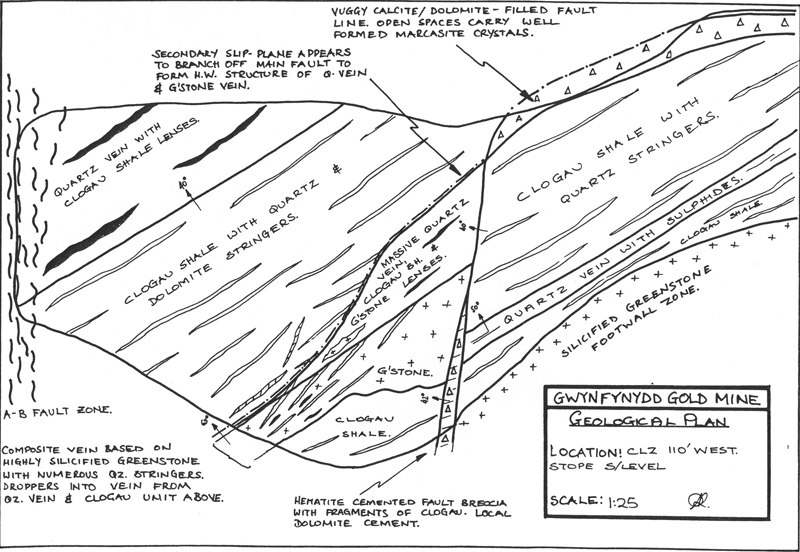
In vein systems, the gold mineralised structure is commonly less than 4 m in width, with rapidly changing grade and geological continuity (e.g. high-grade ore shoots may have dimensions of metres or a few tens of metres and high-grade gold veins or veinlets may be discontinuous). Mapping needs to be more detailed than for larger volume bodies and scales of 1∶250 to 1∶25 may be required to resolve structures relevant to grade control. The mapping of drives and raises are of equal importance as rapid variations in detailed geology need to be tracked.
An advancing drive or raise provides a 3D view of a short segment of the structure at each face advance. The new face, previous face, walls and back, form a box shaped exposure that allows the 3D form and position of the vein to be observed. The face is destroyed at each advance and any exposures of vein in the walls or backs will eventually be destroyed if stoped. Mapping and sampling of these exposures provides the data to estimate local grade and undertake stope design.
Stope mapping, for entry-based mining methods (e.g. shrinkage stoping), provides a check and control on the predicted position and structure of the vein, and thus tests the methods and assumptions used to predict stope geology and grade (Fig. 2). It permits reaction, should geological conditions dictate a change in stope dip, strike or width.
Time-scales of mapping procedures need to be compatible with other mine activities. Face maps in drives and raises are important, as they have to be recorded within the mine development cycle. It is important to be able to place face samples in their geological context.
Objectives of mapping
The primary objective is to identify and locate the ore zone or at least the vein section likely to contain the ore with respect to the minimum stoping width and to keep development on track. A secondary objective is to determine the attitude and position of relevant structures that control the 3D form of ore shoots or gold-rich veins. In particular, the shoot position relative to likely stope outlines and the pitch of the margins of ore shoots within the stopes.
The internal architecture of the host vein generally needs to be mapped, since small scale structures often have a profound effect on gold distribution (Platten and Dominy, 2003). In complex high-nugget systems, the advantages of mapping discrete veins rather than the gross quartz package are evident (Fig. 3).
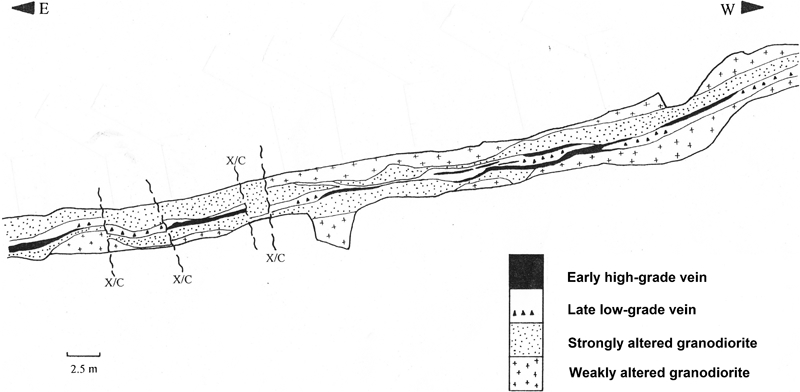
Mapped section of a granodiorite-hosted gold lode located in the Eastern Cordillera, Peru. Map shows discontinuous nature of the high-grade gold quartz-sulphide vein (early high-grade vein). The high-grade vein formed early in the development of the lode zone. Late activity introduced a low-grade quartz-dominated breccia vein which locally carries grade where fragments of high-grade vein are enclosed. The routine introduction of backs and raise mapping helped to resolve continuity of the high-grade vein and led to optimised stope design that improved high-grade vein recovery and reduced dilution. Head grades were increased from 5–6 g/t Au to 10–12 g/t Au. X/C shows cross-faults
Face sheets
Face sheets are the most important aspect of mapping as they indicate whether the drive or raise is still following the structure and allow direction of development (Fig. 4).
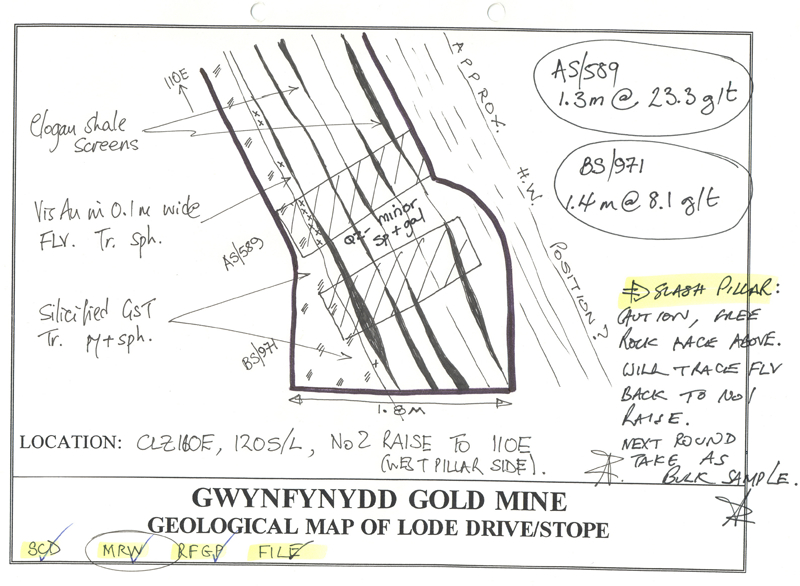
Gwynfynydd gold mine, Wales – typical face sheet used during operation. This sheet shows the vein (face) at the base of a raise from the 120 sub-level. Here the high-grade footwall leader vein is well-exposed with visible gold. Width of sub-level is 1·8 m. Sheet shows sample results and instructions to mining crew for next shift
In some operations, side wall mapping is important particularly where the vein system is geometrically more complex and is wider than development (Fig. 5).
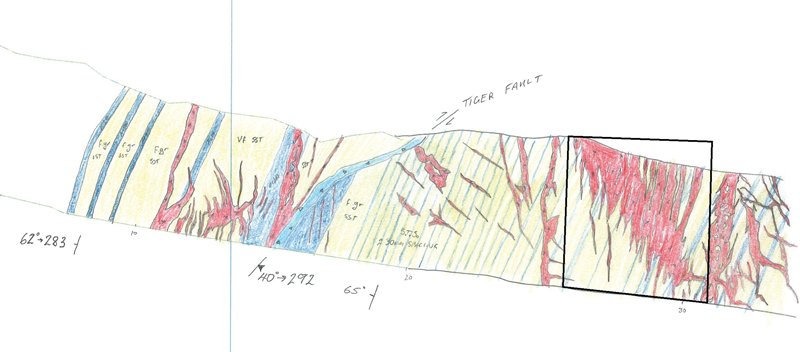
Ballarat gold mine, Australia – Llanberris 596 level access cross-cut sidewall map of the Tiger Up-Dip Lode. Mapped sidewall length 25 m, with cross-cut height approximately 5 m. Veining at Ballarat is complex and mapping of the access development provides a picture of the entire system. Not all quartz veins within the mineralised zone are extracted. Black box shows approximate profile of the north ore drive (see Fig. 7). Map colours: quartz vein in red, sandstone in yellow and shale in blue
Mapping is usually undertaken on a pro-forma sheet often made from water resistant paper. They provide a cross-section of the structure, give data in a vertical direction, give the most readily observed and interpreted view of the structure and are usually the basis for collection of samples. They need to be accurate and detailed yet mapping and sampling has to be rapid to limit disruption of the mine development cycle. Traditionally face sheets have been the property of the mine geologist, but should be copied to production staff to guide the next development round or stope lift (Fig. 4).
Many large operations use development profiles of 4 m by 4 m or greater. This means that for safety reasons the upper 2 m or more of the face and the backs cannot be easily accessed for close inspection or sampling. In such cases, the geologist needs to do the best possible job and leverage their experience at the mine to fill in the mapping gaps. Additionally, the drive backs are often meshed and bolted quickly after blasting and mucking for safety reasons. Again, the geologist will have to use appropriate expertise to glean what they can from partly obscured backs.
Mapping of drive backs provides additional information on small-scale vein continuity beyond that of face mapping which is usually on a scale of 1·8 m or above (Fig. 6).
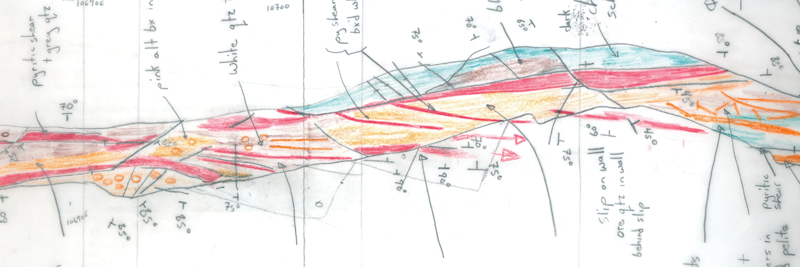
Cononish gold project, Scotland – example of a 1∶125 scale underground geological map. Map shows the nature of the Cononish vein in this section, as series splay-veins off a shear structure. This 35 m section grades approximately 6 g/t Au, the gold–sulphide veins being marked in red. It is important to resolve the continuity of the gold–sulphide veins as they carry most of the gold grade. The fully mapped exploration adit on the vein provided strong support for a predominantly drill-based resource estimate
In addition to mapping sheets, digital photography is an essential tool in modern underground mapping (Fig. 7). Rock faces can be recorded rapidly in a form that can be incorporated into digital databases and mining software (Fig. 8). Photographs can be printed and subsequently used in the mine as a base map for plotting complex data. Photographs on their own should not be used as a substitute for conventional geological examination, sketching and description at the time. Photographs can sometimes mask geological detail, particularly where lithological colour contrasts are weak.
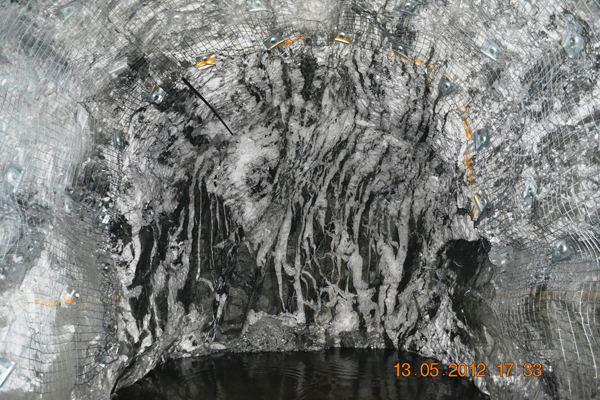
Ballarat gold mine, Australia – Llanberris 596 level face of north ore drive on the Tiger Up-Dip Lode. Referring to Fig. 5, this face represents the quartz body developed on in the north ore drive. Drive profile approximately 5 m by 5 m
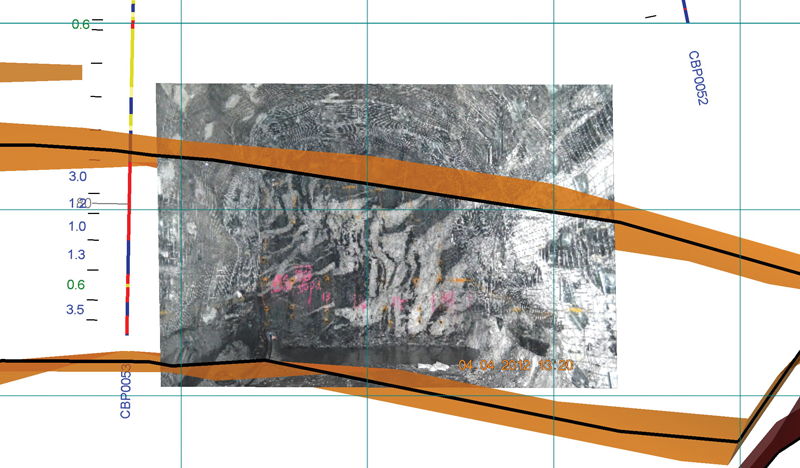
Ballarat gold mine, Australia – Llanberris 638 level north ore drive face on the Mako lode system. Drive profile approximately 5 m by 5 m. The digital photograph has been registered into a mining software package and can be integrated into the model to display nearby drill holes and geological wireframe. Visual integration such as this is a critical step in understanding local geology in complex vein systems. Mine development needs to be responsive to often short scale changes in veining and grade
The popular overuse of shotcrete in mines frequently inhibits mapping, particularly of walls and backs. Systematic digital photography can help speed data capture where shotcrete is applied almost immediately after mucking, and mapping time is very limited. An outline field sketch is still required. However any data is better than a shotcrete covered surface if unexpected changes in ore character have occurred.
Face or backs mapping can be made more time efficient through the use of field tablet computers where mapping is directly onto the tablet. This results in an immediate digital format that can be easily ported to other software for editing and/or visualisation. The authors are aware of an example where the set-up, mapping, data export and modelling time for 100 m of backs mapping took around 18 h using a tablet system compared to over 30 h using a traditional paper-based method followed by manual digitisation. This represented a saving of more than 40% of time.
Direct face mapping is possible via specialised digital camera units (Van Der Merwe, 2009; Rees, 2012). The geologist can draw ‘lines’ on the image to represent geological features, which can then be ported to suitable mining software fully registered in 3D mine space.
In the more open minded operation, mapping will include the recording of geotechnical as well as geological parameters to facilitate better stope planning. Geologists are the natural recorders of geotechnical information following appropriate training.
Sampling for grade control
The requirement for high quality samples has been long recognised, where they should be representative, unbiased, safe and operationally timely. Various methods and approaches are available to the mine geologist (Rickard, 1907; Peters, 1987; Minnitt, 2007; Dominy et al., 2009b, 2011; Dominy, 2010). Gold veins often pose problems during sampling because of their erratic grade distribution, which is often compounded by the presence of coarse gold particles (Dominy et al., 2000, 2011; Dominy and Petersen, 2005). Consideration should be given to the implications of the gold particle sizing and uneven distribution of gold requiring larger and close-spaced samples in order to be representative; partition of gold between sulphide-locked and free categories, geological versus assay cut-offs, and stringers/disseminations that require sampling beyond vein margins (Dominy et al., 2011).
Sampling strategy aims to provide quality information on gold grade and its relationship to geology. There is often a tendency to sample across faces in fixed lengths, though this should be avoided for a more geological approach. Samples must be collected in such a way as to minimise sampling errors (e.g. delimitation and extraction error), ensure effective labelling and bagging, be located in mine 3D space, and recorded on face sheets to ensure geological context.
There is scope to be smarter through the better use of geology during the mining process. In some cases it may be possible to make a preliminary grade call based on geological and mineralogical parameters (e.g. proxies) such as the presence of certain minerals, specific quartz vein textures and so on (Dominy et al., 2009b, 2010). The capability of calling face grade quickly has a clear advantage over waiting 12 h or more to get laboratory assays returned. Any proxy method will be semi-quantitative and must be well-proved to be relied upon.
Geometallurgy and grade control
Geometallurgy seeks to integrate geology, metallurgy and engineering knowledge to provide a better understanding of variability within the orebody beyond that of just grade. It is as equally applicable to the grade control process as it is during a feasibility study. Since the grade control geologist is the first to see the mineralisation during development, he/she is in a position to report pertinent issues.
Processing issues can range from very high-grade coarse-gold ore that results in gold losses both in the mine and mill, and crusher blocking; hard ore that leads to mill circuit sanding, grinding inefficiencies and poor gold liberation and recovery; high clay content resulting in high pulp viscosity leading to grinding inefficiencies and poor gold liberation and recovery; and abrasive ore that leads to rapid mill component wear.
Relevant geometallurgical mapping characteristics could include: abundance of visible/coarse gold, sulphide-rich versus sulphide-poor mineralisation (and associated bulk density variability), the presence of problematic mineral species (e.g. chlorite or tellurides), alteration and associated clay content, quartz/wall rock ratios, degree of oxidation, and mineralisation hardness and abrasiveness (a visual based classification based on rock type, alteration type/strength and fracture density for example).
Mapping and sampling under production conditions: The time issue
During production, time spent at a working face is critical. The geologist must develop skills to collect the best information in the shortest time. There is rarely an hour to spend at a face and more likely between 15 and 30 min.
Operational pressure tends to be higher in large mechanised mines, whereas in smaller mines (e.g. air leg) there is usually a higher focus on tonnage quality rather than quantity of tonnes. Whilst not wanting to unduly hold up development, time to do the job properly and collect samples in a geological context is imperative. The authors maintain that once the mining crew has made a face safe, it is not unreasonable for a geologist to be allowed 30 min at the face per shift. Actual time required will depend on orebody complexity and drive size. In reality, the actual delay cost by allowing geologists access to a face is minimal, though few mines will either realise or admit this.
There is often an inverse relationship between the size of a mine and sample mass collected at face. Additionally, there is also often an inverse relationship between mine size and sample quality. These issues relate to, amongst other things: the rate of face advance, time pressures, and availability of the geologist. It is critical to have mine coverage by the geological team and this may need to be 24 h per day.
Geotechnical mapping unified with geological mapping
Geological mapping during grade control provides a perfect opportunity for the collection of geotechnical information. An appropriately trained geologist is the natural recorder of geotechnical data. The geologist can collect data from faces and/or side walls to include rock type, major and minor structures, blockiness and water seepage. This information will support the definition of rock mass quality and structural regimes, which will in turn feed into stope design (e.g. dilution control) and ground control. Faces can be treated as windows for geotechnical mapping or a scan line(s) can be taken across the face and along the side walls back to the previous face position. A visual assessment may be made of drive backs, though these may be bolted and meshed already. During rising, a similar approach using faces and side walls can be applied. In entry stoping methods, on-going geotechnical assessments of backs and side walls are critical for both dilution and ground control. The inclusion of geotechnical mapping may add to the time needed at the face, though for an experienced geologist this may be no more than a few minutes.
Integrating mapping and sampling data into the stope design process
Mapped and sampled development (as drives, possibly with raises) serves to effectively block out reserves. Development data are often supplemented by diamond drilling information (Fig. 8). As part of the grade control estimation process, a design file should be established for each stope. This should contain all relevant geological, grade and geotechnical data to facilitate economic evaluation and design. The stope file should include both digital and paper based information, with a physical file established to document all parameters and visuals of designs.
The success of the process will be constrained by the level of collaboration between geologists and engineers. In complex orebodies, the need for close collaboration is very high. Planning meetings must be held to ensure that all information is passed between the parties. Geologists must use mapping data to constrain the estimation process and build any complexities into the stope design (Figs. 3, 4, 6 and 8). Final sign-off on stope economic viability and design must be a bipartite activity.
Safety issues
There are many safety considerations to be had when working underground. One of the greatest risks for the geologist is working under unsupported ground. In many operations, close access to the face is not permitted and leads to the application of ‘remote’ mapping and grab sampling during development. This tends to be in the larger rather than small mines. Awareness of the risk and proper training is critical. High risk also faces the geologist when mapping and sampling within raises, again training is required.
Conclusions
This contribution proposes that effective geological mapping, together with sampling are critical to grade control in underground gold vein operations. Grade control is about adding value by delivering optimal grade tonnes to the mill via the accurate definition of ore and waste. It permits better selectivity to optimise grade above the cut-off, minimise waste/low-grade rock dilution and maximise mining recovery.
A number of issues support a successful underground grade control programme:
clear and accurate geological mapping
appropriate sampling and assaying protocols, which take into account the nature of the orebody
a dynamic working model for mineralisation controls
effective stope design to optimise recovery and reduce dilution based on strong geological and engineering input and team collaboration
geometallurgical inputs to assist in optimising mill recovery and throughput where appropriate.
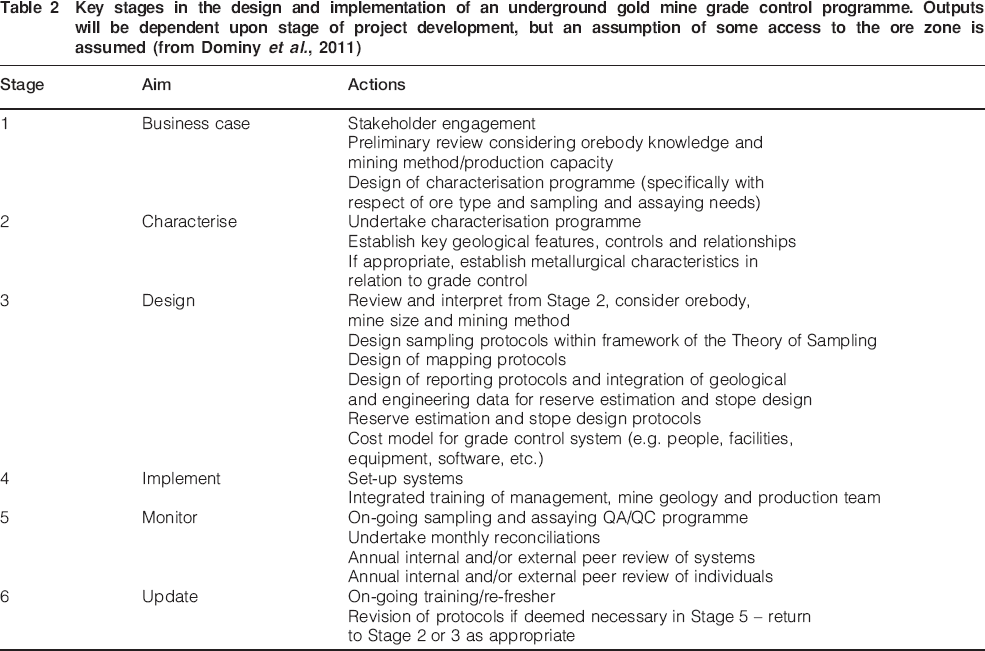
Key recommendations for the design and implementation of a grade control sampling programme are summarised in Table 2.
Key stages in the design and implementation of an underground gold mine grade control programme. Outputs will be dependent upon stage of project development, but an assumption of some access to the ore zone is assumed (from Dominy et al., 2011)
A well-designed grade control programme will show stakeholders that by applying geological knowledge, the mining process can be more efficient and cost effective. The authors believe that grade control is about identifying uncertainty and risk to maximise value. It is about setting expectations and ensuring no surprises and where there is risk – manage it.
Footnotes
Acknowledgements
The authors acknowledge various companies for the opportunity to input into grade control studies over a number of years. Thanks are due to AES Editor, Professor Neil Phillips for his helpful review of the manuscript. The opinions expressed in this paper are those of the authors, and not necessarily those of Snowden.
This paper is part of a special issue on uranium deposits and in-situ leaching