
Abstract
The geological mapping of central Australia – an area some 1500 km by 1000 km – began in 1950, was completed in 1979, and formed part of a program to map the continent at 1∶250 000 scale. The program arose out of the Australian Government's realisation during the Second World War that knowledge of Australia's petroleum and mineral resources was meagre and scattered, and that exploration for these commodities needed systematic geological maps. Aerial photography of the continent also started at this time, and proved indispensable to the mapping, as did four-wheel-drive vehicles. The procedure for making geological maps from a blank sheet of paper in the pre-digital age is set out, including the use of aerial photographs, planning a week's work, the necessity for recording all the evidence at an outcrop, compilation, correction and printing of the map.
Introduction
The establishment of the Bureau of Mineral Resources (BMR) by the Australian Government in 1946 led to a program to systematically map the entire Australian continent. Some features of that program, such as the long field seasons each year and reliance on air photos for navigation, are less vital today; but the importance of looking at the rocks, recording all the evidence at an outcrop, and good leadership of geological field parties are still essential to successful exploration today. The maps and understanding arising from the 1948–1979 BMR field campaigns remain integral components of regional geology and mineral exploration in Australia.
Background
Investigation of Australia's geology and mineral resources began in piecemeal fashion by the colonies and, after 1901, the states. The data the states collected remained with them, as there was no national organisation that could bring it together. The establishment of the BMR by the Commonwealth Government can be summarised as follows (from Wilkinson 1996). By 1944, after the establishment of a Mineral Resources Survey during the Second World War, the lack of knowledge of the country's mineral deposits had become plain, and the Commonwealth Government set up the Mining Industry Advisory Panel to advise on post-war mining policy. Dr Harold Raggatt, Director of the Mineral Resources Survey, wrote to the Secretary of the Department of Supply and Shipping pointing out the necessity for a systematic survey of mineral resources, as other countries had long been doing, such as the Royal Corps des Mines in France since 1822, and the Geological Survey of the British Isles since 1835. In March 1946, Cabinet set up the Bureau of Mineral Resources, Geology and Geophysics, with Raggatt as Director. Its functions included ‘geological and geophysical surveys and other work associated with exploration’.
The Advisory Panel had also recognised the value of aerial photographs to mapping, and the government established the Division of National Mapping to make topographic maps of the entire continent. In the late 1940s, the Royal Australian Air Force (RAAF) began a program of photographing the whole of Australia at an altitude of 7620 m (25 000 feet), and produced black-and-white (B/W) aerial photographs – the K-17 set – at a scale of about 1∶46 500.
The mapping project
Central Australia, also known as ‘the Red Centre’ (Fig. 1) or just ‘the Centre’, comprises the southern part of Australia's Northern Territory and the adjoining parts of Western Australia, South Australia and Queensland (Fig. 2). The BMR systematically mapped this region (except South Australia) from 1950 to 1979 as part of the program to map the entire continent at 1∶250 000 scale. The mapping of the continent began in 1948, in the Carnarvon and Canning basins in Western Australia, and Western Australia and Queensland were mapped jointly with the two state geological surveys. The southern part of Australia was mapped almost entirely by the six state geological surveys, and by 1984 the Australian continent was completely covered by geological maps at 1∶250 000 scale – central Australia includes 90 of these. A 1∶250 000 map sheet is, on average, 150 km by 110 km, and Australia produced 546 of them over 37 years.
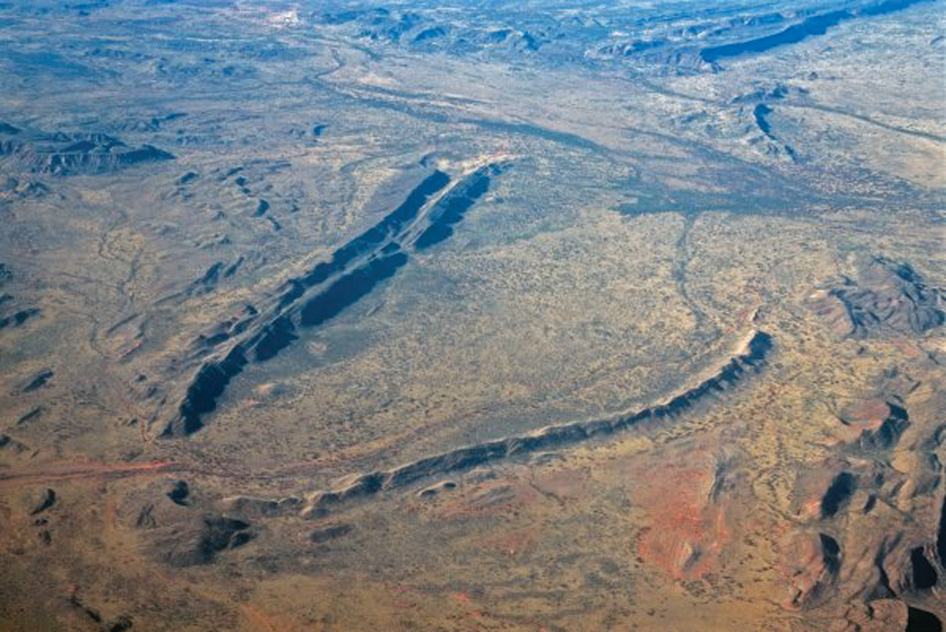
Aerial view of west-plunging antiform in Arumbera Sandstone, Amadeus Basin, 70 km south-southeast of Alice Springs, 1977. Double ridge of red-brown sandstone is 7·6 km long. ©Commonwealth of Australia (Geoscience Australia) 2014. Photo by D. H. Blake
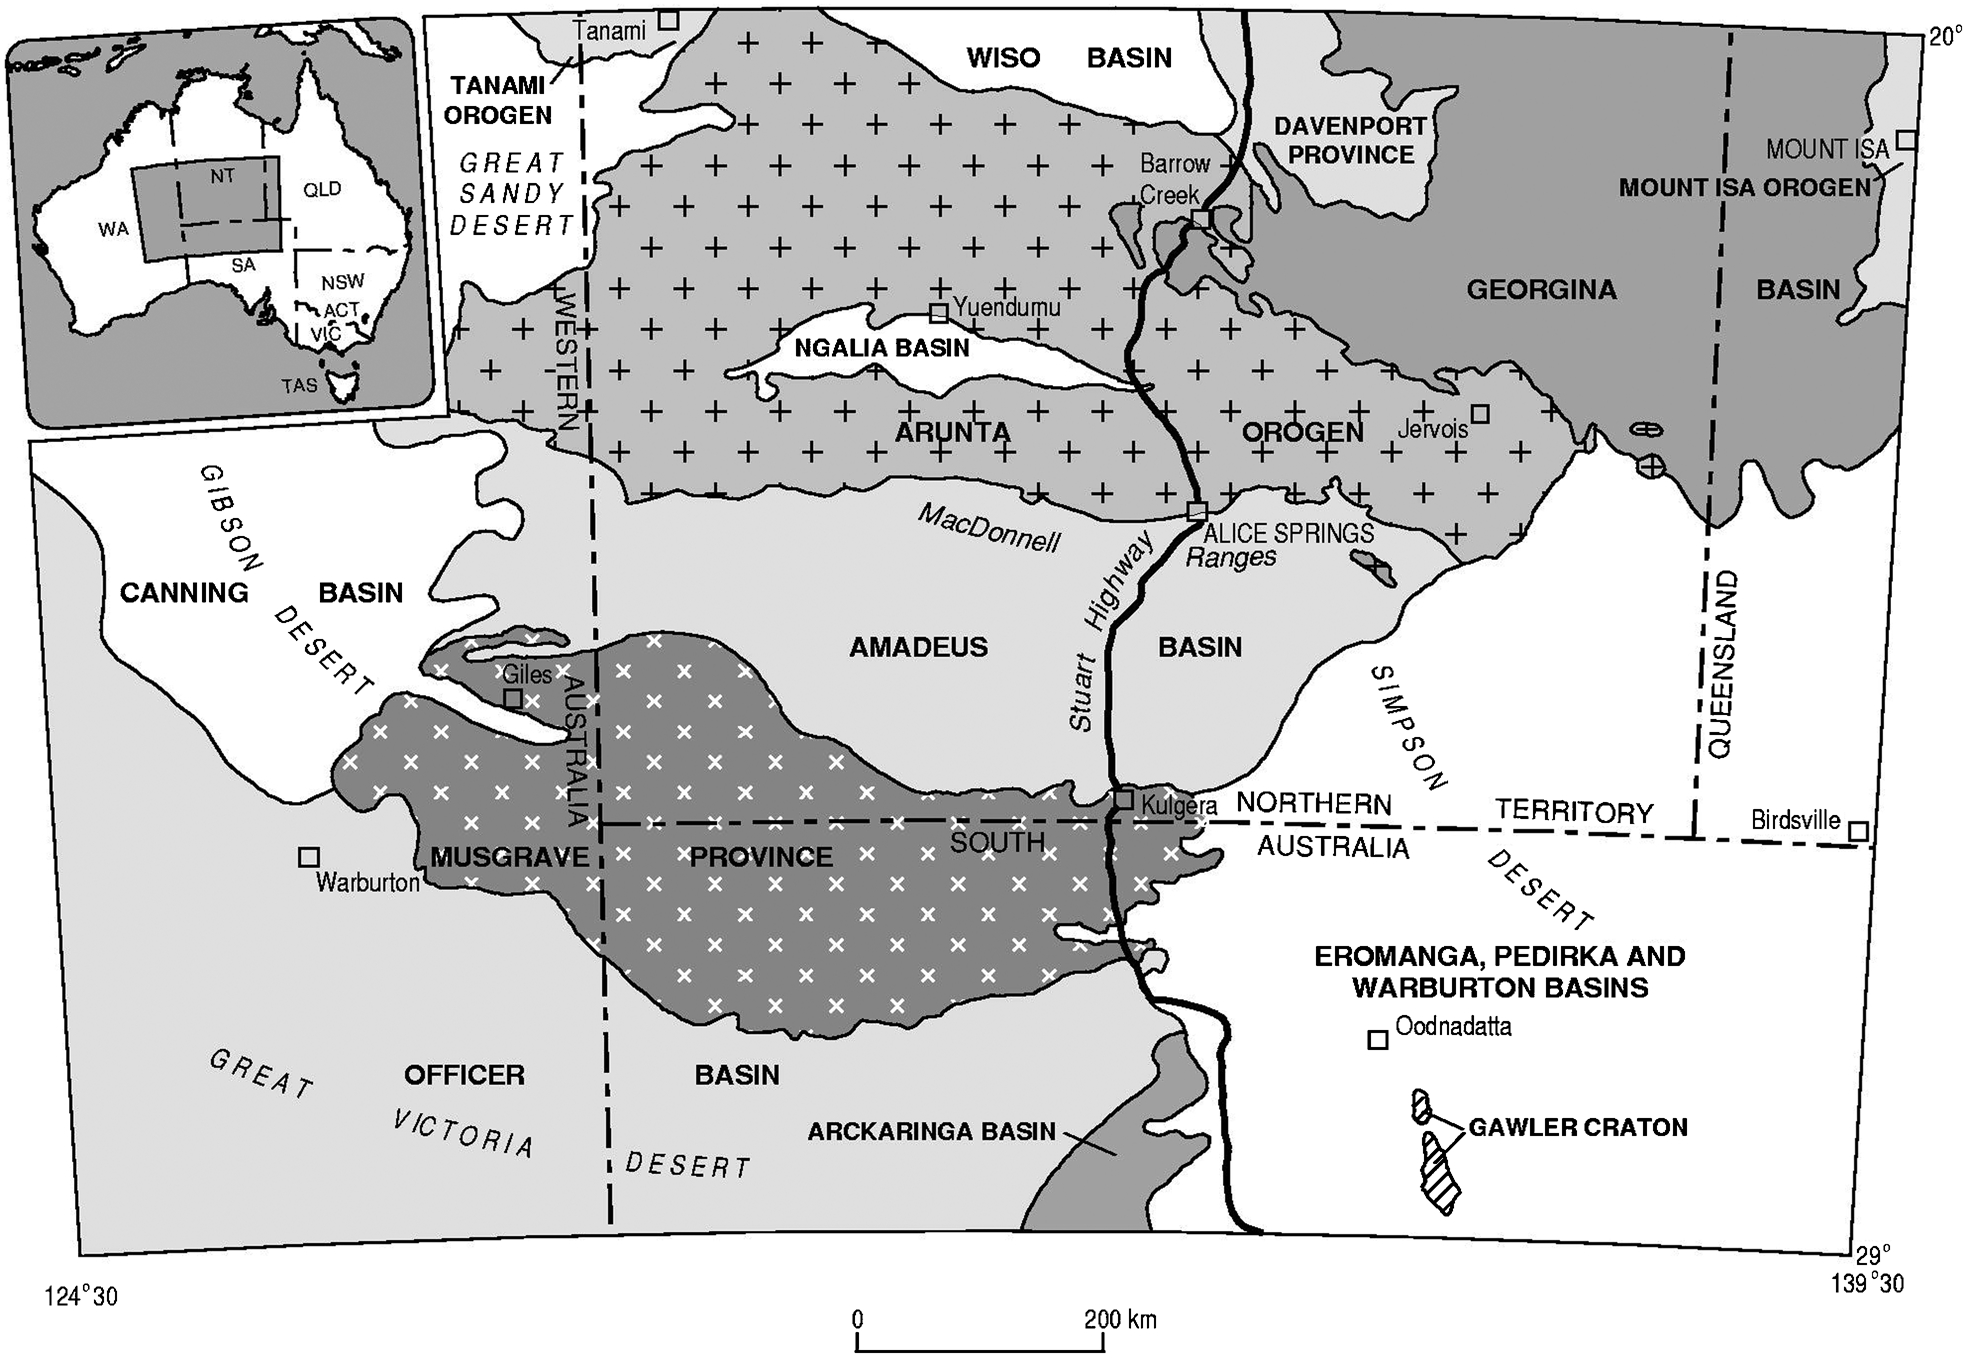
Locality map of central Australia showing tectonic provinces and sedimentary basins
Geology
The author took part in the 1∶250 000 mapping of the Amadeus Basin and the 1∶100 000 mapping of the Arunta Orogen and Musgrave and Davenport Provinces from 1962 to 1992 (Fig. 2). The oldest rocks are in the Arunta Orogen, a metamorphic complex with a history lasting from 1880 to 300 Ma, and the Davenport Province to the northeast, a sedimentary and volcanic sequence coeval with the oldest Arunta rocks. These two provinces are unconformably overlain by the Wiso and Georgina Basins, and the Arunta Orogen is overlain to the south by the Amadeus Basin. The Amadeus Basin extends from Western Australia eastwards for 900 km, where it interfingers with the Warburton Basin below the Pedirka (318–284 Ma) and Eromanga Basins (199–93 Ma). The Amadeus Basin rests unconformably (Fig. 3) on 1600–530 Ma metamorphic and igneous rocks of the Musgrave Province to the south (Fig. 4), which is itself overlain to the south by the Officer Basin. The Amadeus, Georgina, Wiso and Officer Basins, together with the Ngalia Basin, which sits unconformably in the middle of the Arunta Orogen, are all remnants of a single huge sedimentary basin, the Centralian Superbasin. Sedimentation in this basin took place from around 850–320 Ma.
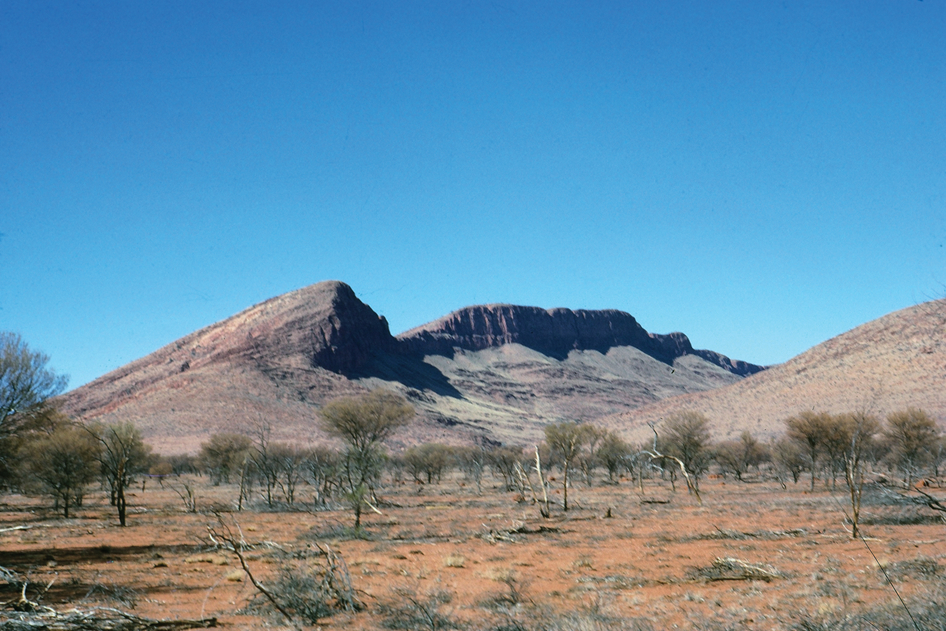
Mannanana Range 95 km east-northeast of Giles, Musgrave Province, Northern Territory, 1962. Dean Quartzite (∼850 Ma) resting unconformably on schistose Amputjuta Dacite (∼1150 Ma). Sand plain with drought-affected mulga in foreground. Relief between sand plain and top of ridge about 300 m. Recumbent V shape in bedding trends below left hand peak is core of an inclined antiform plunging 55 degrees to southeast. ©Common wealth of Australia (Geoscience Australia) 2014. Photo by A. J. Stewart
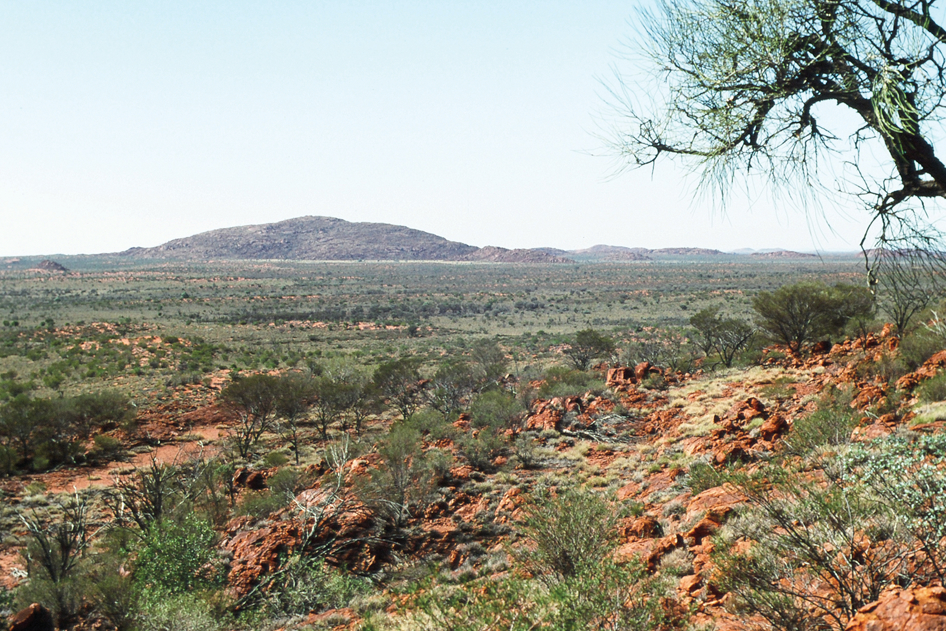
Typical landscape in Musgrave Province, 110 km south-southeast of Giles, Western Australia, 1991, showing foliated granite in foreground with mulga (Acacia) and corkwood (Hakea, right), sand plain with dunes in middle ground, and inselbergs (Mount Gosse the highest) in background. ©Commonwealth of Australia (Geoscience Australia) 2014. Photo by A. J. Stewart
Early geological mapping
Geological investigations in central Australia began in the late nineteenth century, and many reports and papers were published. References to these can be found in the Explanatory Notes published for each 1∶250 000 geological map. Among the most significant studies concerned with the Amadeus Basin were those by Douglas Mawson and Cecil Madigan (Mawson and Madigan 1930, Madigan 1930, 1932a, b). They surveyed the eastern (Figs. 5 and 6) and western MacDonnell Ranges, and produced geological maps of parts of central Australia. The maps covered large areas, being the illustrations in published papers, and could not show much detail. Topographic control was poor, as systematic topographic mapping of central Australia had not yet begun; geologists had to make their own topo maps.
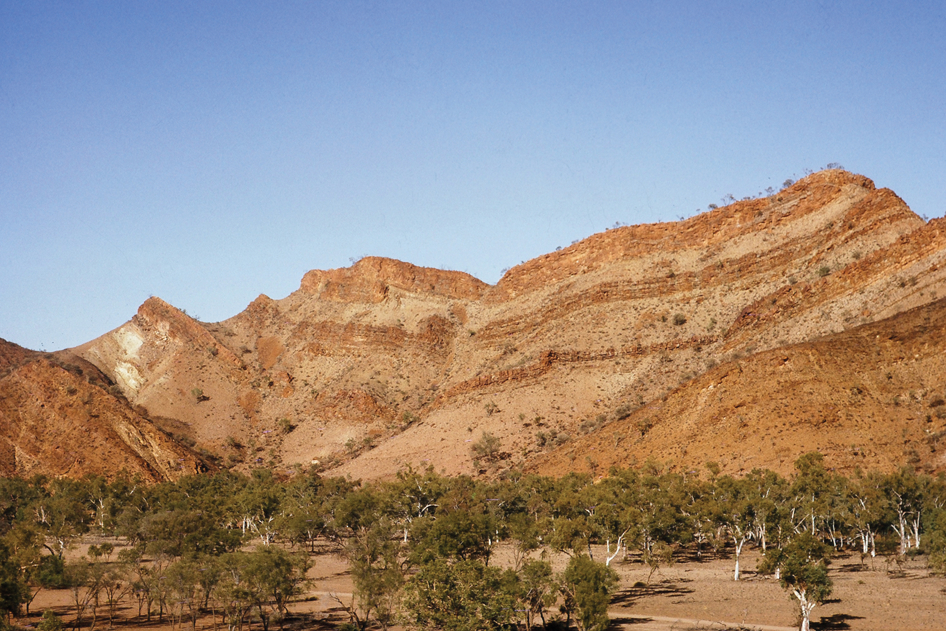
Synform on western side of Ross River Gorge, 63 km east of Alice Springs, Amadeus Basin, 1964. Lowermost brown sandstone with dark ferruginous layer at top is Goyder Formation (Late Cambrian), overlain by Pacoota Sandstone (Cambrian to Ordovician) with three resistant ridges above three pale, recessive intervals. River gums in foreground (Eucalyptus camaldulensis). ©Commonwealth of Australia (Geoscience Australia) 2014. Photo by A. J. Stewart
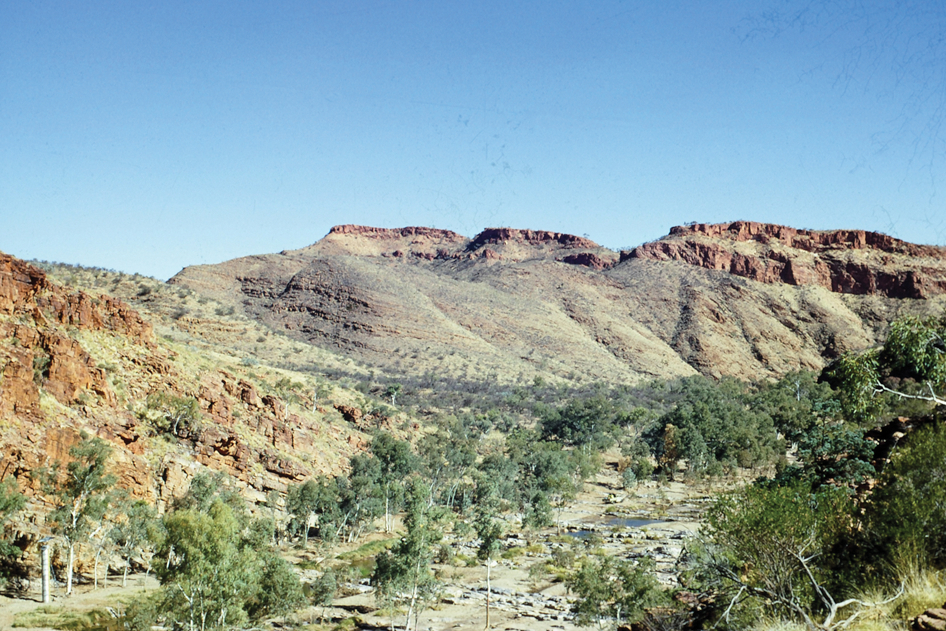
Two thrust sheets of allochthonous Heavitree Quartzite (red-brown cliffs on skyline) resting on dolomite and shale of Bitter Springs Formation, which conformably overlies autochthonous, red-brown Heavitree Quartzite at far left. Ruby Gap Gorge, Amadeus Basin, with river gums and Hale River, 114 km east of Alice Springs, 1967. ©Commonwealth of Australia (Geoscience Australia) 2014. Photo by A. J. Stewart
In 1956, the Commonwealth Government established a Resident Geologists Office in Alice Springs led by Dennis Bell. It was staffed by geologists on secondment from the BMR. Its work was mainly the siting of water bores for the pastoral industry and assessment of mineral deposits, but the geologists also did some geological mapping. Clive Prichard and Terry Quinlan produced the first 1∶250 000 geological map and report on the southern half of the Hermannsburg Sheet area. This area included the type section of the Amadeus Basin at Ellery Creek (Prichard and Quinlan 1962) and was the forerunner of systematic geological mapping of the basin.
Air photos and their use
The aerial photograph, or air photo, was the most valuable tool in the geological (and topographic) mapping of Australia. The photos are large prints, 223 mm square, taken vertically downward by a camera that automatically exposes images that overlap by about 60%. When adjoining photos are looked at side by side, they provide a three-dimensional (3D) view of the terrain, which reveals hills, valleys, cliffs and buildings with remarkable clarity. Adjoining photos are usually viewed with a stereoscope, ideally a mirror stereoscope that allows the photos to be placed side-by-side on a table or desk. The two mirrors reflect the images into two prisms set at eye-distance apart. A magnifying binocular eyepiece can be swung in or out of position above the prisms as desired. An added bonus is to mount the mirror stereoscope on cradles that allow it to roll left and right and back and forth, so that viewing any part of the 3D image is almost effortless. The cradles come with small fluorescent light tubes that illuminate the photos. During the week's work away from base camp, we used pocket stereoscopes, which are a pair of low-power magnifying lenses set at eye-distance apart and mounted on hinged legs that keep the image in focus.
The value of air photos to geological mapping was recognised by Madigan (1930) while working in the Alice Springs – Glen Helen area of the western MacDonnell Ranges. Here, the sedimentary rocks of the Amadeus Basin strike regularly east and west for some hundreds of kilometres and dip steeply south off the Arunta metamorphic basement (Fig. 2). Early mappers had traversed the sedimentary sequence, and then correlated the formations from one traverse to the next, several tens of kilometres apart. Some formations, notably the basal ‘No. 1 Quartzite’ (later named the Heavitree Quartzite), the overlying carbonates (Bitter Springs Formation) and the distinctive red-brown ‘No. 3 Quartzite’ (Arumbera Sandstone) were easily correlated, but other sandstone units proved difficult to tell apart, and some errors resulted. When Madigan learnt of the new technique of aerial photography, he decided to try it in central Australia, to solve the correlation problems. He was given the use of two aircraft fitted for aerial photography by the RAAF and flew strips of photos along the MacDonnell Ranges east and west of Alice Springs. The solution to the correlation problems quickly appeared – some sandstones thinned westwards to zero, and others, at different stratigraphic levels, appeared and thickened up. The value – necessity – of air photos was plain, and when in 1960 the BMR began mapping the Amadeus Basin, it was done exclusively on the K-17 air photos flown by the RAAF in the late 1940s and early 1950s.
The K-17 set was not without blemish. It was flown in a hurry, and a few malfunctions occurred. Occasionally the camera would fail to take an exposure, which caused a loss in stereoscopic overlap. The most common problem, however, was the difficulty pilots and navigators had in determining the position of map sheet boundaries in areas of flat and featureless sand plain. The air photo runs were oriented east-west, and the entire set of photos for each 1∶250 000 sheet was meant to overlap the four sheet boundaries (Fig. 7a). However, this did not always happen, and many photo runs in the Centre ended before crossing the eastern boundary of the sheet (Fig. 7b). Fortunately, the western ends of the photo runs of the next sheet to the east included the eastern boundary, but you had to be aware of this so as to take those extra air photos out to the field. Similarly with the southernmost run of several map sheets such as the Kulgera 1∶250 000 sheet; much of the western part of the southernmost run lay north of and therefore missed the southern boundary of the sheet (Fig. 7b). We did not check the air photos before leaving for our 1963 field season, and so did not visit a large hill in the southwestern corner of the sheet area. We had thought the hill was in South Australia. We labelled it simply as ‘Precambrian schist and quartzite’ on the map (Fig. 8a), and had no information on its composition or structure. It was not mapped until 1992, when the Northern Territory Geological Survey published the second edition of Kulgera 1∶250 000 and the hill proved to be mylonite (Fig. 8b) of the giant Woodroffe Thrust that penetrates the entire thickness of the crust in the Musgrave Province and extends east-west for hundreds of kilometres.
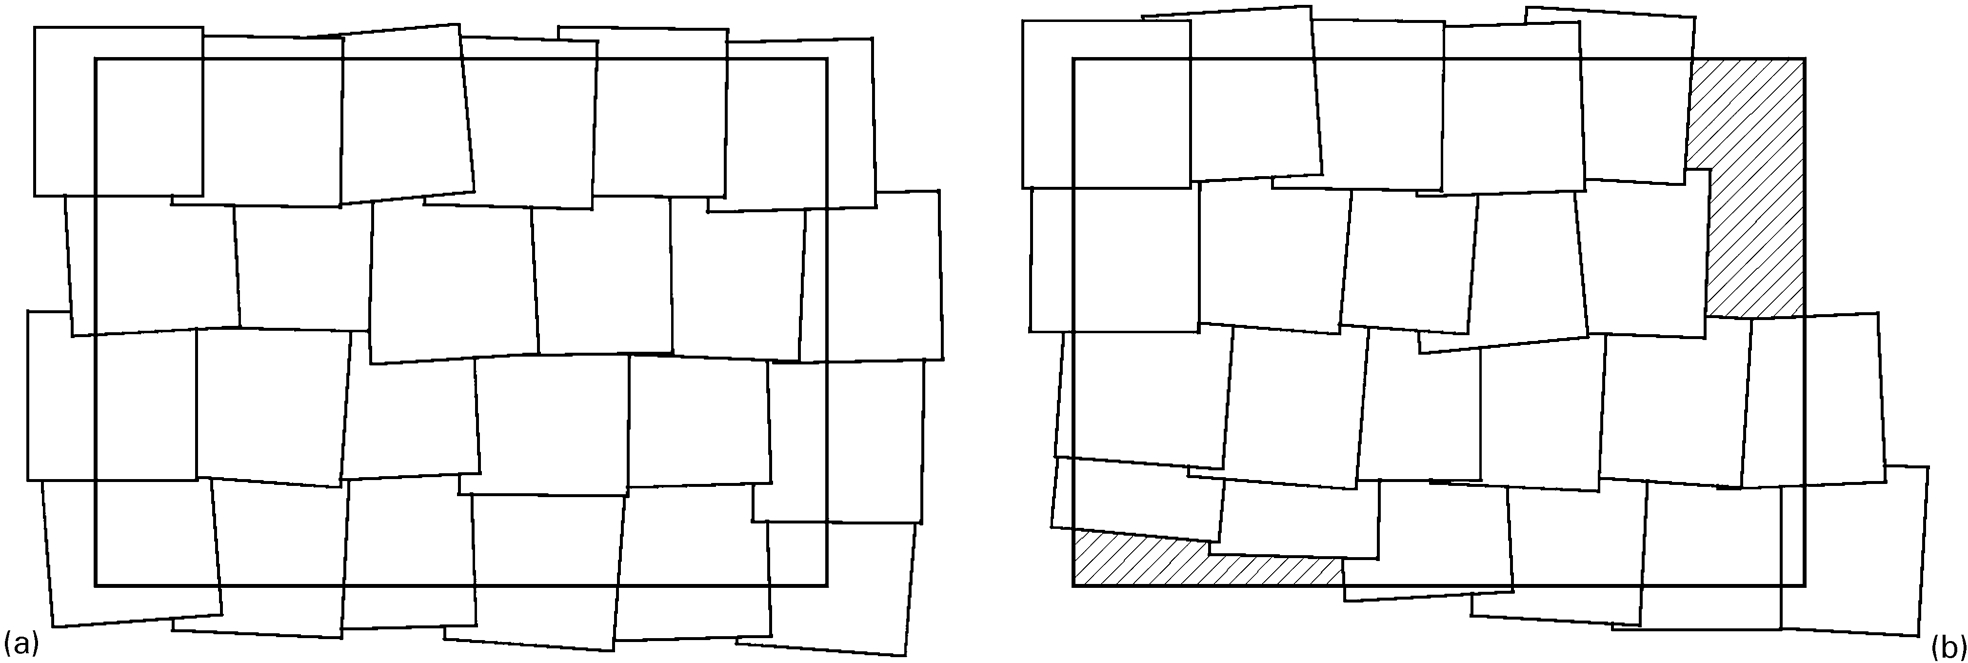
a Diagram of K-17 air photo set showing photo runs overlapping all four 1∶250 000 map sheet boundaries, the ideal case; b The same, showing top two runs ending short of eastern boundary of map sheet, and bottom run not covering southern boundary of map sheet. Air photo size enlarged for clarity – there were actually 15 runs of K-17 air photos per 1∶250 000 map sheet, not four as shown
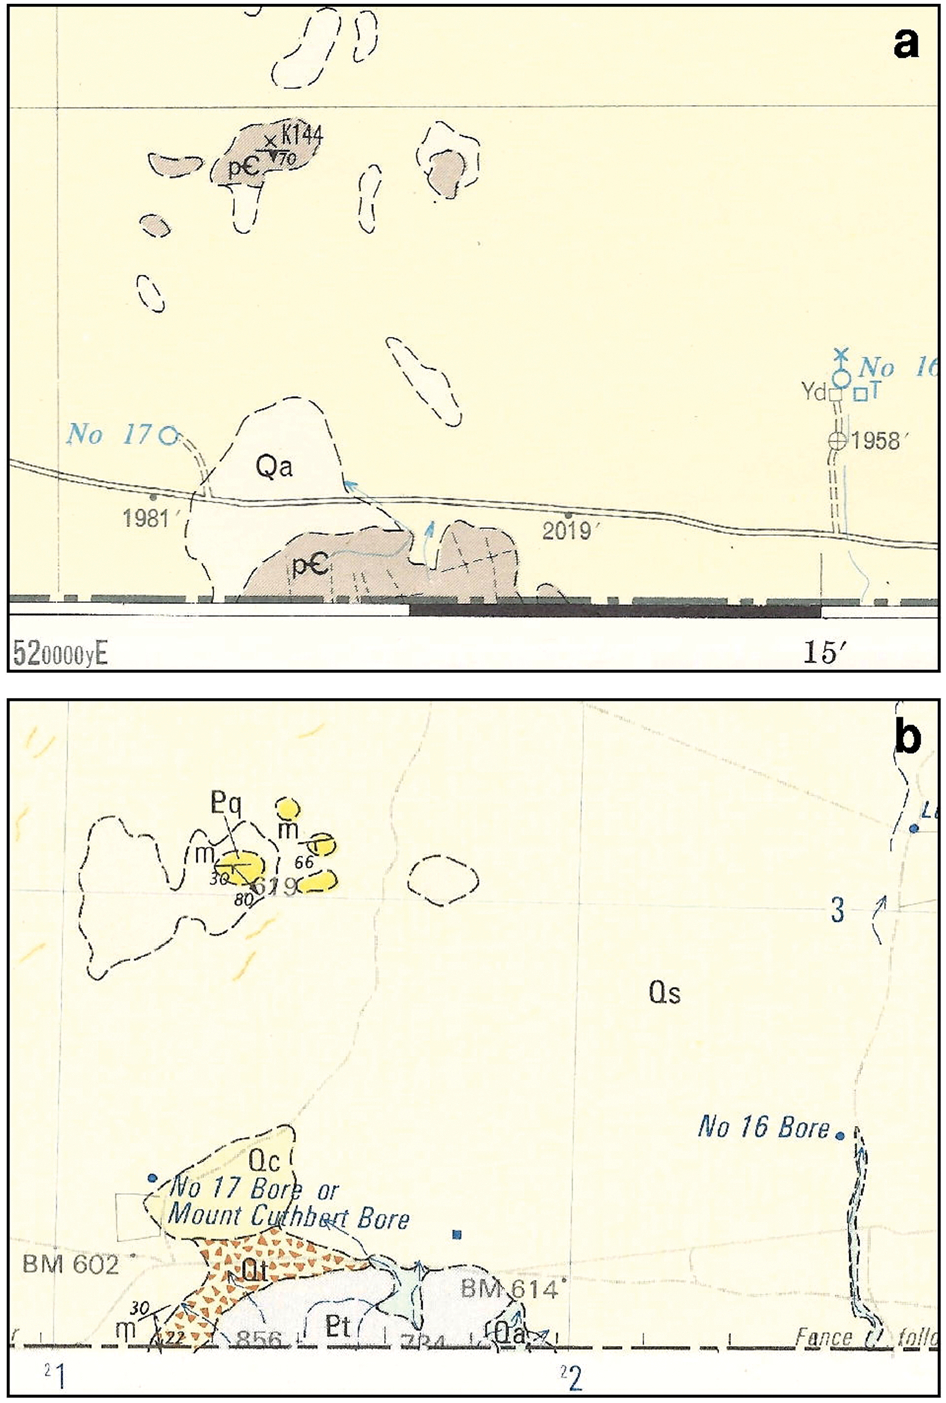
a Part of Kulgera 1∶250 000 geological sheet First Edition published by the Bureau of Mineral Resources (1968), showing unvisited outcrop at southern edge of sheet, mapped as Precambrian schist and quartzite (p€) by inference from mapped outcrops 8 km to the north. Qa–alluvium. Black dots with numerals denote heights above sea level in feet. The map is released under a Creative Commons Attribution 3·0 Australia Licence, and is reproduced by permission of the Chief Executive Officer, Geoscience Australia; b Same area as Fig. 8a, as depicted on Kulgera 1∶250 000 geological sheet Second Edition published by the Northern Territory Geological Survey (1992). Mesoproterozoic: Pq–Sentinel beds: quartzite and schist. Neoproterozoic: Pt–mylonite, ultramylonite, pseudotachylite and granulite dipping south-southeast at 30 degrees with a mylonitic lineation (m) plunging south at 22 degrees. Quaternary: Qt–talus, Qs–sand sheet and dunes (brown lines), Qc–calcrete, Qa–alluvium, BM–survey benchmark with approximate height above sea level in metres. The map is Crown Copyright, and is reproduced by permission of the Director, Northern Territory Geological Survey
In 1968, the BMR flew the first colour air photos of an entire 1∶100 000 map sheet, in the Cloncurry area of Queensland. In the ‘Centre’, the Reynolds Range 1∶100 000 sheet, northwest of Alice Springs, was flown in 1971, and we initially hoped that tinkering with the colour balance might help in distinguishing metamorphic and igneous units from each other. ‘Would everything just appear in shades of red?’ The contractor printed small batches of photos with increased intensities of blue, green, or yellow, but in the end the natural appearance proved to be the best.
When ordering a new set of air photos to be flown, e.g. low-altitude colour photos for detailed mapping, make sure you stipulate the orientation of the runs. We found it easiest to work with the traditional east-west runs. In 1971, the aerial photography contractor for the Reynolds Range area noted that the range trends northwest, and, without consulting the BMR, flew the runs parallel to the range. Therefore, the edges of each photo are oriented northwest and northeast, instead of north and east. This may not seem important, but when mapping and walking on a completely overcast day, the disadvantage immediately becomes obvious, for the photo you are working on no longer has an inbuilt north point. It also means that the photo runs are of different lengths, with the northeastern- and southwestern-most runs only three or four photos long, which is most odd. A few 1∶100 000 sheets, e.g. Prospector in the Mount Isa area, were flown with north-oriented runs, for no seemingly good reason.
The 1960s
Fieldwork for the systematic mapping of the Amadeus Basin began in 1960 in the Rawlinson and Macdonald 1∶250 000 Sheet areas, in Western Australia. The area was particularly remote, being on the edge of the Gibson Desert, where Alfred Gibson, a member of Ernest Giles’ exploration party, perished while they were returning from an attempt to cross the desert in 1874. Topographic mapping of this area by the Division of National Mapping was just starting, and in 1960 the BMR geologists had to produce two geological maps from virtually blank sheets of paper.
Therefore, what were the steps in the BMR's mapping program?
Decide on the scale of the final map
This is essential, for the scale governs the amount of detail that can be shown. The smallest area the unaided human eye can comfortably distinguish when reading is about 1 mm across. At 1∶250 000 scale, this is about 250 m on the ground, therefore there is no point in mapping rock masses or layers smaller or narrower than this, as they cannot be comfortably seen on the map. In fact, where an outcrop is below mappable size but is the only exposure available for many kilometres, it has to be enlarged to mappable size. If you need to show smaller exposures, a useful scale is 1∶100 000, which allows you to show areas down to 100 m across.
Select the party leader
A good party leader is essential. Most of them had a few years’ experience in BMR mapping before becoming a party leader. He or she must be a good organiser and manager, and also need to be able to get on well with the ‘locals’ – pastoralists, farmers, miners, and these days, traditional custodians – and understand indigenous issues. The local homesteaders in the Centre are always grateful for reports on the whereabouts of cattle, broken wind pumps and fences and possible sites for water bores. If there are new graduates in the party, it is an advantage if the party leader has a kindly nature. A new and inexperienced geologist needs to feel that their contribution is necessary to the project, and that the party leader trusts them to do a competent job. They also need to be able to ask the party leader for help and that when they do they will not be made to look foolish.
Determine the types of air photos available
In the 1960s, only B/W air photos were available, the 1∶46 500-scale K-17 set. Better-quality RC-9 B/W photos at 1∶80 000 scale became available in the 1970s. Both these sets cover the whole of Australia. Many parts of Australia were subsequently flown in colour, usually at 1∶25 000 scale. It is best to use the set that requires reduction by 4–6 times to the final scale. Check that the photos cover and indeed extend outside the sheet margins and corners (Fig. 7a and b). If they do not, order the necessary photos from the adjoining sheets.
Obtain the following equipment to take into the field
Topographic (topo) bases. These were produced by the Division of National Mapping (now called the National Geographic Information Group, part of Geoscience Australia), and are large sheets of film at air photo scale, usually 12 or 16 to a 250 000 or 100 000 map sheet, which show existing topographic details – roads, tracks, fences, water courses, bores and dams. In effect, they are the topographic map of your area enlarged to the scale of the air photos you have selected, printed on translucent film, and cut up into manageable sheets. The distortion in the air photos is removed during production of the topo bases.
Photo-overlay sheets – single matte tracing film. ‘Clear-clear’ film is not suitable, being stiff, glossy and difficult to draw on.
‘Chinagraph’ or grease pencils, all colours.
Stereoscopes – pocket and table models, one for each geologist, and where necessary a generator to power the light source on the table models.
Vehicles, sample bags and drums, marking pens (permanent) for labelling samples and drums, wrapping paper for the samples, and, for each vehicle, a two-way radio. (In the 1∶100 000 mapping of the 1990s, we also took with us magnetometers, scintillometers, Emergency Position Indicating Radio Beacons, and Global Positioning System instruments; moreover, the two-way radios had by then been replaced by satellite phones.)
Then do the following
If setting up a base camp (Fig. 9) in a remote area, ascertain the water supply and decide on location of the base camp.
Write to all the landowners in the area where you will be mapping and tell them the arrival and departure dates of the field party, and that you will call in to see them when you first start work on their property.
Obtain permits to work, such as in aboriginal reserves and national parks.
Order food supplies, camping equipment and fuel supplies.
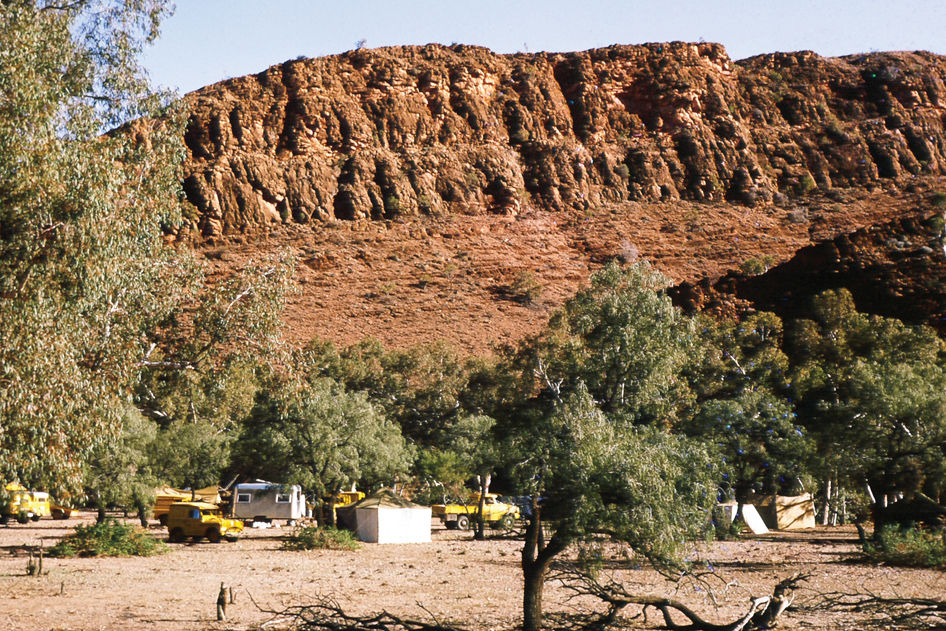
BMR base camp on river gravel in Ross River Gorge, 63 km east of Alice Springs, 1964, showing sleeping tents, vehicles, drafting van (stainless steel) and tarpaulin around poles at far right enclosing bush shower. Cliff in background is Giles Creek Dolomite (early Middle Cambrian) of Amadeus Basin. ©Commonwealth of Australia (Geoscience Australia) 2014. Photo by A. J. Stewart
Vehicles
Four-wheel-drive vehicles (Fig. 10) were indispensable to the mapping, as the northern half of Australia is sparsely inhabited, and vast areas are devoid of roads or tracks. Fieldwork required off-road driving, at little more than walking pace, for days or weeks at a time. The first BMR traverse vehicles were Jeeps that had become ‘surplus’ at the end of the Second World War, but after a year or two, they were replaced by Series I Land Rovers. By 1960 we were using Series 2 Land Rovers, substantially modified with four extra leaves in each spring, steel plates under the engine sump, gearbox and transfer case (where the change from two-wheel to four-wheel drive was effected), bush bars in front of the radiator and extending diagonally up to the outer corners of the windscreen and along the edge of the roof, a second spare wheel, an extra fuel tank and a water tank (115 litres each), both mounted directly behind the front seats. The Land Rovers also had a vertical tubular mounting to hold the antenna (11 metres high) for the two-way radio, which we set up at lunchtime to talk to each other and also to send and receive telegrams to and from the BMR headquarters in Canberra. A small plywood desk was set up in front of the passenger's seat for completing some photo-interpretation and drawing of linework on the air photos after examining each outcrop. The vehicles also carried a large toolbox for fixing punctures and making repairs, a tucker box with eight days’ supply of food and the geologist's and field hand's swags.
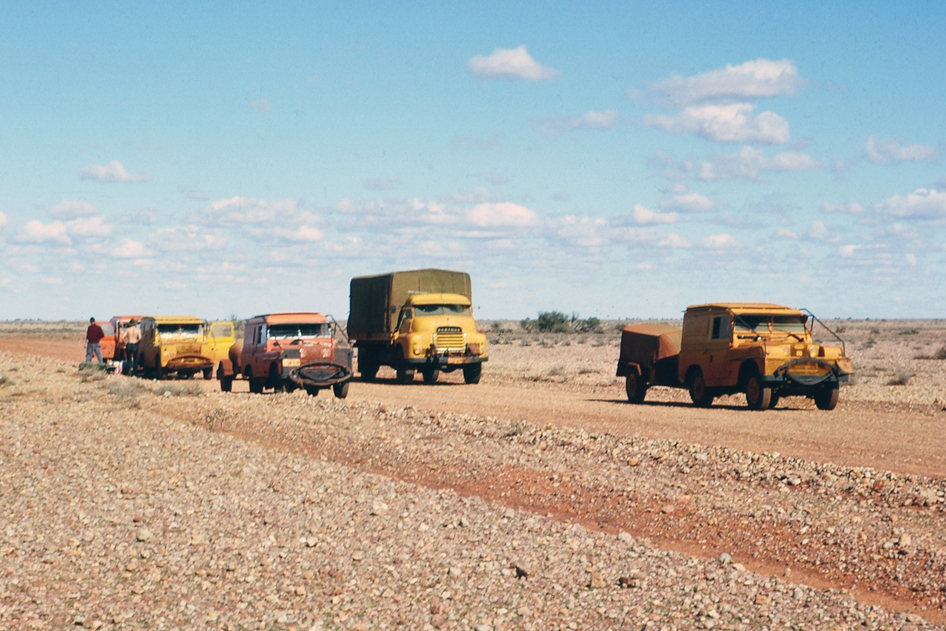
BMR field party vehicles: Land Rovers, box trailer, water trailer and Bedford 3-t truck on Stuart Highway on way to Amadeus Basin, 1963. Each Land Rover has a sun roof fitted above its own roof, and the front bumper bar carries spare springs and vertical scrub guards; scrub-deflecting bars extend diagonally from the guards to the top corners of the windscreen and then along the outside edges of the roof. ©Commonwealth of Australia (Geoscience Australia) 2014. Photo by A. J. Stewart
In addition to the Land Rovers, a field party was also equipped with a two-wheel water trailer or collapsible rubber water tank, a two-wheel box trailer and a 3-t four-wheel drive truck to carry the food and camping equipment for the base camp (Fig. 10). The BMR also did shallow stratigraphic drilling to supplement the mapping (Fig. 11).
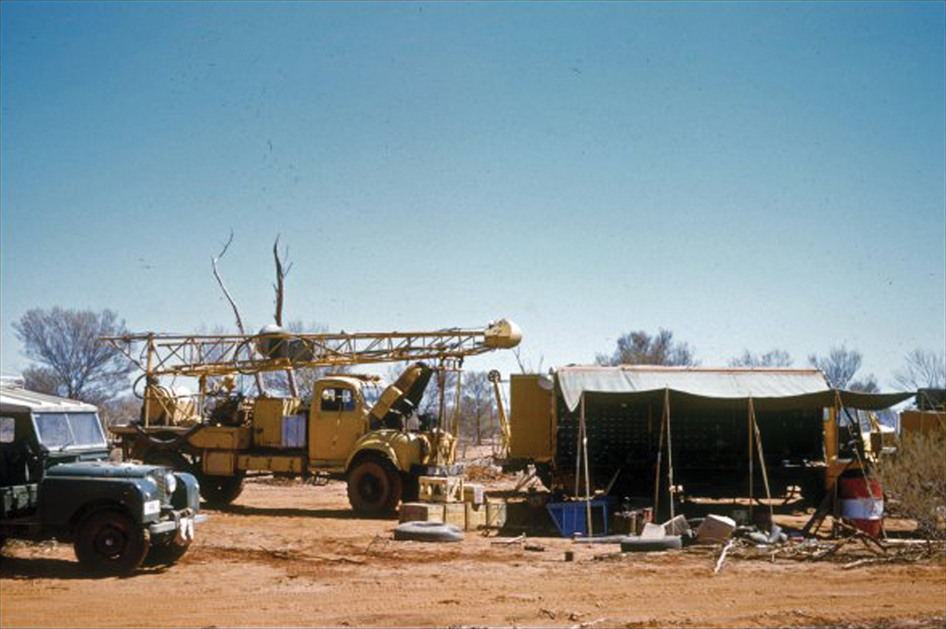
BMR base camp in Officer Basin, 1972, showing Land Rover, truck-mounted drilling rig and mechanic's workshop. ©Commonwealth of Australia (Geoscience Australia) 2014. Photo by D. H. Blake
Fieldwork
When the party is in the field and ready, decide where each geologist is to start mapping. Use their strong points where possible; put soft-rockers in sedimentary areas, igneous geologists in areas of igneous rocks and structural geologists in structurally complex areas.
It is very useful if all the geologists spend the first two or three days together. If possible, visit the areas where all or most of the major rock types are exposed, so that all can see them and agree on terminology for rock types and stratigraphic units. (In the Amadeus Basin, we were fortunate to have two well-exposed sections through the complete basin sequence, the sandstone and shale-rich type section at Ellery Creek, 80 km west of Alice Springs, and the carbonate-rich Ross River section 63 km east of Alice Springs.)
Preparation for traverse work
Before starting off on a week's traverse, each geologist selects the air photos for their mapping area for the week. Take every alternate photo from each run and fasten them together with glider clips so that they overlap correctly. Then clip the runs together, so making a temporary mosaic of the week's traverse area (Fig. 12). Study the mosaic, circle with a grease pencil and then number the areas you plan to visit that week and then connect each area with a line. If there are areas that are difficult or impassable for the vehicle, such as thick scrub or rough, hilly terrain, spend some time working out the easiest route to avoid them. Then undo the temporary mosaic, restore the photos to their correct runs in their numerical order, and you are ready for your week's work.
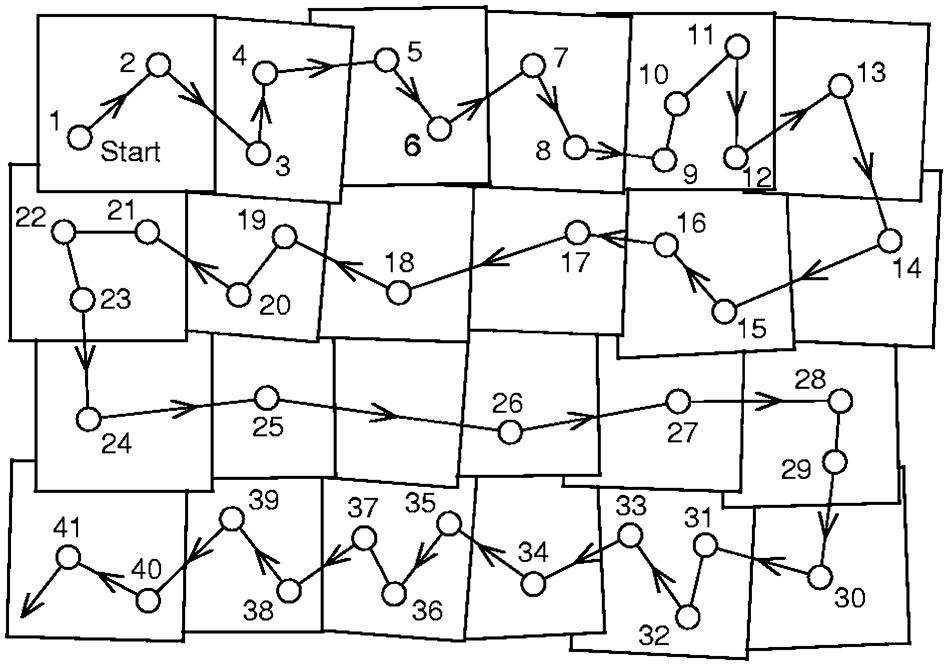
Temporary mosaic of alternate air photos (e.g. even-numbered photos) showing circled areas to be visited in a traverse or week's work. The odd-numbered photos would be used for drawing linework, structural symbols and letter codes
Traverse work
It is useful to look at structurally simple areas first, so as to get used to the differences between similar but not identical rock units. This will help in identifying the different units where they are complexly deformed and faulted – fault blocks of unfossiliferous feldspathic sandstone can look very like one another, as we found in the Davenport Province. Then tackle the complex areas and areas with major discontinuities visible on the air photos.
Recording observations
When you visit an outcrop, make sure you observe it thoroughly enough to understand it – the compositions and structures of each rock type and their relationships to each other. Then, draw some lines on the air photo overlay – geological boundaries, trends, faults, dip symbols and letter codes – for this gives you a small but tangible feeling of accomplishment. Use the air photos that you are not using for navigation during the traverse. Do not draw too much – some things will change as you add data from other areas. In any case, doing photo-interpretation on traverse is not the best use of mapping time; get out and look at the rocks, write down your observations, and do the bulk of the photo interpretation in base camp, where the mirror stereoscopes, with their wider view plus close-up lenses, are much better than pocket stereoscopes.
It is essential to mark every point or place visited on the back of the air photo, and label it with the locality number used in the notebook, and then write your name, year and notebook number at the edge of the back of the photo. Often, in discussions back in base camp or the office, someone will want to know, ‘Have you been there?’
Another essential job is to note in your field books all the evidence for what you conclude. It is tempting, once you are familiar with all the stratigraphic units in a sedimentary sequence, to quickly observe the main characteristics of a new outcrop, such as grain size, thickness and style of bedding, and sorting, conclude that it is, say, the Mereenie Sandstone, and just write ‘Mereenie Sandstone, dip 35 to 110’, and go on to the next outcrop. In the Amadeus Basin mapping, the party leaders drummed into us that we must describe the unit fully, at every outcrop we looked at. It was just as well – back in the office during the writing of the BMR Bulletin on the whole Amadeus Basin, it became clear that a sparsely clay-bearing sandstone at the base of the normally clay-free Mereenie Sandstone was in fact a previously unrecognised formation in the underlying Larapinta Group, overlain with a low-angle regional unconformity by the Mereenie Sandstone. The authors of the Amadeus Basin Bulletin (Wells et al. 1970) were able to go back through our notebooks, and sure enough, the clay-bearing unit had been everywhere faithfully recorded and described. They were able to delineate it on the air photos, add it to the maps, and thereby erect a new formation, the Carmichael Sandstone, many months after the fieldwork had ended. A two-word entry in the notebooks of ‘Mereenie Sandstone’ at each outcrop would have prevented recognition of the new unit.
Moreover, recording all the evidence is essential if you start mapping an area with multiple working hypotheses in mind (although some may regard them as preconceived notions). Multiple working hypotheses are useful in that they make us, or remind us, to look for evidence for our preconceptions, but can be dangerous in that we may miss or subconsciously ignore evidence against them. Recording all the evidence means your overall synthesis will be as good as the fieldwork will allow.
Another useful practice is to ‘always look on the other side of the hill’, as my first party leader, Dave Forman, used to say. In dipping sedimentary rocks particularly, we may feel that we need look only at the scarp side of the hill or ridge, because it shows the layers and formations in cross-section, and so should provide everything we need to study. The dip slope will probably show only the bedding surface of the uppermost layer. True, it usually does, but even a well-exposed scarp or cliff seldom shows everything – scree often conceals the contacts between soft, recessive layers and overlying hard ledge-forming layers. Therefore, we may not be able to tell if granite capped by sandstone intrudes the sandstone or is unconformably overlain by it. However, with any luck, gullies cut into the dip slope may yield the critical exposure. Look at the dip slope even when you think you have all the answers – it is surprising what you sometimes find (Fig. 13). The dip slope is good for finding fossils in Phanerozoic rocks. In areas of horizontal sediments, have a look at what the ants have brought up; they may have sampled a unit that is otherwise concealed below shallow regolith. Note also any vegetation characteristic of certain rocks.
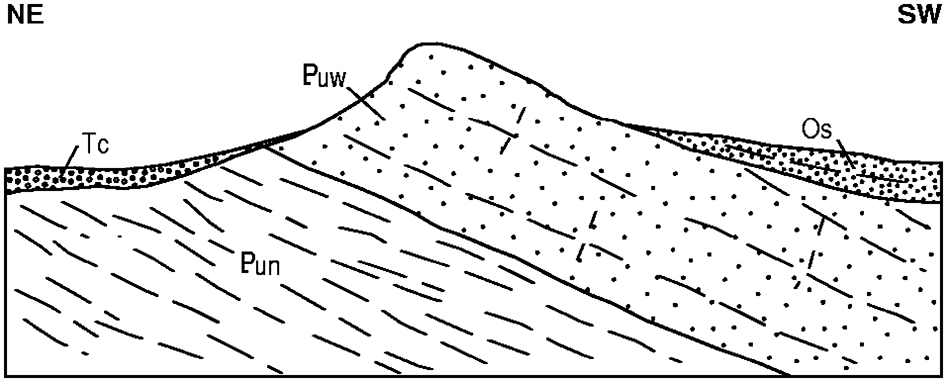
Sketch of ridge of Neoproterozoic Winnall beds (Puw–sandstone) unconformably overlain by Ordovician Stairway Sandstone (Os–sandstone and conglomerate) exposed on dip slope, Kernot Range, Amadeus Basin, 145 km northwest of Kulgera. Pun–Neoproterozoic Inindia beds–siltstone. Tc–Cenozoic conglomerate
One last tip I learnt in my own traverse work was to start the traverse at its most distant point from the base camp. Then, on the last day, when you are longing for a shower and clean clothes, and hoping against hope for no more punctures, the journey to base camp is that much shorter.
Back at base camp
Once back in base camp, complete the linework – geological boundaries, faults, and fold symbols – on the photo overlays from the week's work. Draw the Cenozoic superficial units by photo-interpretation, and use the radiometric image where necessary, it can be very useful in distinguishing regolith units. When starting a new overlay, edge-match the adjoining completed overlay to it – just draw a few millimetres of each boundary or fault on to the next overlay, and add the letter codes for each stratigraphic or lithological unit. This gets the position of the boundary in the right place on the next photo, and keeps the identity of rock-types or sedimentary units consistent.
Production of uncoloured preliminary map
Step 1 Air photo compilation
In the Amadeus Basin mapping in the 1960s, we drew geological boundaries, faults and structural symbols, such as dip and strike of strata, with their values, straight on to the photo with red grease pencils (Fig. 14). When we wanted to change the red linework, it came off with a soft eraser (even more easily with methylated spirits). There was a small amount of difficulty in tracing the linework from the air photo on to the compilation sheets. These were made of translucent plastic film, and when the film was particularly cloudy, tracing the red linework from the B/W air photo was hard work.
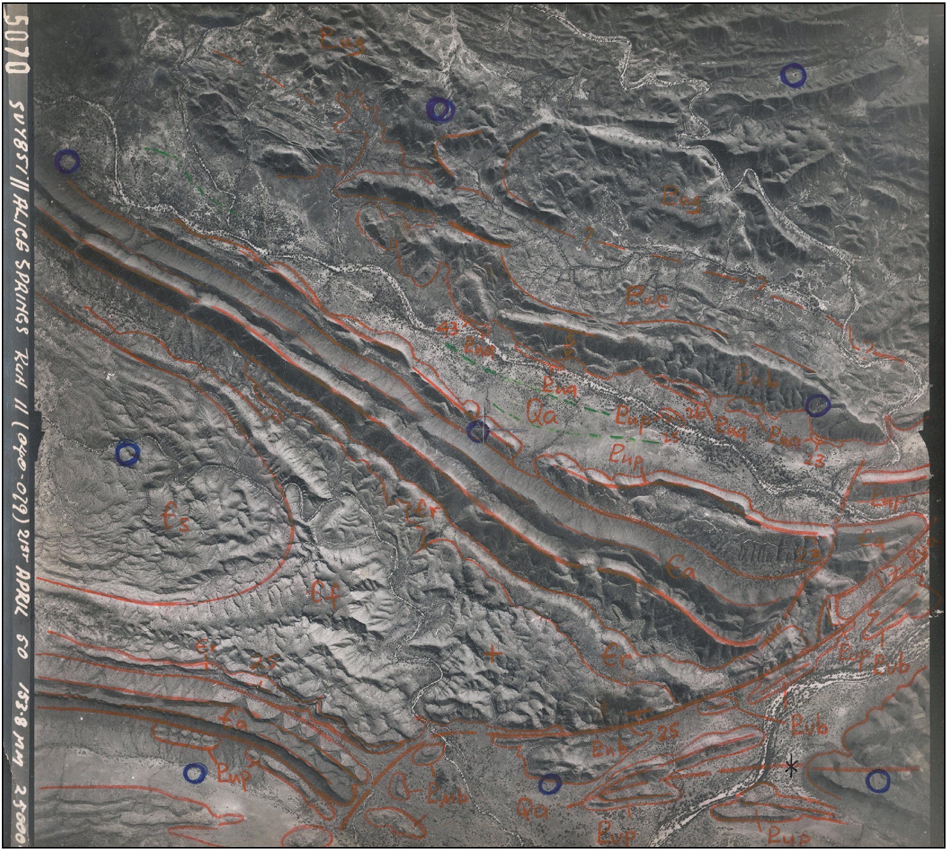
K-17 B/W air photo showing geological boundaries, faults, bedding trend lines, dip and strike symbols and sedimentary formation letter codes drawn directly on photo in red. Green dashes denote track. Neoproterozoic: Pub–Bitter Springs Formation; Pug–Gillen Member; Pue–Loves Creek Member; Pua–Areyonga Formation; Pup–Pertatataka Formation. Cambrian: €a–Arumbera Sandstone; €r–Todd River Dolomite; €f–Giles Creek Dolomite; €s–Shannon Formation. Quaternary: Qa–alluvium. Eastern end of Fergusson Syncline, Allua Well area, 85 km east of Alice Springs, NT. Mapping by A. T. Wells, 1964. Scene measures about 10 km square. Data on left side of photo, from top: photo number; survey number; name of 1∶250 000 sheet; air photo run number; numbers of first and last photo in run (in brackets); day, month and year flown; focal length of camera lens in millimetres; height photo taken above sea level in feet. The air photograph is released under a Creative Commons Attribution 3·0 Australia Licence, and is reproduced by permission of the Chief Executive Officer, Geoscience Australia
When we started using colour air photos in the 1970s, we drew the linework on overlay sheets on each photo (Fig. 15a). We used different colours for the linework – red for geological boundaries, black for faults, green for bedding or foliation trends, yellow for topographic items and blue for watercourses (Fig. 15b). This scheme was of considerable help to the draftsman, as each colour corresponded to a different line thickness.
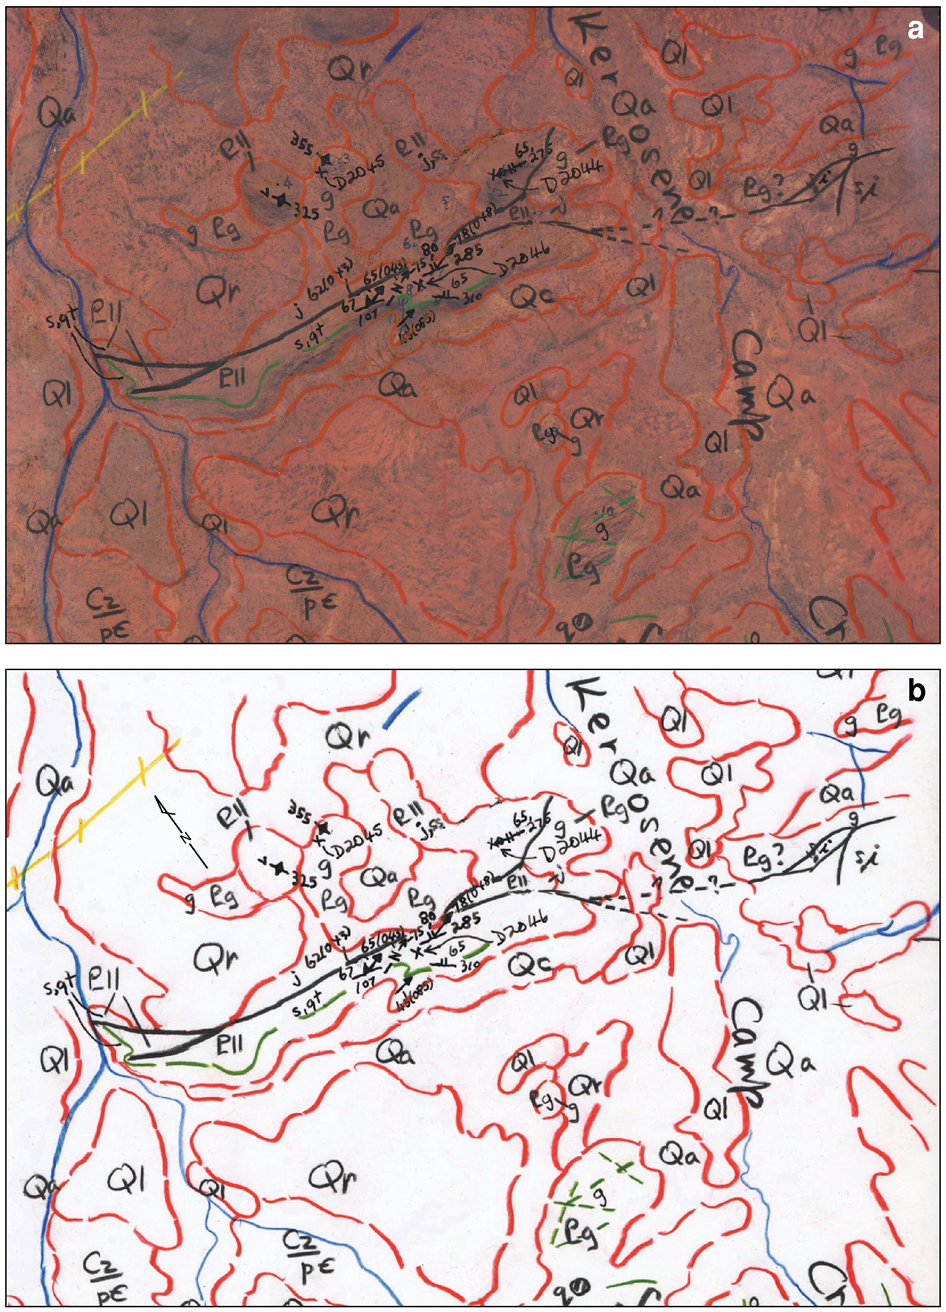
a Colour airphoto with photo overlay, Kerosene Camp Creek area, 150 km north-northwest of Alice Springs, NT. Mapping by A. J. Stewart, 1975. Scene measures 5·7 km east-west. The air photograph is released under a Creative Commons Attribution 3·0 Australia Licence, and is reproduced by permission of the Chief Executive Officer, Geoscience Australia. b Photo overlay from Fig. 15a, showing: geological boundaries (red); faults, dip and strike symbols and their values, formation letter codes, and sample numbers (black); trend of bedding or foliation or joints (green); water courses (blue); fence (yellow). Precambrian: p€-Precambrian rock. Paleoproterozoic: Pll-Lander Rock Formation; Pg-granite. Cenozoic: Cz-sedimentary rocks. Rocktype abbreviations: g-granite; i-cordierite gneiss; j-quartz-rich metasediment; q-vein quartz; qt-quartzite; s-muscovite-biotite schist; ss-metasandstone; v-garnet-biotite gneiss. Reproduced by permission of the Chief Executive Officer, Geoscience Australia
Aerial photographs have some radial distortion caused by the camera lens, and this increases in amount towards the edges of each photo. In the compilation sheets, this distortion is removed. Each K-17 air photo had nine photo control points pre-plotted on to it by the Division of National Mapping – a centre point and eight wing points (Fig. 16, full circles). The nine control points are visible as small blue circles in Fig. 14. Two of the wing points, numbered 2 and 3 in Fig. 16, correspond to the centre points of the two adjoining photos to the east and west. The three wing points numbered 4, 5 and 6 above and 7, 8 and 9 below the central three are plotted on small but recognisable features such as a prominent tree or creek intersection, and which can be matched exactly to the same features on the adjoining photos to the north and south. On the compilation sheet, the eight wing points for every alternate photo are pre-plotted in their correct positions by the Division of National Mapping, i.e. with the radial distortion removed (Fig. 16, dashed circles).
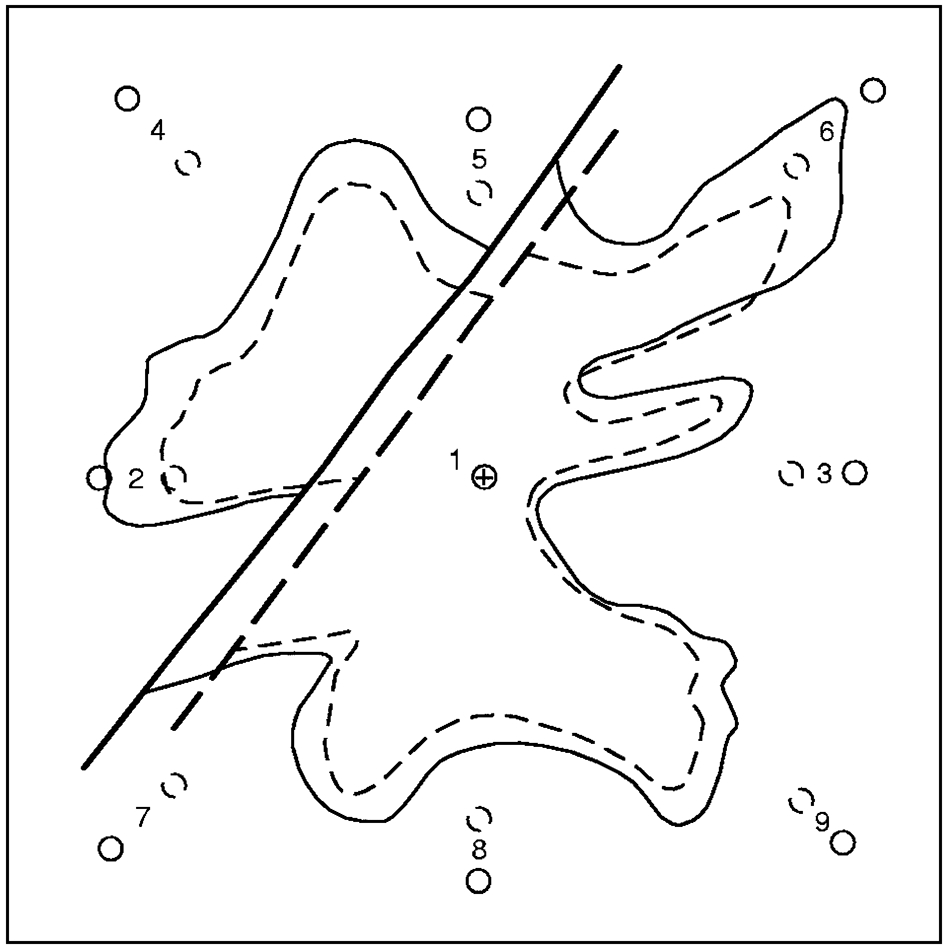
Diagram of air photo showing nine photo points (full circles 1-9), a geological boundary and fault (full lines), and their corresponding positions (dashed circles and lines) on the compilation sheet for the same area
Step 2 Tracing linework on to compilation sheets
When tracing linework from the air photo to the overlying compilation sheet, the line work has to be continually adjusted. For example, a small area of linework near or around a control point on the air photo, e.g. wing point 6 – full circle in Fig. 16 – can be drawn near or around the corresponding photo point on the compilation sheet (Fig. 16, dashed circle 6). A small area of linework halfway between control points 1 and 4 on the air photo has to be drawn halfway between the dashed photo points 1 and 4 on the compilation sheet. Areas of linework within the polygonal areas between four photo points have to be similarly drawn nearer to the centre point by judicious and skilful adjustment by the compiler, at the same time keeping a boundary on the correct side of any hill or nearby watercourse. An entire air photo of linework finishes up nearer the centre of the corresponding part of the compilation sheet (Fig. 16, dashed lines), with linework farthest from the centre point moved in the most. This is why geological boundaries were shown as approximate on the BMR maps.
Step 3 Reduction
When all the compilation sheets (Fig. 17a) – usually 12 or 16 – of a map were finished, the draftsman photographically reduced them to final scale (Fig. 17b).
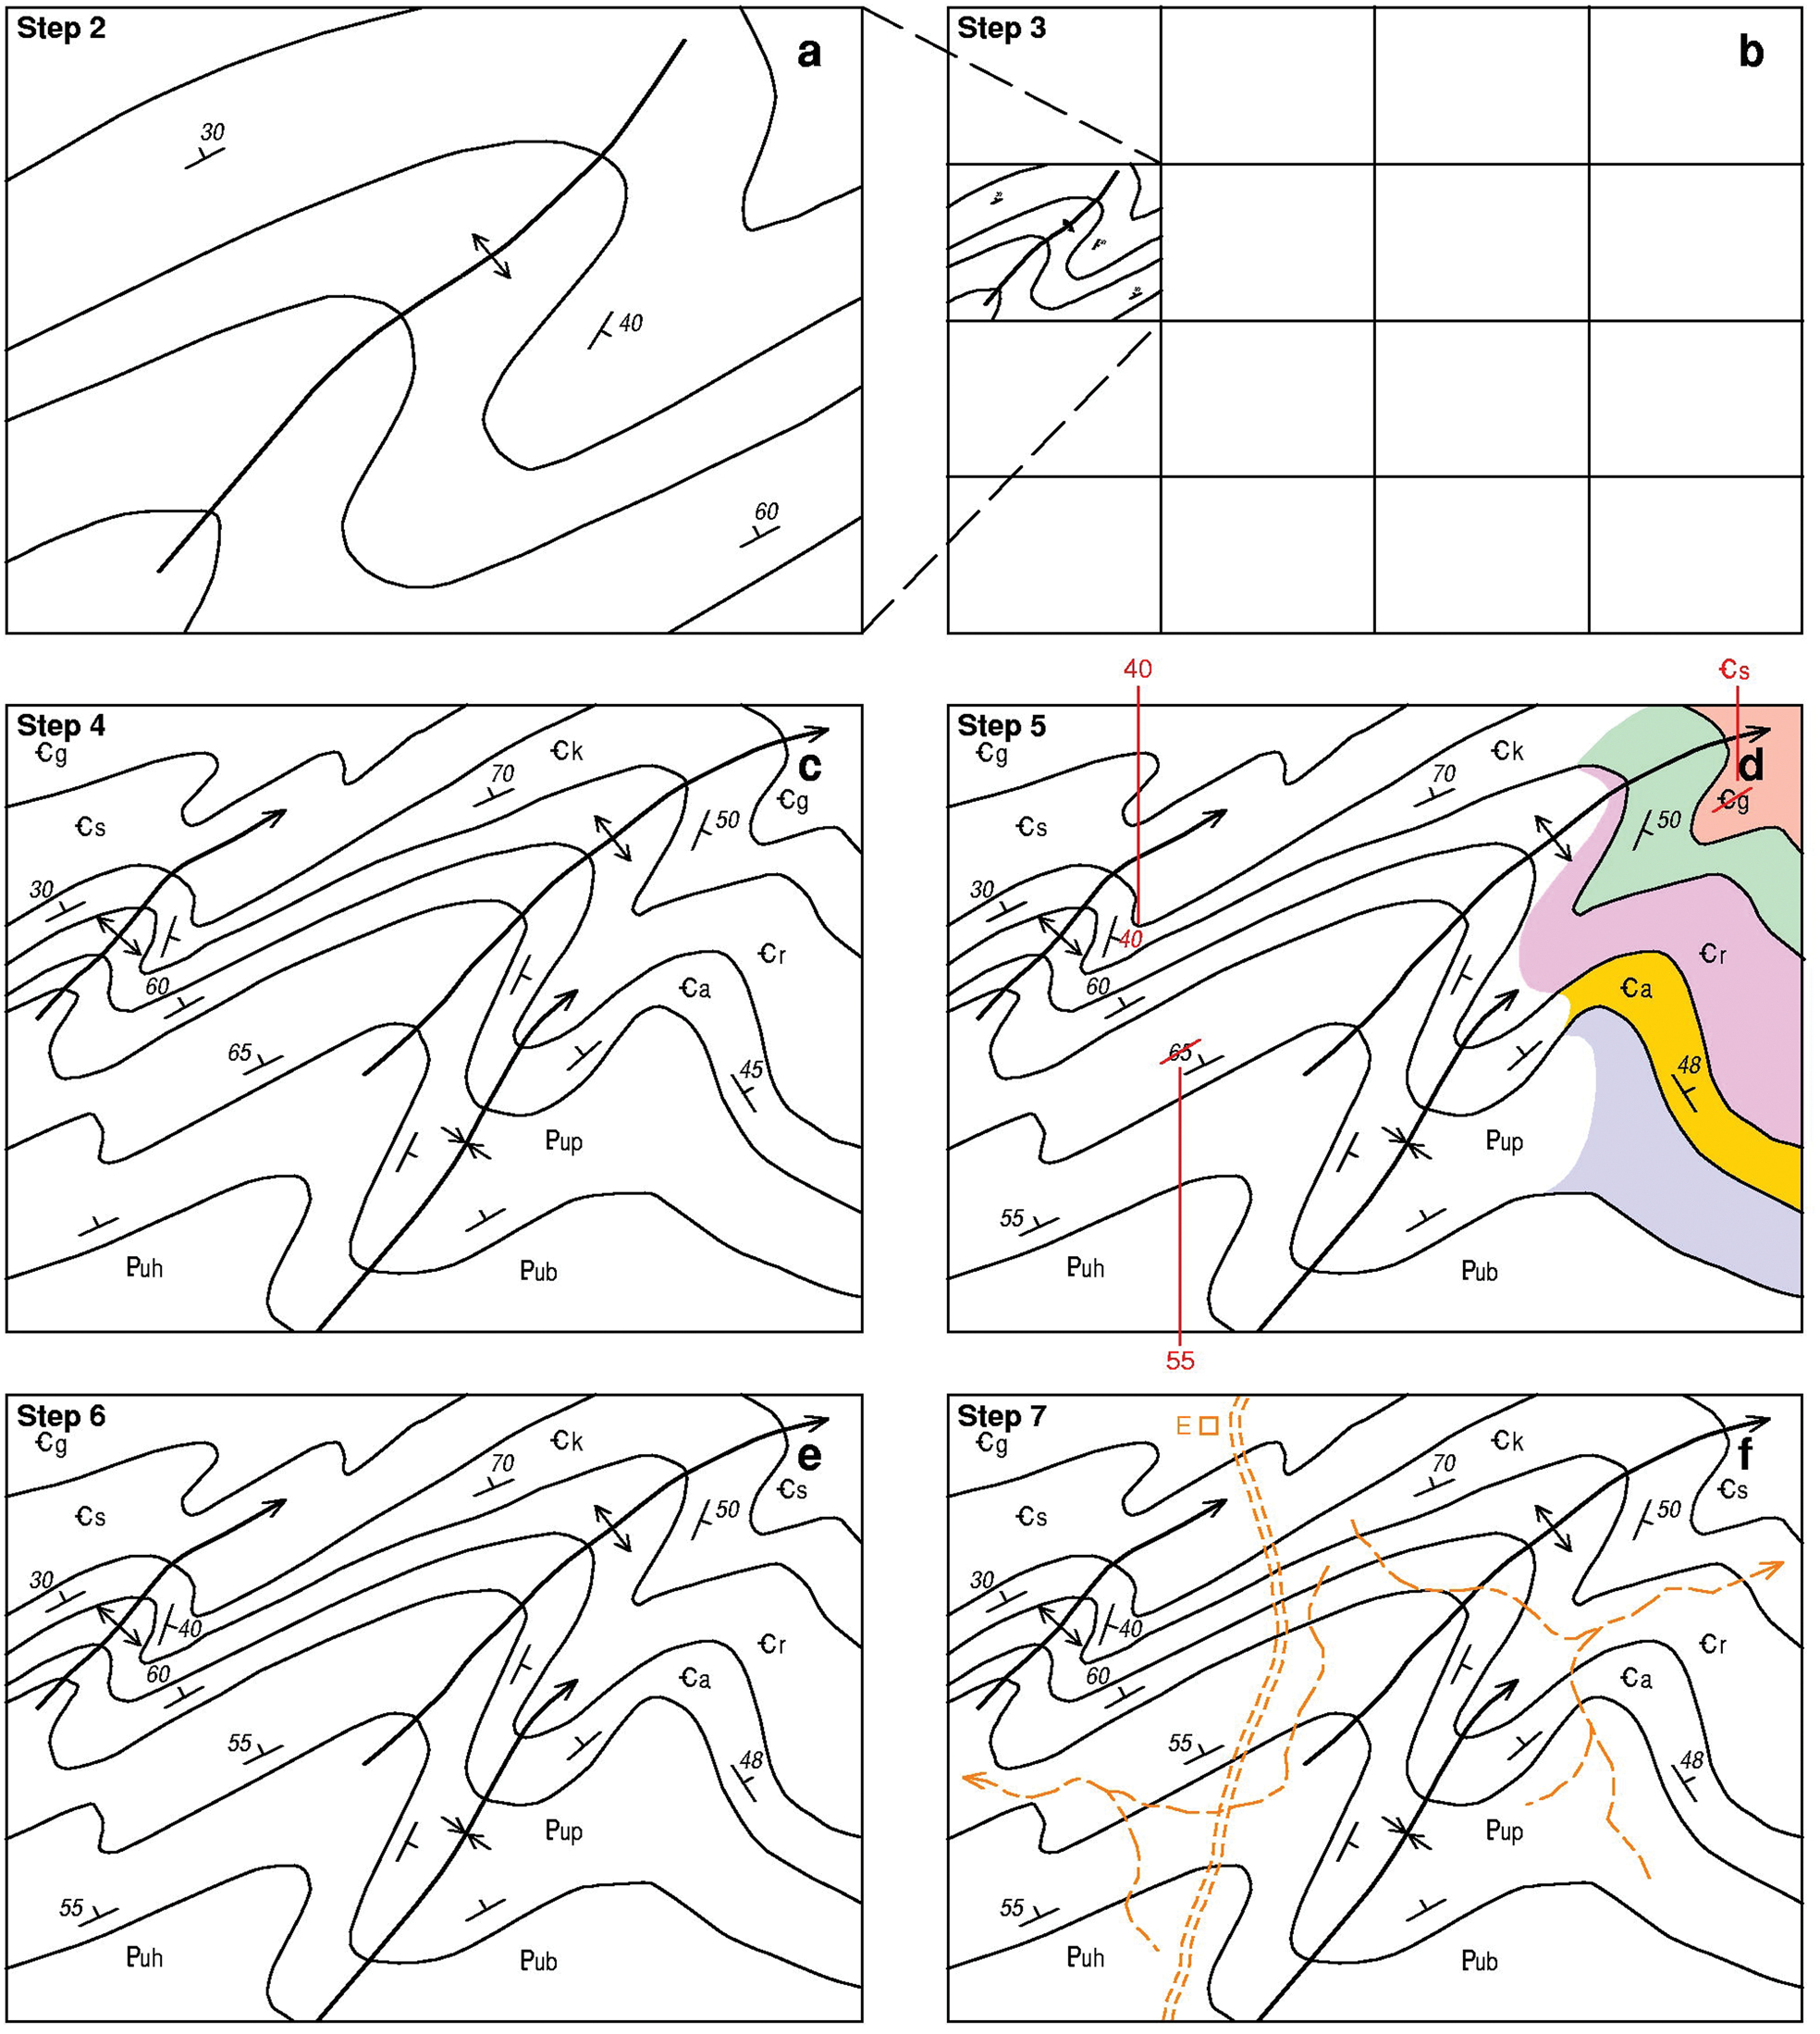
Steps in production of uncoloured preliminary geological map; step 1 shown in Figs. 14, 15a and 15b. a Step 2: one of 16 compilation sheets at air photo scale that make up a 1∶250 000 map sheet; b Step 3: photographic reduction of compilation sheet to final map scale; c Step 4: drafting of geological sheet – linework, letter codes and structural symbols at final scale on to stable film; d Step 5: geologist checks map by hand colouring and marks up errors – three shown; e Step 6: draftsman makes corrections. Steps 5 and 6 repeated until map is free of errors; f Step 7: printed map – geological sheet and topographic sheet (supplied by Australian Land Information Group) showing track (double dashes), earth tank (E), and watercourses (long dashes with arrowhead in downstream direction)
Step 4 Drafting
The draftsman drew the map on stable film placed over the reductions (Fig. 17c).
Step 5 Checking
The map then had to be checked. The draftsman made a paper print on an ammonia dyeline printer, and the geologists coloured it up with colour pencils (Fig. 17d). This revealed errors in line work, labelling, incomplete boundaries and missing values from structural symbols. The hand colouring was a laborious and somewhat unpopular task, but it was the only way to check a map or compilation sheet at the time. It had the advantage of forcing us to look closely at everything on the map and in so doing we became familiar with the geology of places where we had not been. This was very useful in writing the report on the map area, as each author was assigned various units to write up, and so you had to be familiar with your assigned units all over the map, not just in the areas that you had mapped.
Step 6 Corrections
The draftsman made the corrections (Fig. 17e), followed by another check and further corrections until the map was finished.
Step 7 Printing
Several hundred copies of the hand-drawn uncoloured map – geological plate and topographic plate – were printed (Fig. 17f), and 50 copies accompanied the 50 typed copies of the report (produced on a duplicating machine) on the results of the fieldwork, which got the map out quickly, usually before the next field season started.
Production of coloured first edition map (summarised from Stewart 2014)
Step 1 Scribing
The draftsman traced the line work on to near-opaque films with a scribing tool – a fine cutting tool that rolled on three small legs and produced a smooth, sharp line of constant width (Fig. 18a).
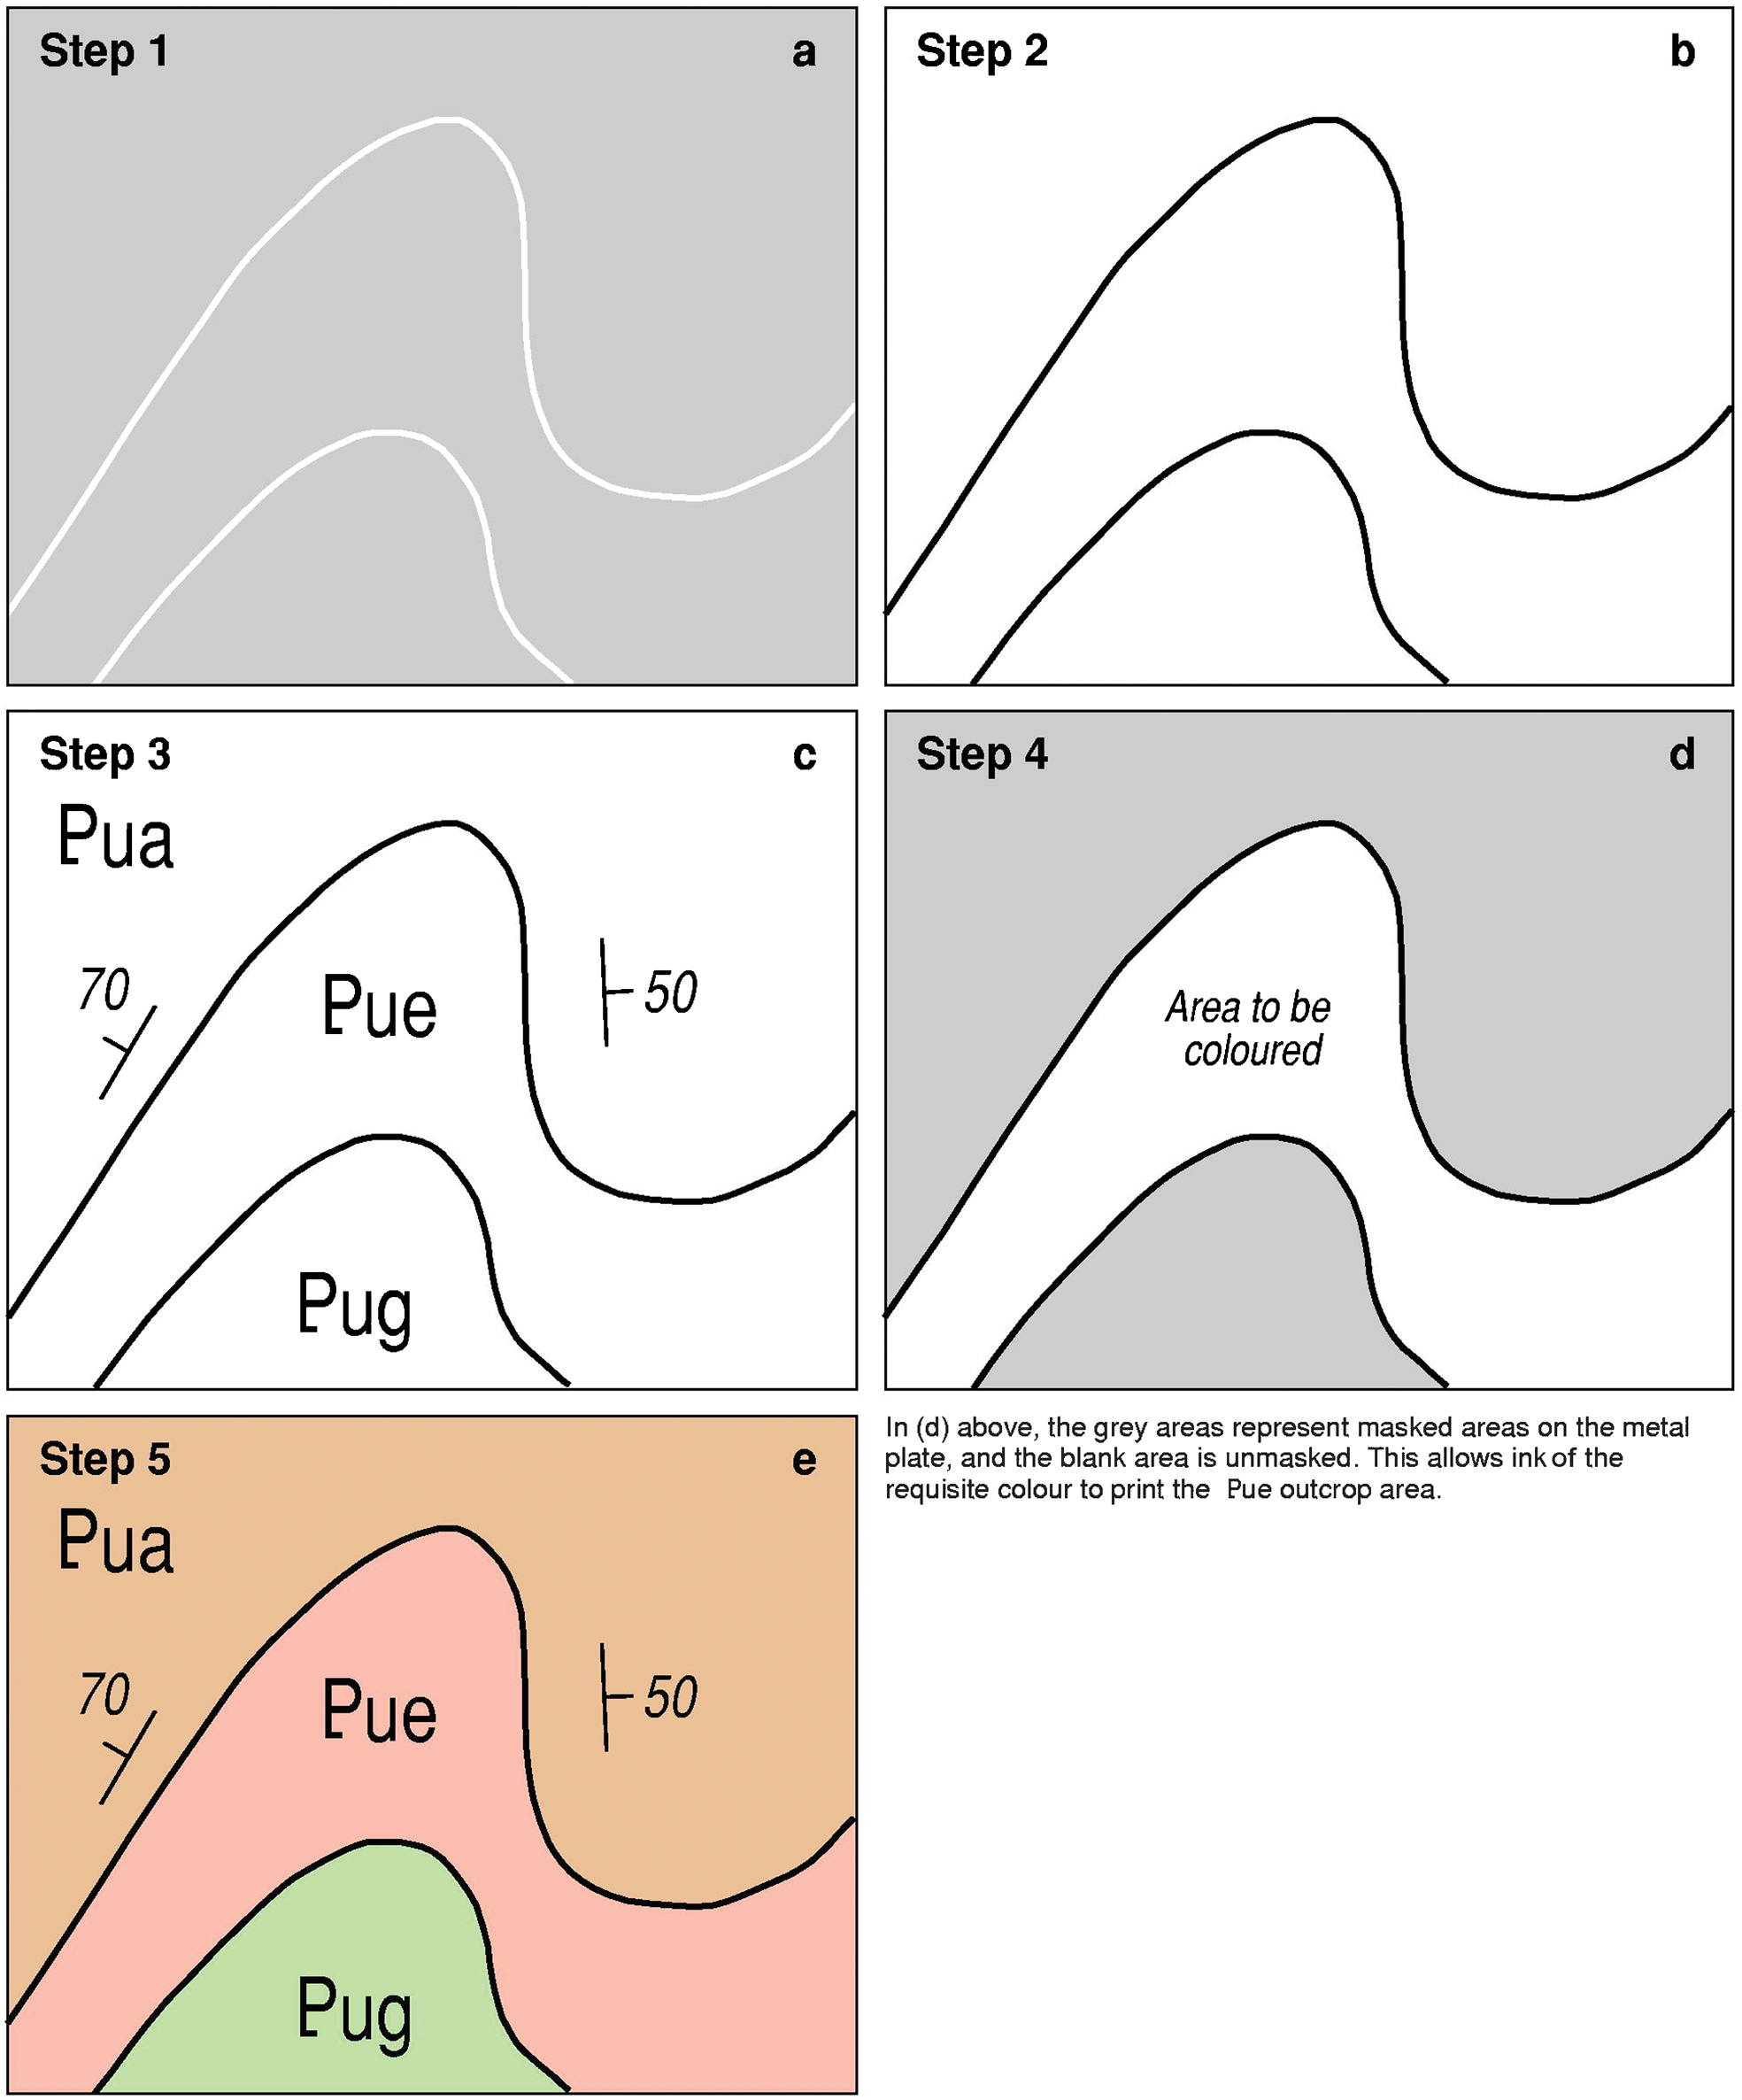
Steps in production of coloured first edition geological map (enlarged). a Step 1: scribing of linework on to opaque plastic film; b Step 2: Transformation of scribed opaque film to positive transparent film; c Step 3: attachment of machine-produced lettering and structural symbols on to positive transparent film and printed in black directly from this. Watercourses (not shown) were also printed, in blue, directly from a separate positive transparent film; d Step 4: Transformation of positive films to metal printing plates for outcrop areas requiring colour. Masks applied to the metal plates allowed the printers ink to print only the desired outcrop areas; e Step 5: part of a printed geological map
Step 2 Opaque films to positive films
The opaque films were then transformed into positive transparent films (Fig. 18b).
Step 3 Lettering attached
Lettering and symbols were typed into a machine that produced transparent plastic strips that the draftsman glued on to the film in the required place (Fig. 18c). The small plastic strips tended to fall off during subsequent handling, and so this film was photographed and a single clear positive film produced.
Step 4 Printing plate and masks
A colour scheme for the rock units was then designed: sedimentary and metamorphic rocks by age, igneous rocks by composition. There could be up to 15-colour plates. At the printer, the clear positive films were transformed into metal printing plates, one for each colour. Masks were applied to each printing plate to allow the printers ink to print only the outcrop areas for that colour (Fig. 18d).
Step 5 Printing
Each sheet of paper went through the printing press multiple times, e.g. three times to produce a three-colour map (Fig. 18e), 15 times to produce a 15-colour map.
Australian map printers were masters of these techniques, especially keeping the paper sheets ‘registered’ so that colours did not stray away from outcrop boundaries during the multiple passes through the printing press, and won several international awards for their geological maps.
Stratigraphic nomenclature
The naming of rock units in Australia is best done by following the recommendations of the International Stratigraphic Guide (Murphy and Salvador 1999), which grew out of National or Regional Stratigraphic Codes, including the Australian Code of Stratigraphic Nomenclature. Its main aim is to ensure that each rock unit has a unique name. Therefore, names that have the same geographical term preceding the lithological term, such as ‘Top Ashdown Sandstone’ and ‘Top Ashdown Pebble Bed’, do not conform with the Guide, and can be confusing. The mapping of central Australia identified many new stratigraphic units, and their naming followed – indeed, was governed by – the Australian Code.
Conclusion
Even in the most remote areas, Australia's geology has been completely mapped in reconnaissance at 1∶250 000 scale, and parts of it at 1∶100 000 scale (i.e. detailed reconnaissance). This means that a geologist can now look at a geological map of any part of the Australian continent, and get an idea of the rock types present and their relationships. The mapping demonstrated the necessity to record all the evidence, phenomena and structures at an exposure, before synthesising them towards the end of the fieldwork.
The geological mapping of central Australia by the BMR was an inspiring and rewarding time. The Centre is harsh, dry and silent. The colours are magnificent – red rocks and sand under a blue sky, and after rain we would walk through gardens of wildflowers. We made several previously unrecognised geological discoveries: oil while drilling for Ordovician phosphate, Neoproterozoic evaporites, two separate episodes – the earlier in the Neoproterozoic-Palaeozoic, the later in the Late Palaeozoic – of large-scale thrusting and nappe formation deep in the Precambrian interior of the Australian continent, and some unusual minerals – corkite, variscite, bloedite, native sulphur and kornerupine (corkite PbFe3[(OH)6:SO4:PO4]; variscite AlPO4.2(H2O); bloedite Na2Mg(SO4)2.4(H2O); kornerupine (Mg, Fe2+)4(Al, Fe3+)6(SiO4,BO4)5(O, OH)2 – a boron-bearing ‘relative’ of cordierite (Mg, Fe)2Al3(Si5AlO18)). Much of central Australia had never previously been examined, and it was of great satisfaction to know that we were making the first systematic geological maps of the region, and deciphering its geological history.
Footnotes
Acknowledgements
I thank Neil Phillips for inviting me to write this review. Erwin Feeken patiently explained the intricacies of map printing. Comments from Dean Hoatson, John Casey, Neil Phillips and an anonymous reviewer greatly improved the manuscript. Joe Mifsud drew the diagrams. Jane Black, Peter Butler, Elizabeth Fredericks and Karen Scott, all of Geoscience Australia, provided materials for Figs. 1, 3, 4, 5, 6, 9, 10 and 11, which are ©Commonwealth of Australia (Geoscience Australia) 2014. To all of them, my sincere thanks.