
Abstract
The Brahmaputra River of Bangladesh is a potential source of significant amounts of heavy mineral (HM) sand concentrates. This study provides the first ever reported characterisation data for a bulk titanium-rich HM sand sample sourced from the river system. The prepared concentrate contained ∼10–15 wt-% HMs with the remaining 85–90 wt-% of the sample comprising silicate and aluminosilicates. Modal analysis for the Fe- and Ti-rich components indicated that the HM concentrate contained 4·7% primary ilmenite, 4·4% Fe-oxide (magnetite), 0·91% titanomagnetite, 0·94% titanite and 0·08% rutile. Quantitative analysis of the ilmenite component showed the TiO2 content of the ilmenite was within the range 40–52 wt-%TiO2 (average ∼48 wt-%TiO2) with major impurities including MnO (1·83 wt-%) and MgO (0·20 wt-%) and minor impurities being Al2O3 (0·02 wt-%), Cr2O3 (0·03 wt-%), SiO2 (0·08 wt-%) and V2O5 (0·08 wt-%). Based on the composition of ilmenite and current specifications regarding ilmenite compositional purity, the most likely method for processing would be via the sulphate route.
Introduction
Bangladesh has known deposits of heavy mineral (HM) sand occurrences along the southern and eastern coastlines. The HMs were deposited in these regions largely as shoreline placer deposits in association with the formation of sand dunes (Zaman et al. 2012). The current focus of exploration for HM beach placers is along a 120 km coastal section extending between Cox's Bazar and the Naf Estuary, both located on the eastern side of the Bay of Bengal (Fig. 1; Mitra et al. 1992, Islam 1997, Bari et al. 2011, Zaman et al. 2012). Up to seventeen (as of 2012) mineral sand occurrences are known within the region with an average deposit comprising up to ∼23% HMs (Zaman et al. 2012) and estimated resources of 4·35 Mt. The key economic HMs present in the deposits include ilmenite, magnetite, zircon, rutile, garnet, leucoxene, kyanite and monazite.
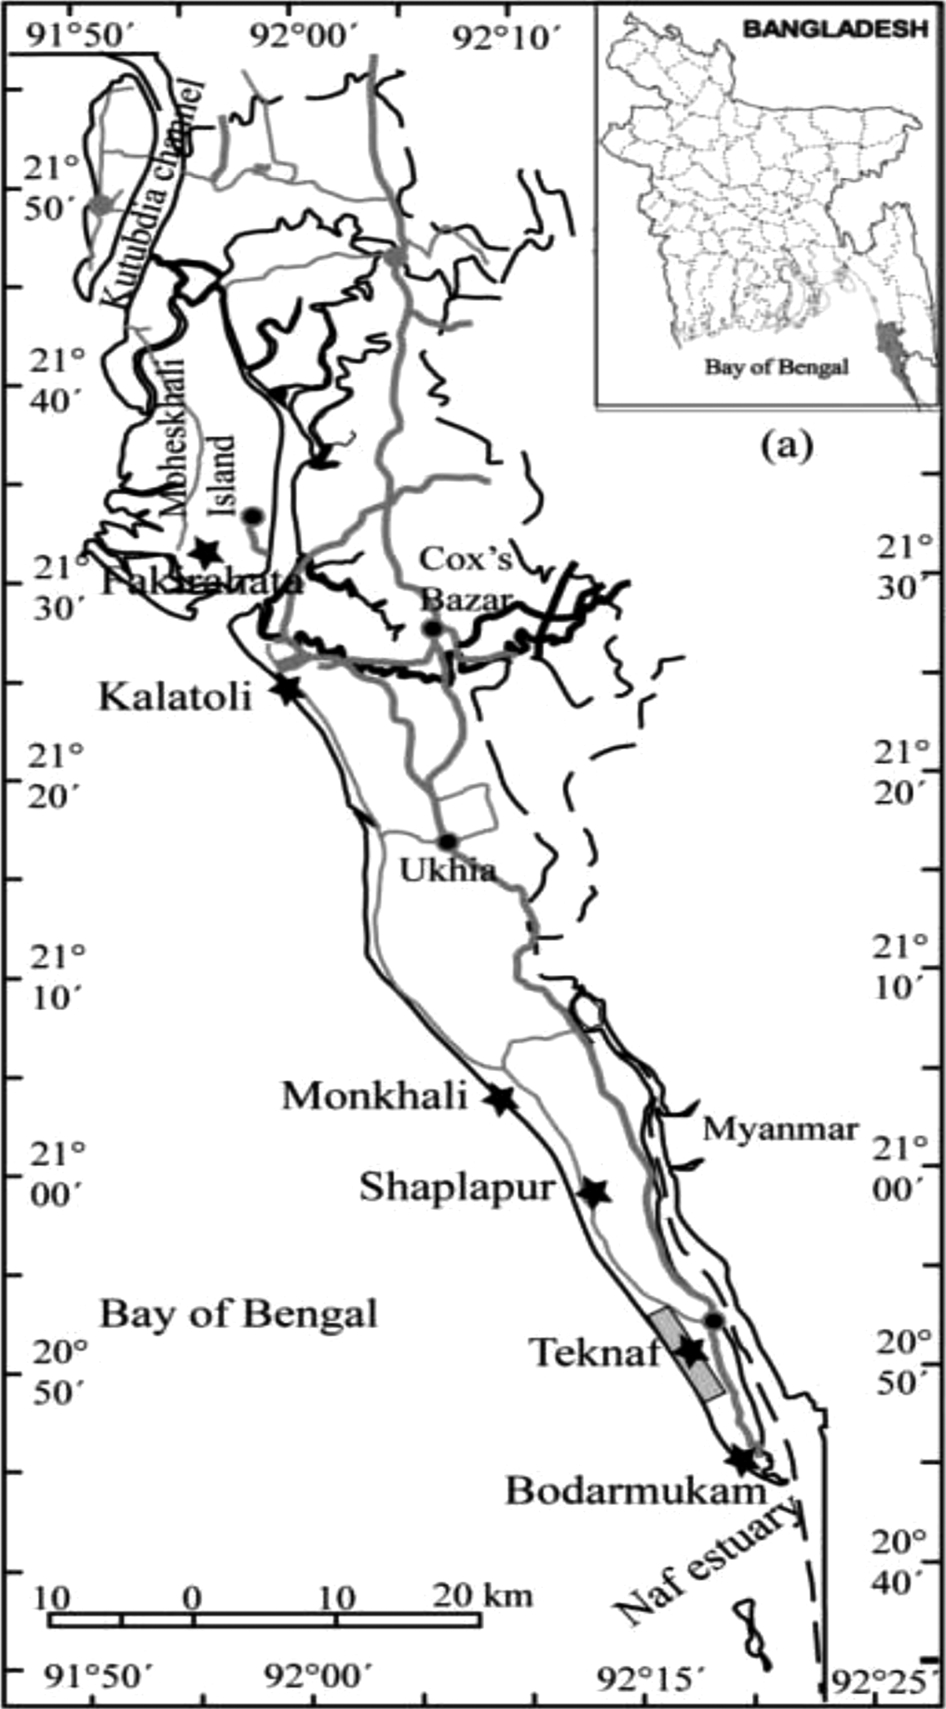
Location of HM placer deposits along the eastern panhandle of Bangladesh. These deposits are the primary focus of current HM sand exploration in Bangladesh (figure modified from Zaman et al. 2012)
While current HM exploration focus is centred on the high-grade coastal sand deposits, there is considerable potential for sourcing HMs from other regions in Bangladesh. Non-marine alluvial sand placer deposits are also known to be sources of HMs, e.g. Gbangbama deposit in Sierra Leone (Force 1991), central Kalimantan, Borneo, Indonesia (Aral et al. 2008). Compared to HM sand accumulations in beach sand deposits, the concentration of HMs in river sands is generally lower, with as little as 5–10% total HMs (cf. up to 23% total HM in beach sands – Force 1991). Heavy mineral river deposits may be prominent in Bangladesh as the river and drainage systems within Bangladesh are extensive, carrying large quantities of sandy sediments to the coastal regions, e.g. the Brahmaputra River carries an estimated 7·35–8·00×108 tonne of sediment per year (Coleman 1969, Rahman et al. 2012). The alluvial sediments contain both light and HMs with the HMs generally deposited on the bed of the river systems forming HM-rich sand bars. A list of minerals commonly associated with HM sand deposits, alluvial and beach placer, is provided in Table 1.
Common minerals associated with heavy mineral sand deposits
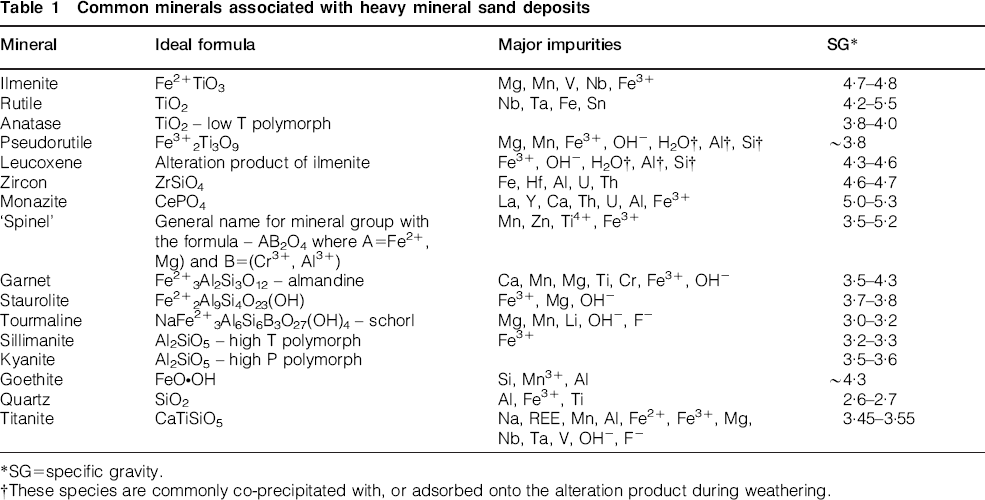
SG = specific gravity.
These species are commonly co-precipitated with, or adsorbed onto the alteration product during weathering.
Recent research by the Bangladesh Council of Scientific and Industrial Research (BCSIR) has concentrated on assessing the HM potential of the Brahmaputra River, which originates in Tibet, flows through the north-eastern part of India and enters Bangladesh in Nagaswari Thani within the Kurigram District (Rahman et al. 2012). The Brahmaputra is a large scale sand-bedded braided river system of ∼15 km width, with individual channels 2–3 km wide (Coleman 1969, Rahman et al. 2012). Preliminary work by the Institute of Mining, Mineralogy and Metallurgy, a subsidiary organisation of BCSIR, to study the mineralogy, morphology, magnetic properties and composition of HM bearing sands from the Brahmaputra river identified that the main magnetic minerals of economic value included ilmenite, magnetite and garnet with a grainsize of 125–250 μm. Non-magnetic HMs represented were: zircon, rutile, xenotime, monazite and sillimanite/kyanite (Rahman et al. 2012).
Based upon the emerging potential of the Brahmaputra River to become a significant HM resource, a preliminary bench-scale study was undertaken at CSIRO of material sourced from stable sand bars in the Brahmaputra River in the Kurigram District, north-eastern Bangladesh (Fig. 2). The aims of the study were:
to conduct beneficiation tests in order to produce a titanium-rich, ilmenite fraction for further characterisation testwork
to determine the chemical and mineralogical characteristics of the titanium-rich fraction using a number of analytical techniques including optical and scanning electron microscopy, X-ray fluorescence (XRF) spectroscopy, X-ray diffraction (XRD) and electron probe microanalysis (EPMA)
to characterise the Ti-rich ilmenite content of concentrate in order to provide an initial assessment of potential ilmenite processing options and market suitability.
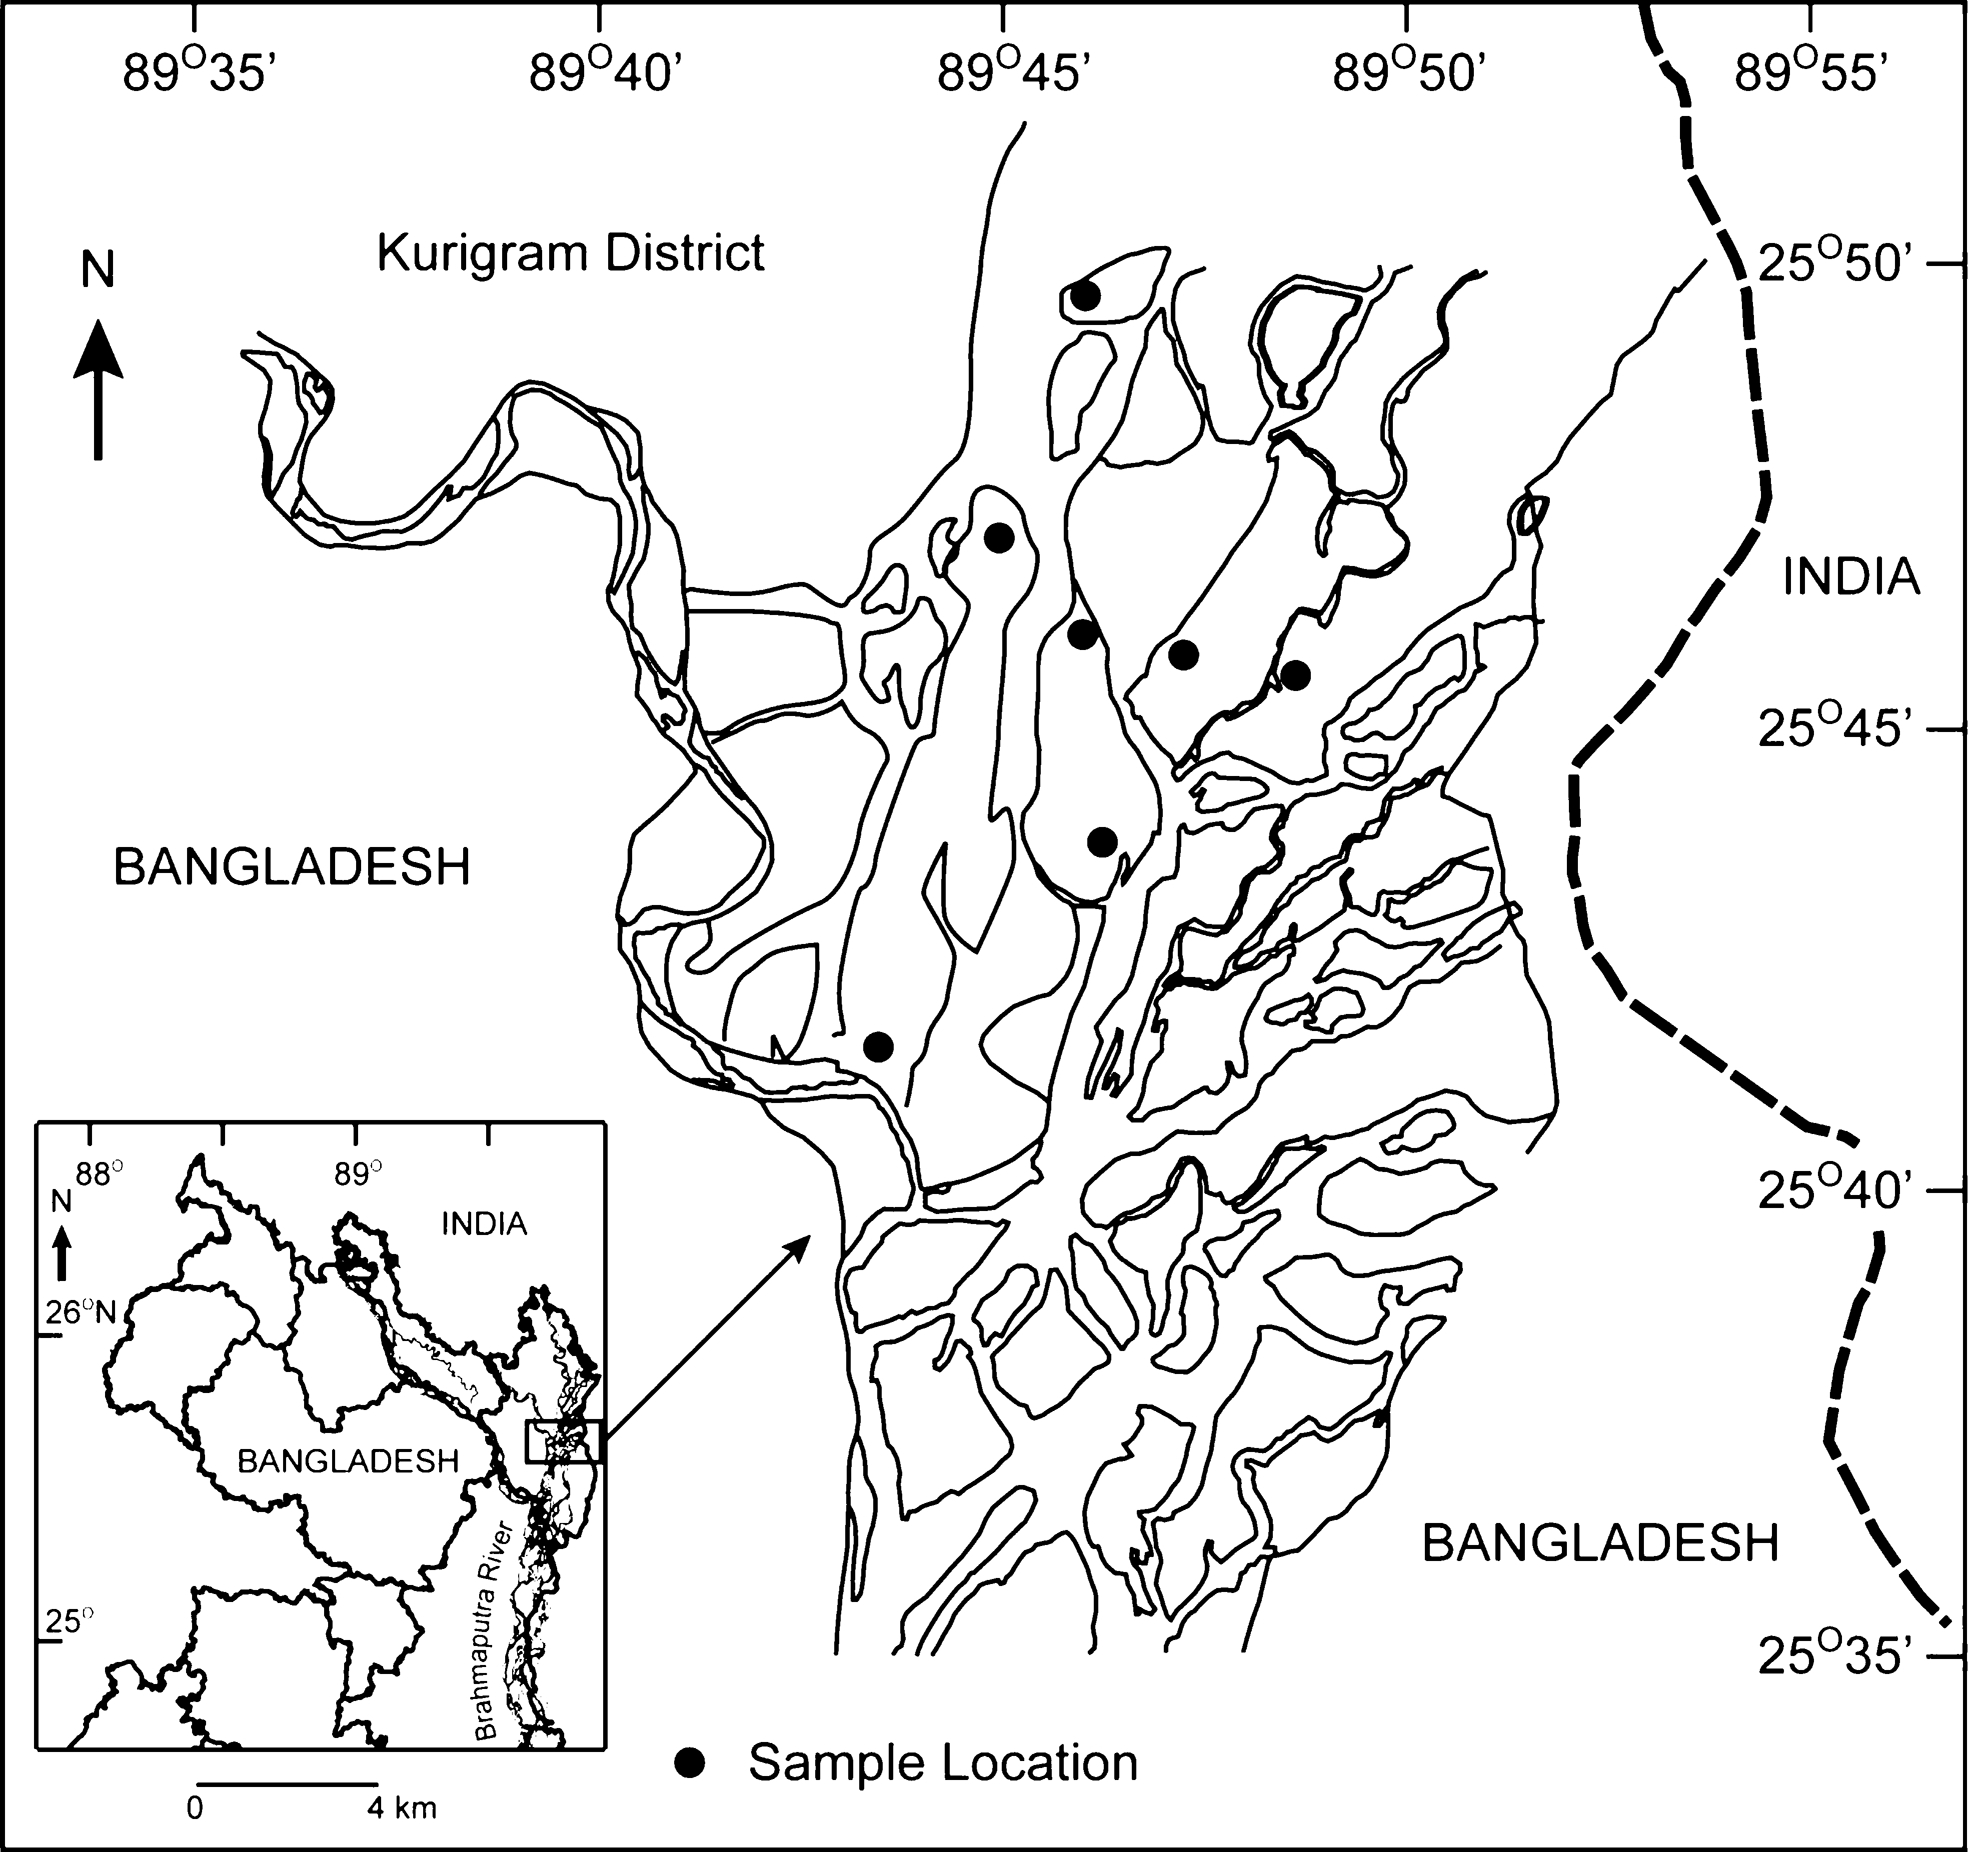
Location map showing the present study area (after Rahman et al. 2012)
Implications of the mineralogy, chemistry and beneficiation testwork for future processing are discussed.
Experimental
Preparation of bulk HM concentrate
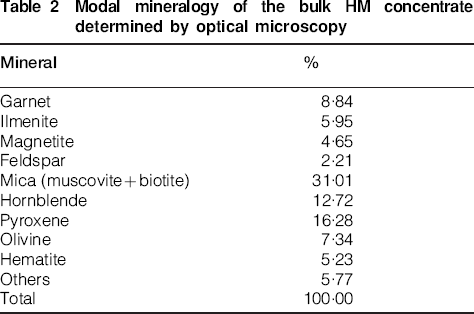
Seven sand samples from ∼1 m depth were collected at selected sites on stable sand bars within the river system (Fig. 2). The samples were not expected to be representative of the entire HM suite in the system as different facies may exist at depth. The objective was to provide enough material for a preliminary assessment of the Ti-rich fraction within the uppermost HM suite. The samples were individually processed by high intensity magnetic separation to produce three fractions; magnetic, para-magnetic and non-magnetic parts. All seven magnetic fractions were then combined to produce a bulk magnetic concentrate (bulk HM). This material formed the basis for all subsequent testwork. Mineralogical and chemical assay data for the combined magnetic sample, (bulk HM), are provided in Tables 2 and 3, respectively.
Modal mineralogy of the bulk HM concentrate determined by optical microscopy
Bulk chemical analysis results (XRF) determined for the bulk HM magnetic fraction and various separated fractions. All values in percent except for U and Th where results are in ppm
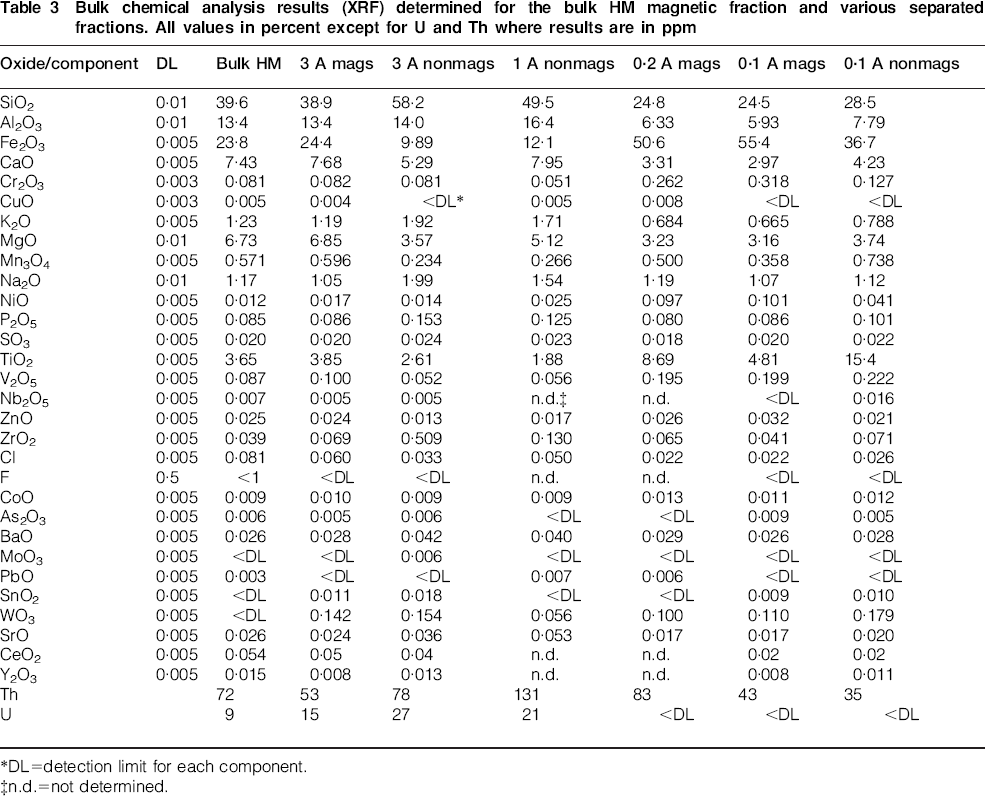
DL = detection limit for each component.
n.d. = not determined.
Ilmenite beneficiation
To generate an ilmenite-rich concentrate, further processing of the bulk HM magnetic concentrate was conducted using a high intensity Carpco roll-type magnetic separator. Initially the sample was fractionated using a setting of 3 A (∼11–12 kGauss) which has previously been employed by CSIRO for producing an HM concentrate from raw, unprocessed beach sand samples (Pownceby et al. 2008). At this current setting, the bulk of the material (97·5%) reported to the magnetic fraction. The current setting was then adjusted to 1 A (∼4 kGauss) to remove more of the high specific gravity (SG) non-magnetic silicates and aluminosilicates from the 3 A mags fraction. This procedure resulted in 94·7% of the material reporting to the magnetic fraction. A separating current of 0·2 A (∼1 kGauss) was then used on the 1 A mags material resulting in 12·7% of material reporting to the magnetic fraction.
It was noted that even after separation at 0·2 A, the magnetic fraction still visually appeared to contain a significant proportion of material that was non-opaque (i.e. coloured or translucent) suggesting significant amounts of high SG silicate and aluminosilicate minerals remained. On the basis of this observation, the sample was further separated at 0·1 A (∼0·2 kGauss). This resulted in 63·6% of material reporting to the mags fraction. Note that 0·1 A was at the lowest current setting achievable for the Carpco instrument used – it was not possible to reach lower currents in order to effect a cleaner, more upgraded separation. The magnetic separation scheme employed and the associated weights are shown in Fig. 3.
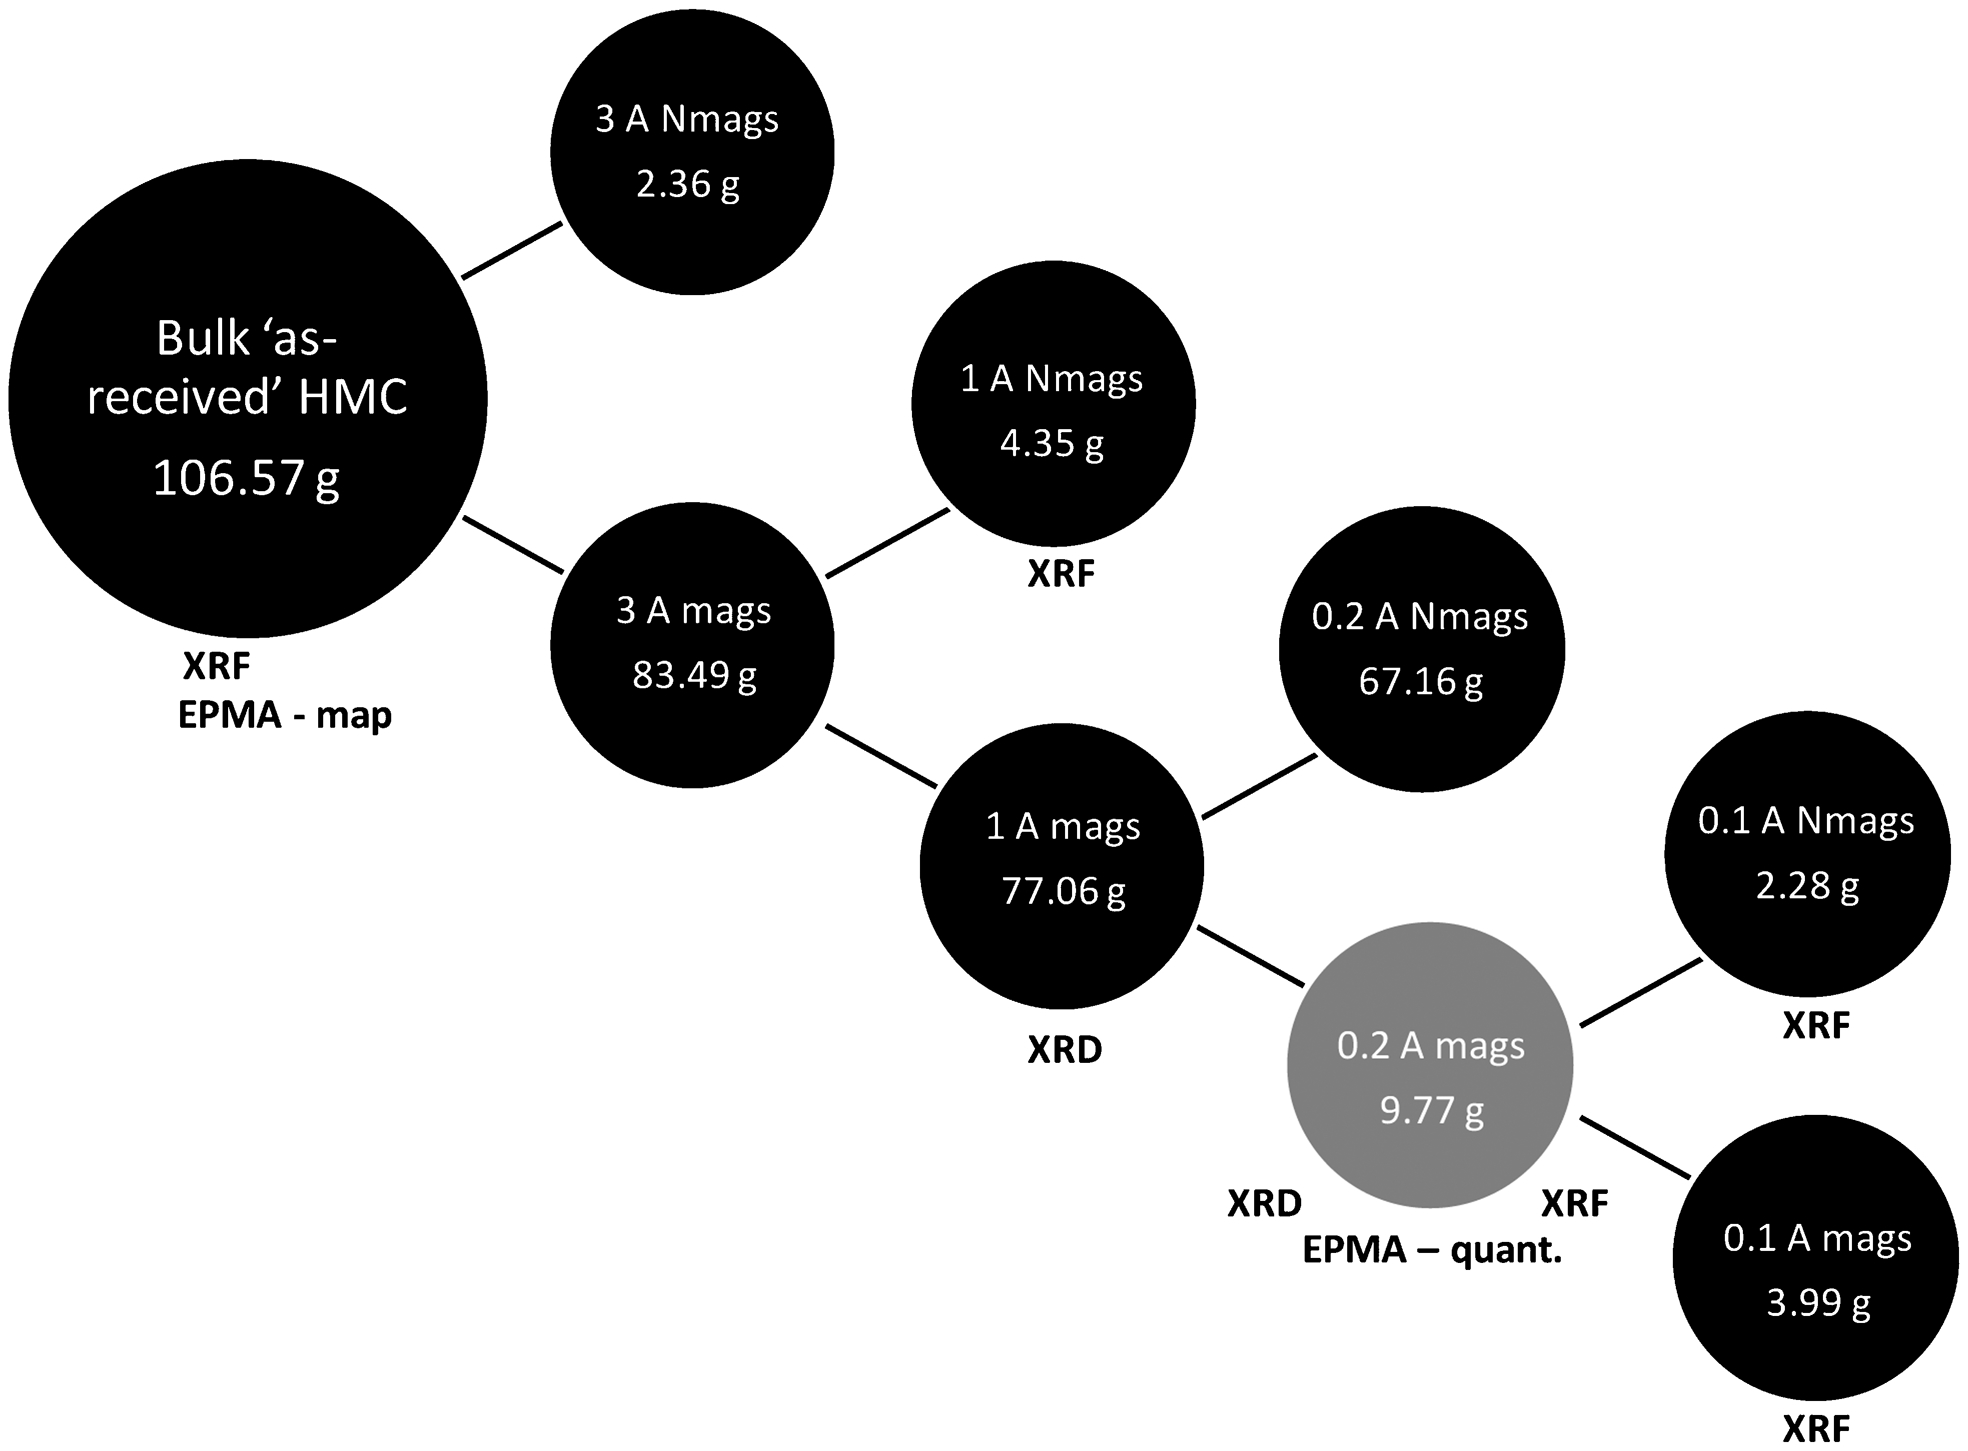
Procedure used for magnetic separation of the Bangladesh HM concentrate. Also shown are the various analytical techniques used at selected stages of the magnetic separation. XRF = X-ray fluorescence spectroscopy, XRD = X-ray diffraction and EPMA = electron probe microanalysis (either mapping or quantitative analysis). The most extensive characterisation testwork was carried out on the 0·2 A mags fraction
After magnetic separation, selected samples (including the bulk magnetic part plus the 3 A mags, 3 A nonmags, 1 A nonmags, 1 A mags, 0·2 A mags, 0·1 A mags and 0·1 A nonmags fractions) were prepared for characterisation using XRF, XRD and EPMA techniques. The XRF data are given in Table 3.
XRF spectroscopy
Chemical analysis of the bulk HM and separated magnetic fractions was carried out using XRF. This involved accurately weighing approximately 0·4 g of each of the finely ground, oven dried powders into a 95% Pt/Au crucible with approximately 4 g (also accurately weighed) of 12∶22 lithium tetraborate/metaborate flux. The mixture was then fused into a homogeneous glass disc over an oxy-propane flame at a temperature of approximately 1050°C and the molten material was poured into a 32 mm diameter 95% Pt/Au mould pre-heated to a similar temperature. The melt was then cooled by air jets for approximately 60 s. The resulting glass discs were analysed on a Philips PW2404 XRF system using an ilmenite-specific control program developed by Philips and algorithms developed in-house by CSIRO.
XRD
Powder XRD data were collected in Bragg-Brentano geometry using a Philips X'Pert diffractometer, fitted with a Co long-fine-focus tube operated at 40 kV and 40 mA and with a curved graphite post-diffraction monochromator. Data were collected over the range 3°≤2θ≤140° in steps of 0·02° 2θ, with a counting time of 2·5 s at each step. Qualitative phase analysis was carried out using HighScore Plus, Version 3.0.5 (PANalytical 2012).
EPMA
Two types of EPMA information were obtained. Initially, the bulk HM sample was mapped using a high resolution field emission gun equipped EPMA (JEOL 8500F Hyperprobe). This was done in order to: (i) determine the distribution of major and minor mineral phases within the sample (Pownceby et al., 2007), and (ii) examine the chemical homogeneity of the ilmenite grains. Following mapping by field emission gun–EPMA, the most magnetic 0·2 A mag fraction was examined in more detail by quantitative EPMA techniques using a JEOL 8900 Superprobe to determine the chemistry of the main Ti- and Fe-rich grains. The operating conditions for each of the techniques and the instruments are described separately below.
EPMA mapping
Electron microprobe mapping was performed using a JEOL Hyperprobe microanalyser equipped with five wavelength dispersive (WD) spectrometers. For the analyses, grains from the bulk HM were uniformly dispersed in epoxy resin, mounted into a 2·5 cm round block and polished flat at a final diamond paste cutting size of 1 μm. The sample was then coated with a 25 nm layer of carbon prior to analysis (to prevent charge build-up on the sample).
The polished grain mount was mapped over a grid of analysis points covering 3600×3600 μm using a combination of WD and energy dispersive (ED) spectroscopic techniques. The elements mapped using the WD spectroscopic techniques were Fe, Nb, Cr, V and Ti. Standards used to calibrate the EPMA WD spectrometers before mapping were: hematite (Fe2O3), niobium metal (Nb), rutile (TiO2), synthetic yttrium vanadate (YVO4) and synthetic eskolaite (Cr2O3). Elements that were not measured by WD spectroscopy were measured using two ED spectrometers operating in parallel. Measuring both ED and WD signals simultaneously ensured that the complete chemical spectrum, at each step interval in the map, was obtained. This additional information was important when trying to identify phases that contained elements not present in the main WD element map suite. Operating conditions for the microprobe during mapping were an accelerating voltage of 15 kV, a beam current of 100 nA, a step size of 2 μm (in x and y), and a counting time of 25 ms per step. The choice of step size was based on a compromise between maximising the number of particles analysed and ensuring any fine-grained mineral phases were located.
Following mapping, the element distribution data obtained were manipulated using the software package CHIMAGE (Harrowfield et al. 1993) which incorporates an automated clustering algorithm that identifies chemically alike phases (Wilson and MacRae 2005). The clustering procedure used was a multi-element data analysis approach whereby the groupings of elements identified via the clustering algorithm represented statistically different chemical/mineral phases. These phases were then overlaid onto the mapped region to provide a ‘phase-patched’ map showing the distribution of all or selected chemical/mineral phases within the mapped area.
Quantitative EPMA
The chemical composition of the titanomagnetite grains in a polished mount of the 0·2 A mags fraction were quantitatively determined using a JEOL 8900 Superprobe. Approximately 500 randomly selected Ti-bearing grains were analysed to assess the distribution of major and minor elements. The analysis position within each grain was also random. For the quantitative analyses, the microprobe was operated at 15 kV and 40 nA and the electron beam defocused to 10 μm (to account for any within-grain inhomogeneity). Counting times were 20 s. on the main peak and 10 s on the background. The suite of elements analysed included Al, Cr, Mn, Mg, Ti, V, Fe, and Si. Oxygen was calculated by difference, based on valence. Standards used were wollastonite (CaSiO3), spinel (MgAl2O4), MnFe alloy, hematite (Fe2O3), rutile (TiO2), eskolaite (Cr2O3), vanadium metal (V) and niobium metal (Nb). Detection limits (2σ) for the analysis conditions used were (in ppm); Cr ∼650, Nb ∼380, Al ∼160, Mn ∼600, V ∼4300, Si ∼120, Fe ∼7500, Ti ∼350 and Mg ∼90. All analysis positions were verified as being homogeneous and flat by viewing the secondary electron image of the area to be analysed (at 5000× magnification). Elemental analyses were corrected for atomic number (Z), absorption (A) and fluorescence (F) using the PAP procedure of Pouchou and Pichoir (1985, 1991).
Results
Optical and scanning electron microscopy
Optical microscope examination of the bulk HM revealed that the sample consisted primarily of silicate and aluminosilicate gangue mineral grains with garnet, feldspar, mica (biotite and muscovite), hornblende, pyroxene, olivine and unidentified minerals making up >84% of the concentrate. Ilmenite comprised up to ∼6% of the bulk whereas other Fe-rich phases such as magnetite (4·65%) and hematite (5·23%) were also present (Table 2).
A back scattered electron (BSE) scanning electron microscope image showing the distribution of all phases within the bulk HM is shown in Fig. 4. In a BSE image, minerals containing high atomic number elements such as Fe (e.g. in Fe-oxides, magnetite and hematite), Ti (e.g. in ilmenite, rutile), Zr (e.g. in zircon) and U (e.g. in monazite) appear as bright contrast phases, whereas minerals composed mainly of low atomic elements, such as Si and Al, appear darker in contrast. Based on the BSE contrast observable in Fig. 4, the bulk HM comprised up to 10–15% of HMs containing high atomic number bearing minerals such as Fe-oxides, ilmenite, rutile, zircon and monazite. The remaining 85–90% of the sample comprised silicates and aluminosilicates of various compositions (indicated by the considerable variation in BSE contrast amongst the population of darker phases). The BSE image also indicated that grains were reasonably well sorted with a grainsize population ranging in size from 100 to 250 μm.
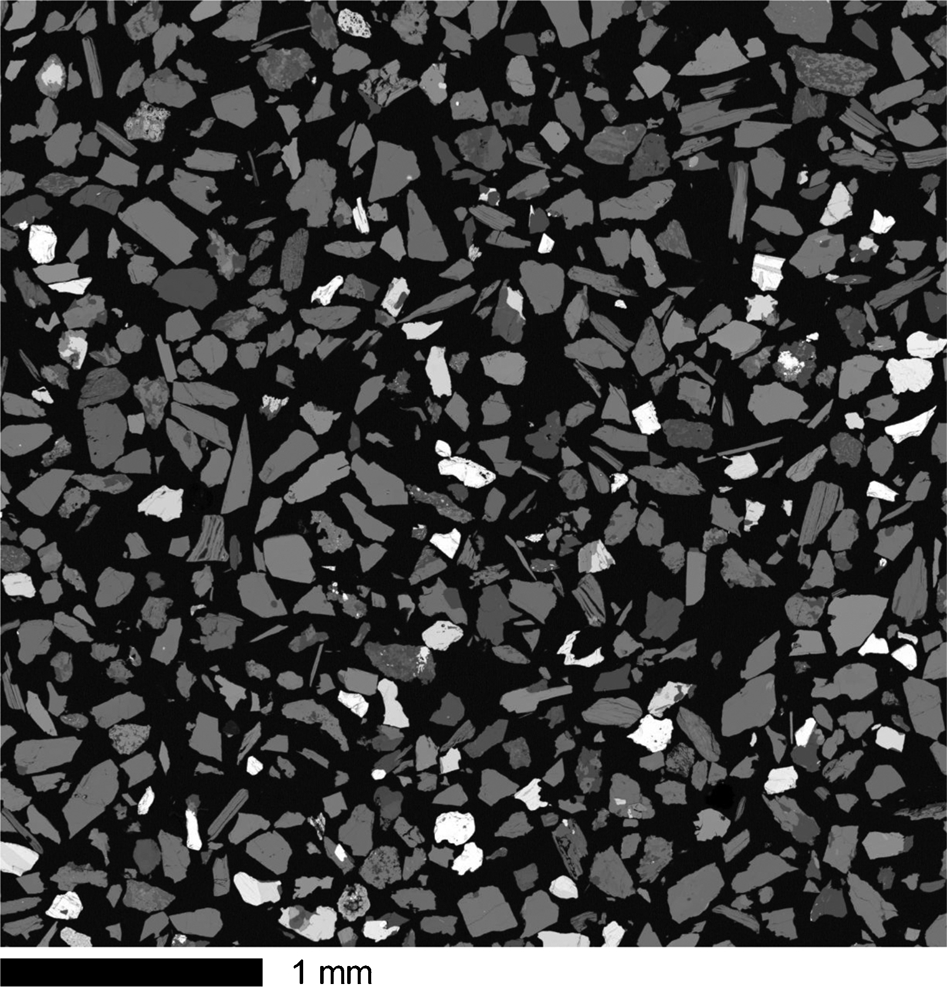
Back-scattered electron (BSE) image of the bulk HM concentrate showing the distribution of all phases within the mapped area. Light (bright) contrast phases (∼10–15%) represent Fe- and Ti-rich mineral phases while darker contrast phases represent silicates and aluminosilicates. Note the high degree of angularity of many of the phases suggesting close proximity to the source region
Individual grains of gangue and ilmenite were highly angular suggesting proximity to the source region and many of the silicates and aluminosilicates appeared to be composite particles containing one or more minerals. The ilmenite grains were for the most part well-liberated and homogeneous in composition and texture. Based on the angular nature of the grains and the lack of evidence for substantial alteration, it is likely the ilmenite was relatively primary in composition.
XRF analysis
The XRF results (Table 3, Column 3) indicated the bulk HM concentrate contained 3·65 wt-%TiO2 and 23·8 wt-%Fe2O3. Other elements in significant amounts included; SiO2 (39·6%), Al2O3 (13·4%), CaO (7·43%), K2O (1·23%), MgO (6·73%) and Na2O (1·17%). The low TiO2 content as well as the presence of these oxides/elements as additional components in the bulk HM confirmed a significant amount of silicate and aluminosilicate gangue mineral phases were present. These included mineral phases such as garnet, feldspar, micas (muscovite and biotite), olivine, pyroxene and amphibole (Table 2).
Progressive separation of the bulk HM at lower magnetic field strengths increased the amount of TiO2 and Fe2O3 reporting to the magnetic fractions and concentrated the high SG silicates and aluminosilicates in the nonmagnetic fractions. The highest TiO2 content was achieved when the 0·2 A mags fraction was separated at 0·1 A (Table 3). This resulted in a 4·81% TiO2 magnetic fraction and a 15·4% TiO2 nonmags fraction. Based on the observation that more TiO2 was present in the 0·1 A nonmags fraction, the bulk of the ilmenite was assumed concentrated in this fraction whereas more magnetic, but lower TiO2 and higher Fe2O3-containing minerals such as magnetite and titanomagnetite, were likely to be present in the 0·1 A mags fraction. The presence of high Fe2O3 (55·4% Fe2O3) in the 0·1 A mags fraction was consistent with this fraction containing a high magnetite/titanomagnetite component.
XRD
Powder XRD analysis of the bulk HM (not shown here) revealed the sample contained a large proportion of silicate and aluminosilicate gangue minerals in addition to a minor amount of ilmenite. The most abundant minerals included the ferromagnesian minerals amphibole, muscovite/biotite, clinochlore and garnet, plus sillimanite, quartz and minor feldspar. Ilmenite and magnetite were typically present at levels <5–10% (combined). The XRD results were consistent with the optical mineralogical analysis results provided in Table 3.
X-ray diffraction analysis was also conducted on the 0·1 A mags and 0·1 A nonmags fractions. The results indicated a high proportion of magnetite/titanomagnetite in the 0·1 A magnetic fraction consistent with the lower TiO2 and higher Fe2O3 contents determined via bulk XRF analysis. Conversely, ilmenite formed a major component of the 0·1 A nonmags fraction. Both fractions still retained relatively high silicate and aluminosilicate contents with pyroxenes, garnet and quartz being the main components. Their presence was likely due to entrainment during magnetic separation (or they may have high Fe contents giving rise to an increase in their magnetic susceptibility).
EPMA
EPMA mapping
The EPMA mapping of the bulk HM concentrate produced single element maps showing the distribution of key elements within the mapped area. Ilmenite in the sample was identified by the presence of elevated concentrations of Ti and Fe and the corresponding maps for these two elements are shown in Fig. 5a and b, respectively. The maps show that there was considerable variation in the Ti and Fe contents between different mineral grains. Grains however, that contain both Fe and Ti most likely represented the ilmenite component within the concentrate. This was verified by a plot which overlays both the Fe and Ti data to differentiate between grains containing only Fe, representing Fe-rich oxides such as magnetite, and those which contained both Fe and Ti, representing either ilmenite or titanomagnetite (Fig. 5c). The final map showing the distribution of all Fe and Ti phases within the mapped bulk magnetic part is shown in Fig. 5d. Note that the sample also contained titanium in the form of titanite (CaTiSiO5). The distribution of titanite has also been included in Fig. 5d.
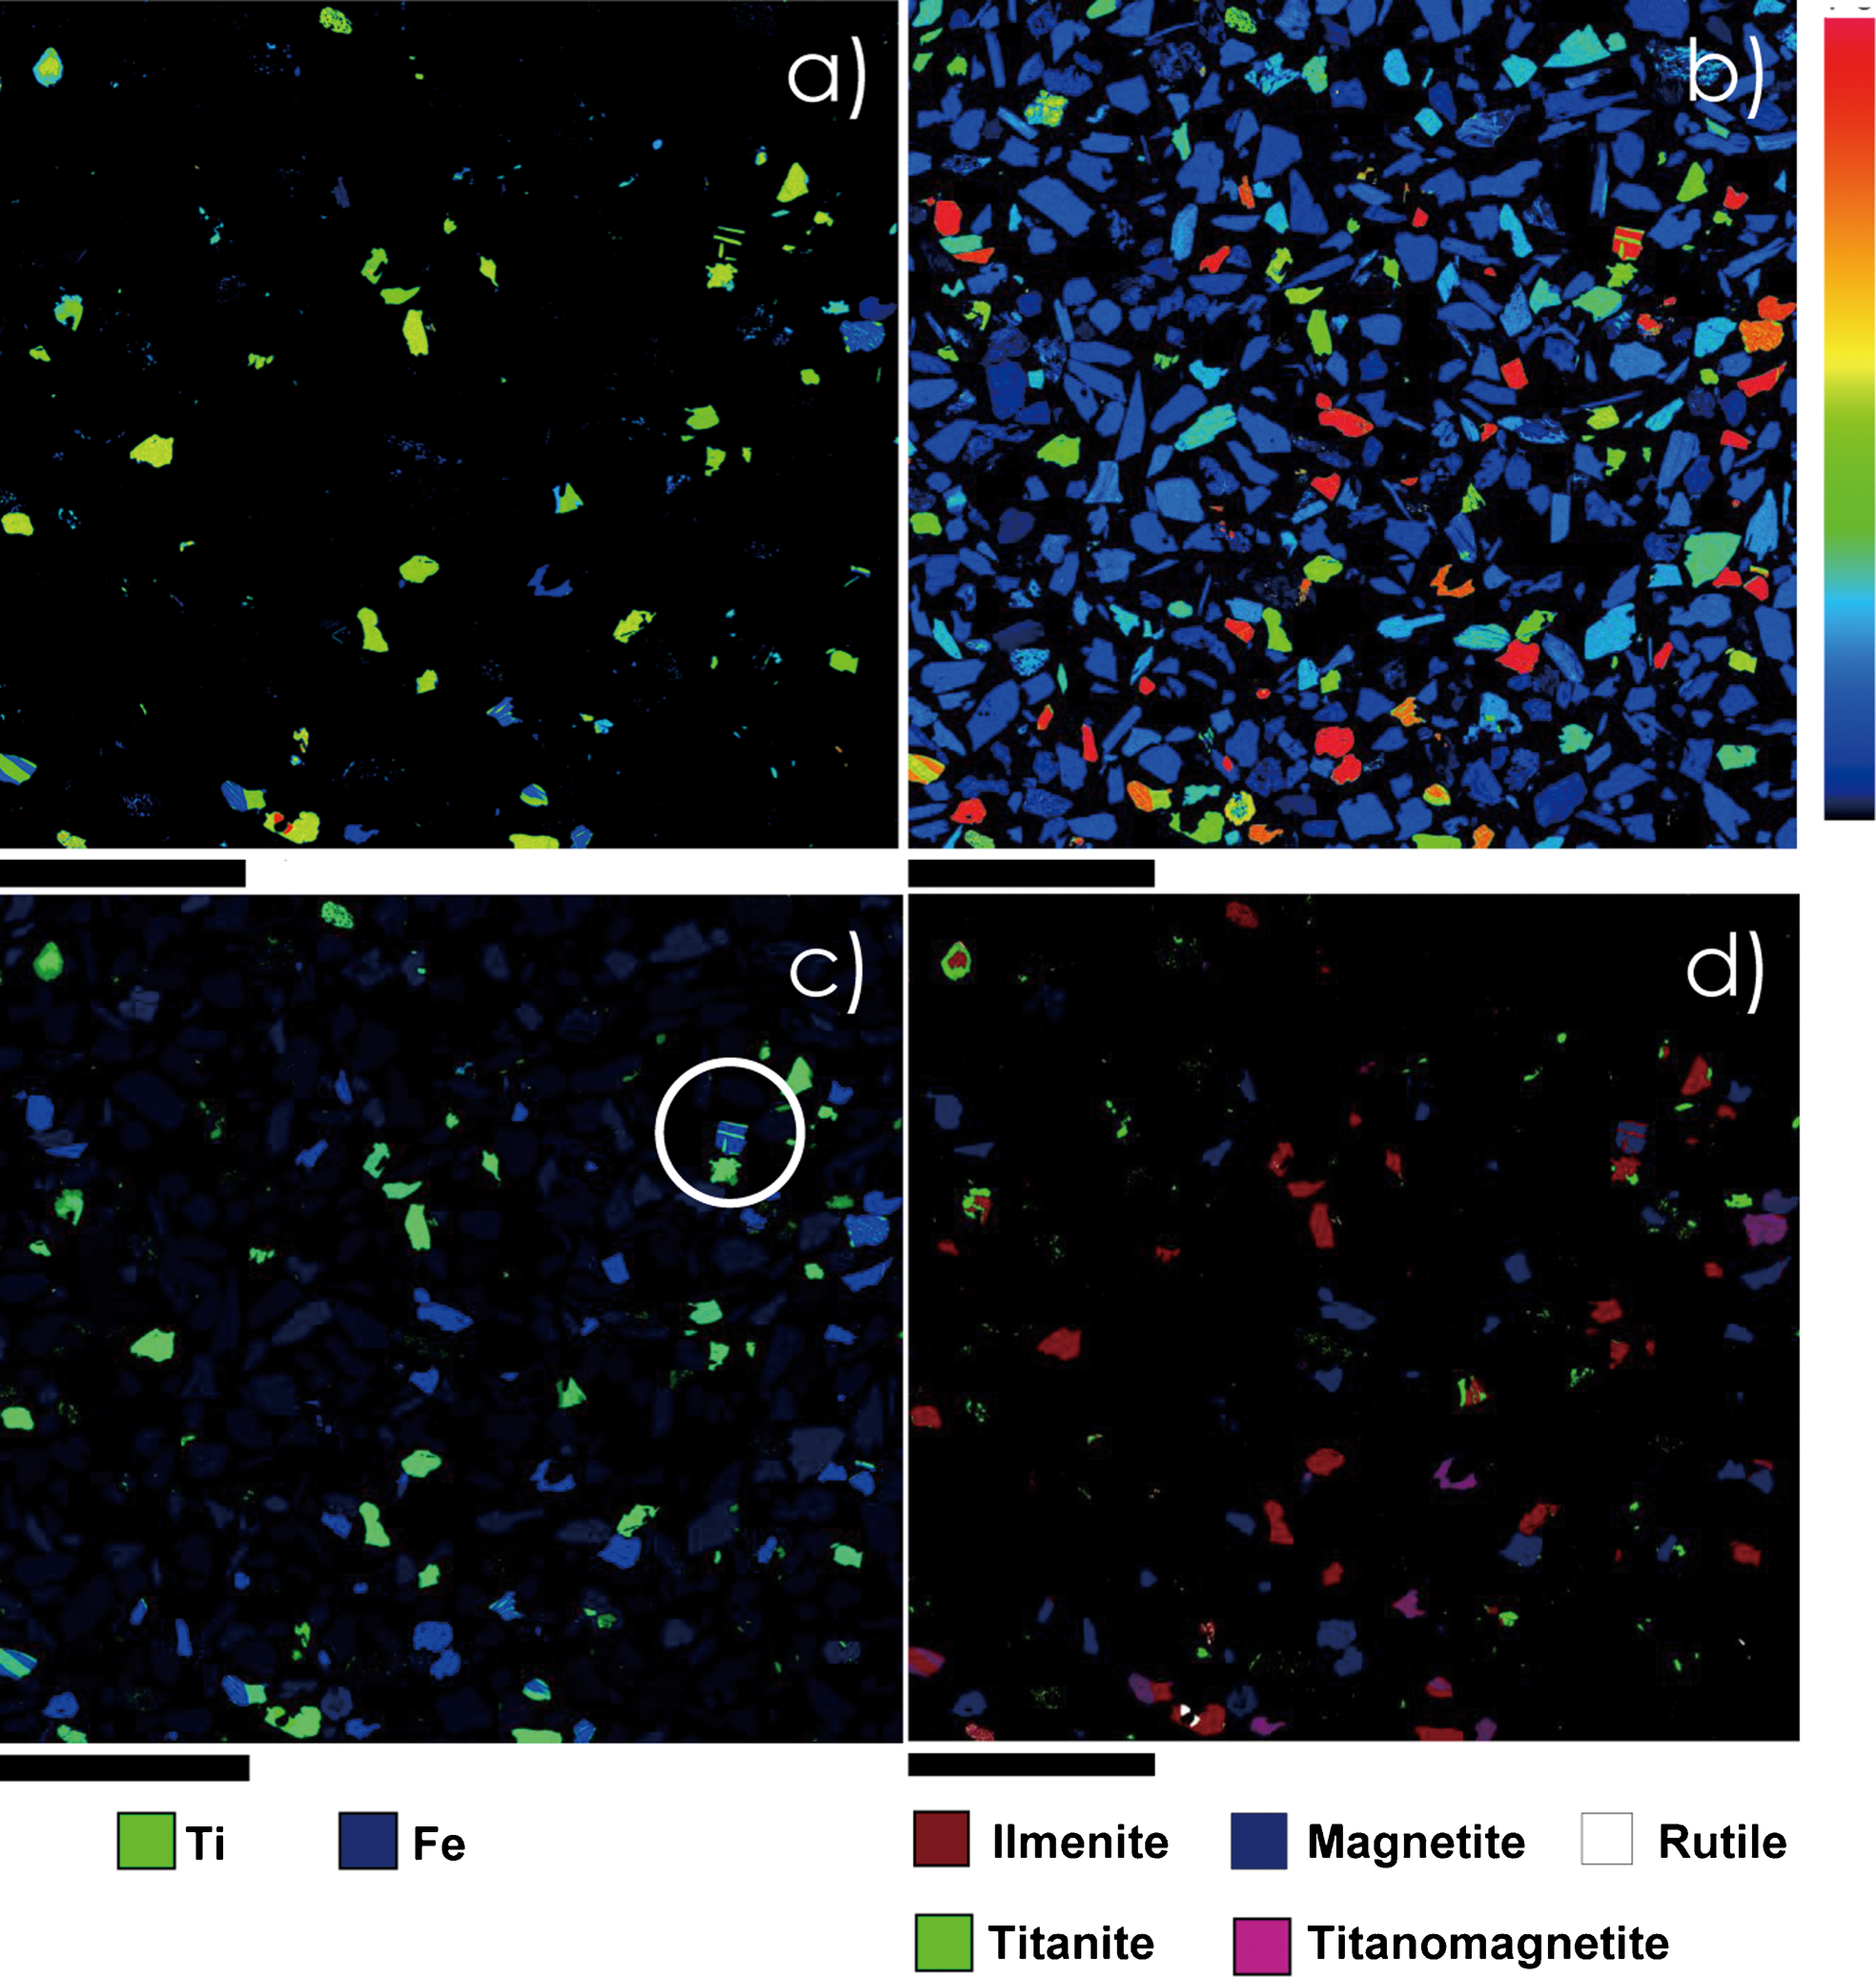
Map (EPMA) results for the bulk HM concentrate covering the area of the BSE image shown in Fig. 4. Images a and b are single element maps showing the distribution of Ti and Fe, respectively, within the mapped area. The coloured scale bar at the right of each map shows relative concentration. Image c shows the Fe/Ti element overlay map showing Fe-rich (blue) versus Ti-rich (green) grains and, image d is the corresponding phase-patched map showing the distribution of magnetite, ilmenite, titanomagnetite, titanate and rutile within the bulk HM concentrate. The circled grain in Fig. 5c demonstrates complex exsolution between hematite and ilmenite (see text). The scale bar in each image represents 1 mm
Modal analysis for the magnetite/ilmenite/titanomagnetite/rutile/titanite plot shown in Fig. 5d indicated that the bulk magnetic part contains 4·7% ilmenite, 4·4% Fe-oxide (magnetite), 0·91% titanomagnetite, 0·94% titanite and 0·08% rutile (Table 4).
Modal analysis data for the bulk HM concentrate determined by EPMA mapping
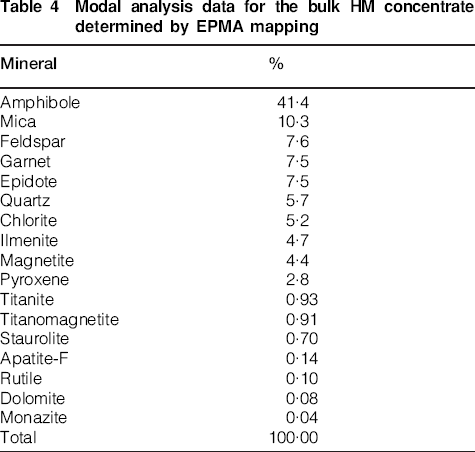
The EPMA map data was used to identify individual mineral phases based on chemistry before using the data to construct a phase-patched map showing the distribution of all phases in the bulk HM concentrate. The final map is shown in Fig. 6 while modal data are supplied in Table 4. It was noted that the phase identification revealed that a number of different composition amphiboles, garnets, feldspars, micas and pyroxenes in the concentrate – to minimise the number of mineral phases reported these have been reported under major mineral group headings only. Comparison of the modal mineral data with that determined via optical microscopy (Table 2) indicated significant differences in the number of mineral phases identified as well as their abundances. This is believed due to the greater accuracy of mineral identification through the use of automated EPMA mapping techniques.
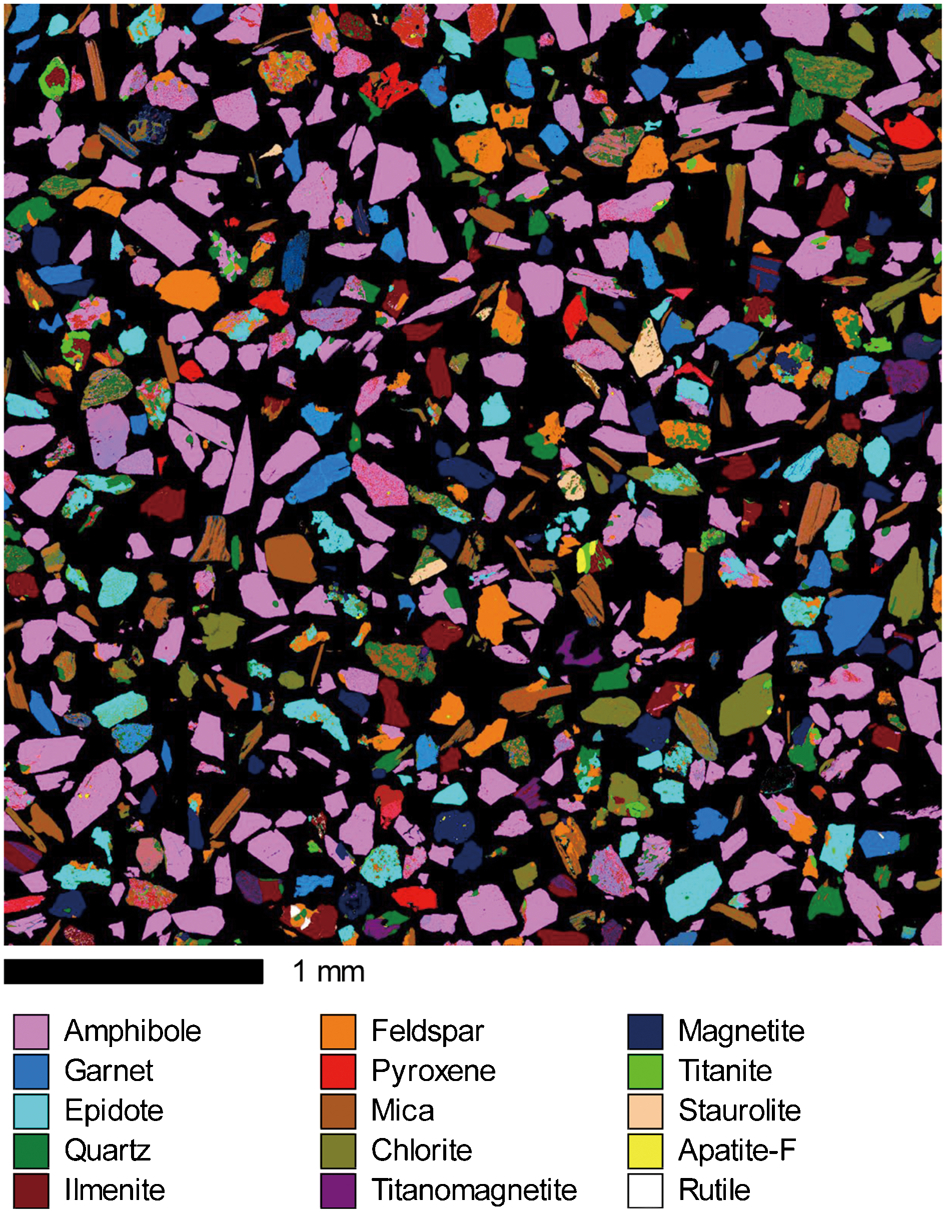
Final EPMA phase-patched map results showing the distribution of all phases in the bulk HM concentrate
Quantitative EPMA
To characterise the chemistry of the ilmenite and associated Ti- and Fe-rich components (e.g. Fe-oxide, titanomagnetite, etc.) of the HM river sand, quantitative EPMA analyses on individual grains within the magnetically fractionated 0·2 A mags sample were undertaken. Note that only iron- and titanium-bearing grains were targeted in this procedure – gangue grains such as quartz, aluminosilicates, and pyroxenes, etc., that were also present in the concentrate were not included in the data set.
In total, 492 individual analyses were obtained on the Ti- and Fe-rich grains in the 0·2 A mags fraction. Results are listed in Table 5 where the data show an average TiO2 content of 14·63 wt-% and an average Fe2O3 content of 85·30 wt-%. In terms of an average bulk composition, this approximates the composition of titanomagnetite (although there may be considerable variation in Fe and Ti for naturally occurring titanomagnetite).
Summary of quantitative EPMA data for the Ti- and Fe-containing phases in the Bangladesh 0·2 A mags fraction
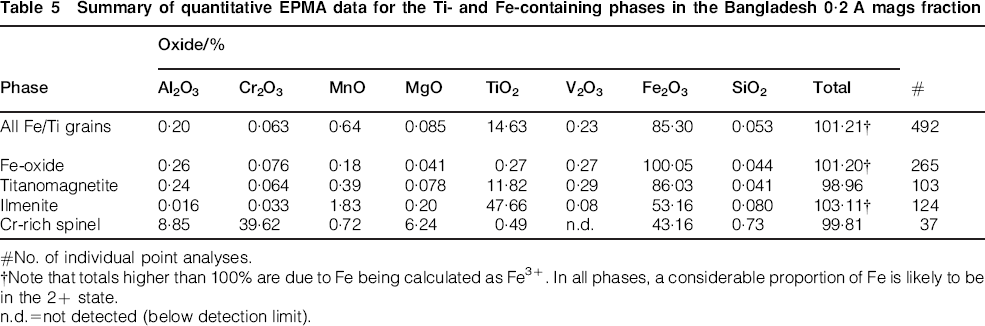
#No. of individual point analyses.
Note that totals higher than 100% are due to Fe being calculated as Fe3+. In all phases, a considerable proportion of Fe is likely to be in the 2+ state.
n.d. = not detected (below detection limit).
The average value for all Fe/Ti grains (Row 1, Table 5) represents data from the range of possible Ti- and Fe-rich sources in the 0·2 A mags fraction. This can be clearly seen on a plot of Fe2O3 versus TiO2 for the bulk data set (Fig. 7) where at least three separate composition fields are visible. These represent: magnetite (this material is magnetite as opposed to hematite due to the observed highly magnetic nature of the material as well as identification by XRD), titanomagnetite, and primary ilmenite. The Fe/Ti dataset was therefore separated into each of the clusters in order to determine their average composition. This data is included in Table 5. The cut-off TiO2 contents used for each of the groupings were:
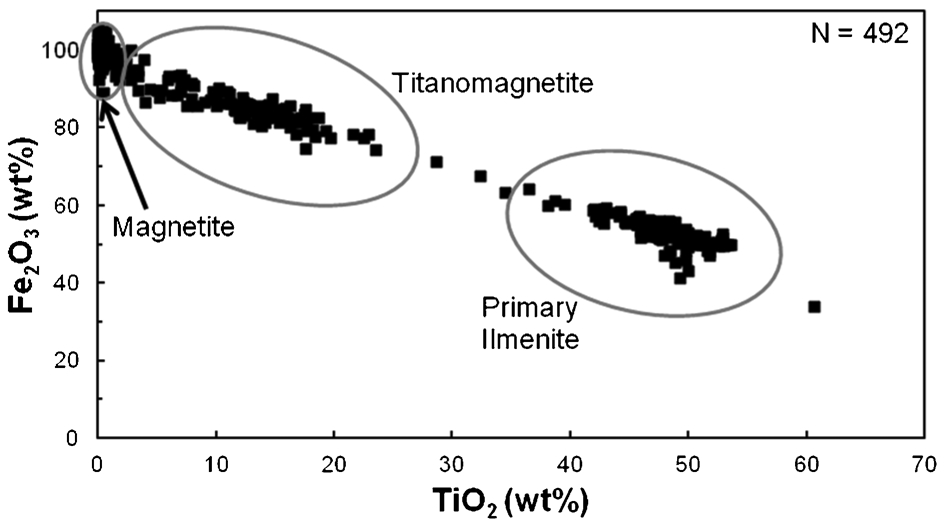
Plot showing the compositions of individual Ti and Fe bearing grains in the 0·2 A mags fraction. Three distinct clusters are obvious in the dataset: magnetite, titanomagnetite and ilmenite. Average compositions calculated for each of the clusters are provided in Table 5
Magnetite: 0%<TiO2<2·0%
Titanomagnetite: 5·0%<TiO2<25%
Primary ilmenite: 25%<TiO2<61%
Note that these grouping are somewhat arbitrary as extensive solid solution and oxidation of Fe within individual grains will extend the compositional range and smear out boundaries. Nonetheless, the suggested groupings above appear to best represent the clusters observed in Fig. 7.
In addition to the major Ti and Fe minerals, a small proportion of Cr-rich spinel grains, which also contain a small proportion of Ti, were identified in the sample. Average data for these grains are included in Table 5 and their compositions are shown in Fig. 8. Knowledge of the composition and abundance of chrome spinel grains is important when characterising ilmenite concentrates as they are often difficult to effectively separate from the ilmenite. This can cause potential downstream processing problems as the presence of elevated levels of chromia in ilmenite concentrates is deleterious towards processing the ilmenite to produce TiO2 pigment.
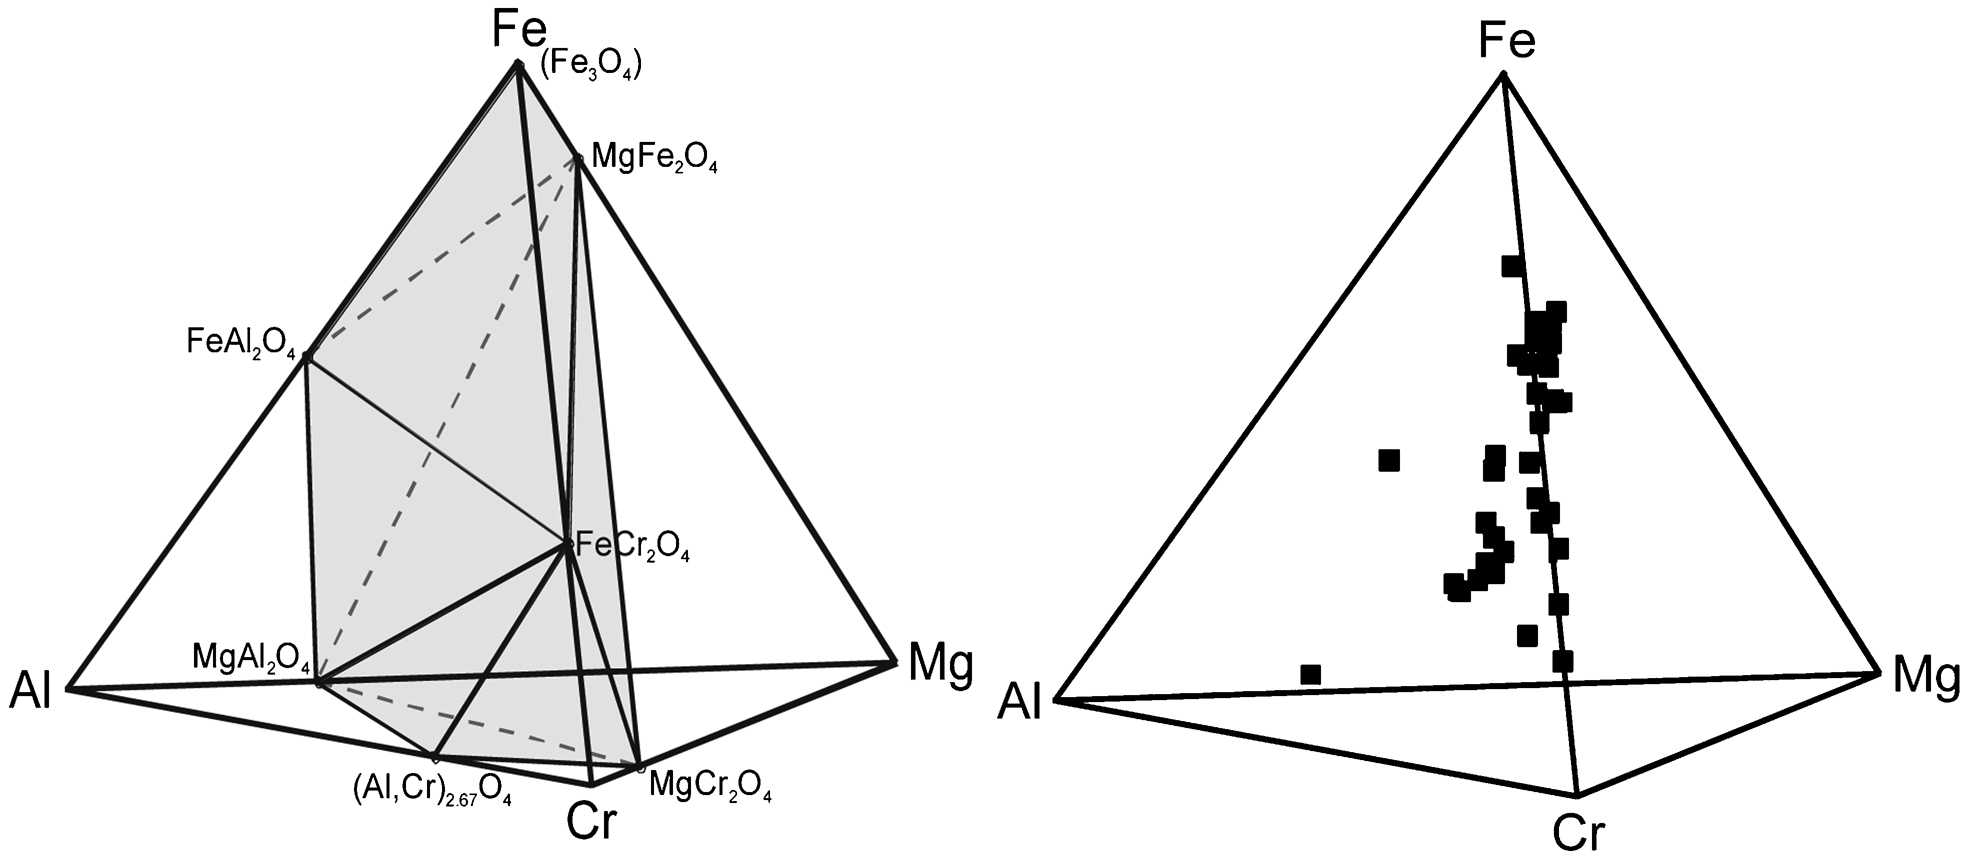
Tetrahedral plot showing the possible compositional ranges and corresponding end member components in spinel grains. The second plot indicates the compositions of the chrome-containing spinel grains present in the 0·2 A mags HM fraction. An average composition calculated for the chrome-spinel population measured in the Bangladesh HM concentrate is provided in Table 5 (Row 5)
Discussion – implications for processing
The TiO2 content of the ilmenite in the Bangladesh HM river sand concentrate was within the range 40–52 wt-%TiO2 (average ∼48 wt-%TiO2) which is similar to the range of TiO2 for ilmenite concentrates obtained from ilmenite/magnetite or ilmenite/hematite high temperature magmatic rock deposits such as those at Tellnes, Norway (Chernet 1999), Allard Lake, Canada, Otanmäki, Finland, and deposits in the former Soviet Union (e.g. Gusevogorsk, Russia). Ilmenite is a common mineral in high temperature magmatic rocks such as norites, gabbros and anorthosites where there is complete miscibility at high temperatures (>600°C) between ilmenite and hematite (Fe2O3). As the temperature drops during cooling, hematite and ilmenite become segregated forming titanohematite characterised by lamellae of hematite in varying amounts intercalated with ilmenite. A second important mineral in the ternary FeO–Fe2O3–TiO2 system is titanomagnetite. The two spinels magnetite (Fe2+Fe23+O4) and ulvöspinel (Fe2TiO4) are also completely miscible at high temperatures. Part of the Fe2+ can be replaced isomorphously (i.e. solid solution) by Ti, Mg, Mn and other elements, and part of the Fe3+ can be replaced by Ti, Al, V and Cr in the magnetite. As the temperature drops, there is segregation into magnetite, ilmenite and ulvöspinel. Complete segregation into pure magnetite and ulvöspinel does not take place due to the preferred substitution of Fe instead of Ti. Thus the TiO2 content in ilmenite can be far below the stoichiometric value of 52·66 wt-%. Figure 9 shows the FeO–Fe2O3–TiO2 system in a ternary plot (Garnar 1978). The Bangladesh ilmenite grains plot in the region close to rock ilmenites (point A) however the lower TiO2 content compared to stoichiometric ilmenite (52·66 wt-%TiO2) indicated likely hematite exsolution within the primary ilmenite grains. Although often fine-grained in texture, exsolution was evident in some grains examined during the EPMA mapping (e.g. circled grain in Fig. 5c).
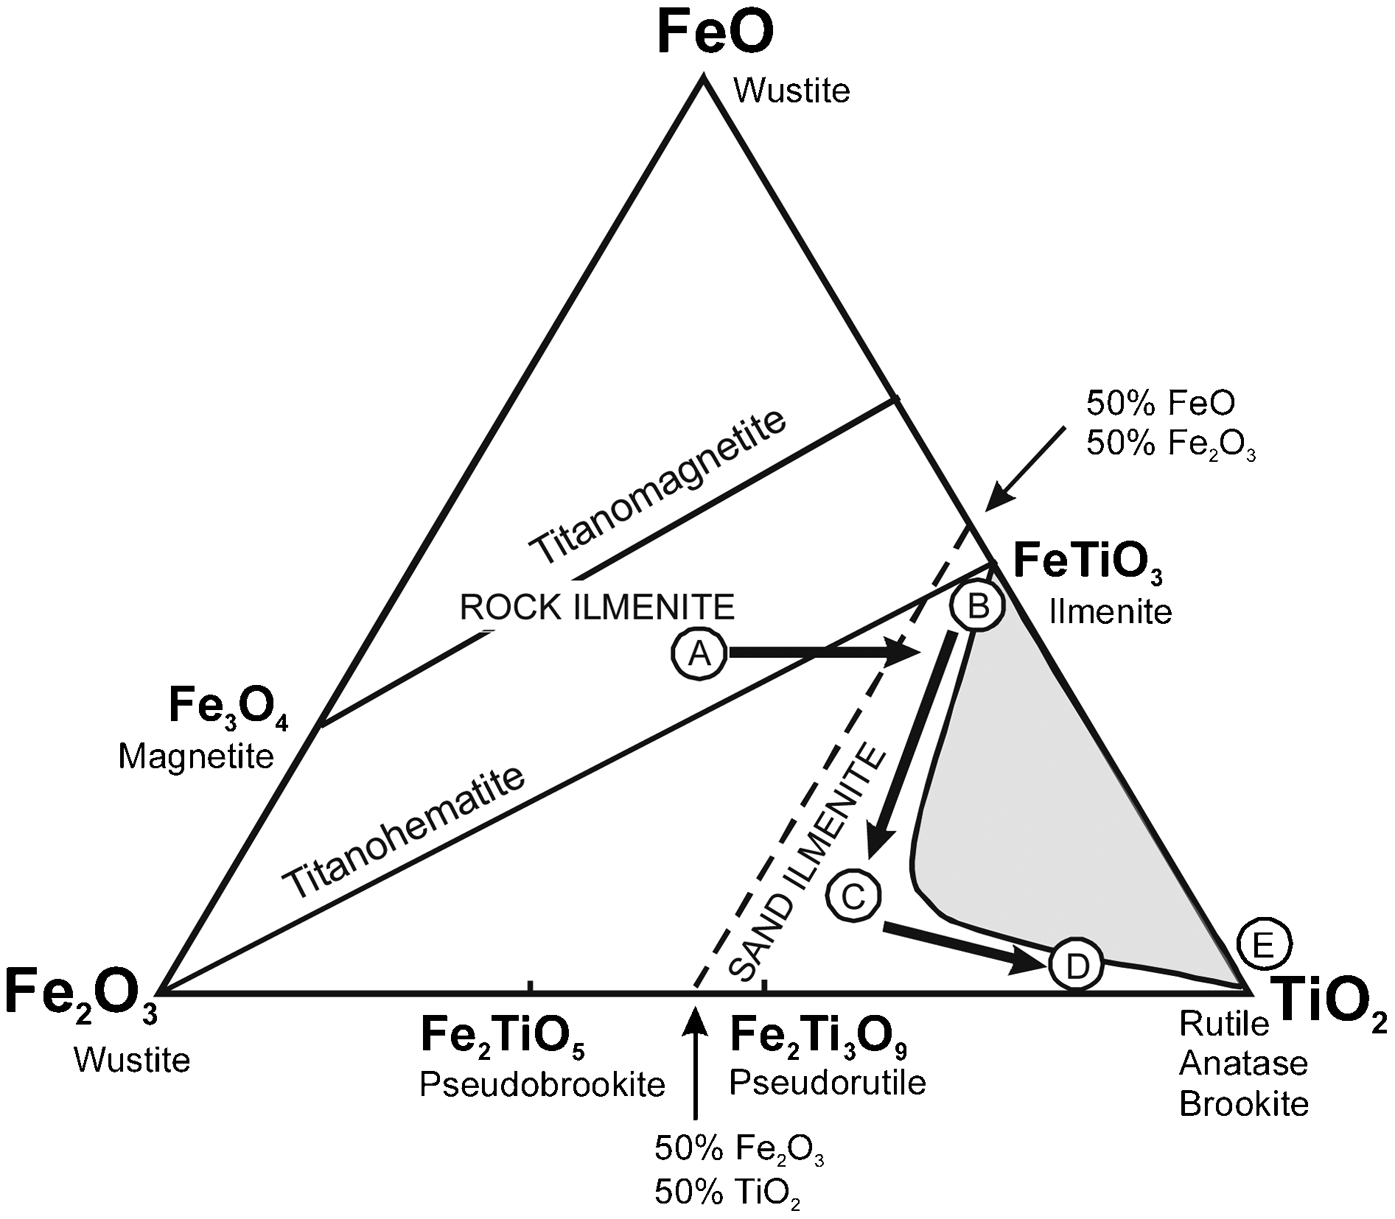
The ternary FeO–Fe2O3–TiO2 system according to Garnar (1978). There are no known analyses of titanium minerals in the shaded field. The Brahmaputra ilmenite plots close to A. However, prolonged weathering will cause a shift of compositions towards B and ultimately through to D and E (the latter only in extreme weathering cases)
The Bangladesh ilmenites are not pure TiO2 and FeO (or Fe2O3) with major impurities present including MnO (1·83 wt-%) and MgO (0·20 wt-%) and minor impurities of Al2O3 (0·02 wt-%), Cr2O3 (0·03 wt-%), SiO2 (0·08 wt-%) and V2O5 (0·08 wt-%). Manganese, magnesium and vanadium impurities are likely to be within the lattice structure of the ilmenite as solid solution components whereas the minor impurities are likely to be present as clay impurities or as materials adsorbed onto the surfaces of pores and or fractures. These values however, represent the expected levels of impurities that could be achieved for a Bangladesh river sand ilmenite concentrate providing all other gangue mineral grains were able to be removed.
There are two industrial processes for the processing of ilmenite used in the manufacture of TiO2 pigments – the sulphate process and the chloride process (Elsner 2010). The sulphate process requires as initial raw materials either ilmenite with a TiO2 content of 35–65 wt-% or a titanium slag with 55–70 wt-%TiO2. In comparison, the chloride process requires intensely weathered ilmenite or leucoxene (approx. 58–70 wt-%TiO2), natural rutile, synthetic rutile or a titanium slag with >85 wt-%TiO2 as the basic raw materials. Grosz (1987) compiled the chemical specifications for the raw materials required for the manufacture of TiO2 pigment from TiO2-rich feedstocks (Table 6). Note that these are guidelines only, in some areas there is scope for considerable variation in limits, e.g. TiO2 contents used in the chloride process may reach >60%. Variation outside the limits for critical impurities are, however, less likely to be accepted by producers.
Specifications for the ilmenite raw materials for the production of white pigments according to Grosz (1987). Critical impurities are shown in bold typeface
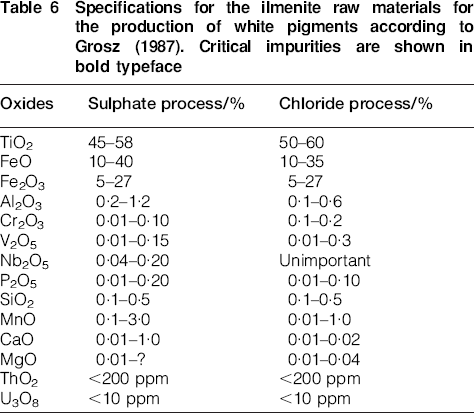
Although not all possible impurity elements were analysed in the current study, based on the composition of the Bangladesh HM river sand ilmenite the most likely route for processing would be via the sulphate route. A general TiO2 production flow sheet using the sulphate process is presented in Fig. 10 (see also Lynd and Lefond 1983, Evilampi 1990, Stanaway 1994, Garnar and Stanaway 1994). We note however, that even though chromium in the ilmenite grains was very low (0·033 wt-%Cr2O3), the presence of chromium as discrete gangue chrome-spinel grains in the HM concentrate may have significant implications as chromium is a known penalty element in ilmenite processing (Table 6). Previous studies of ilmenite concentrates contaminated with chrome-spinels have shown that it is not always possible to readily separate the chrome-spinels from the ilmenite when producing the final ilmenite feedstock. The chrome-spinels exhibit a range of compositions (Fig. 7) meaning the properties of the chrome-spinels are likely to significantly overlap those of the ilmenite (Pownceby 2005, Pownceby and Bourne 2006). If this is the case, then the bulk ilmenite concentrate may have a total chromia content that is greater than the 0·1 wt-%Cr2O3 specified as acceptable via the sulphate process (Grosz 1987, Beukes and van Niekerk 1999). Usually an additional processing step such as a magnetising roast is required in order to effect a clean separation between the ilmenite and the chrome-spinels and reduce the bulk Cr2O3 content in the ilmenite feedstock to an acceptable level (e.g. Nell and den Hoed 1997, Fisher-White et al. 2007).
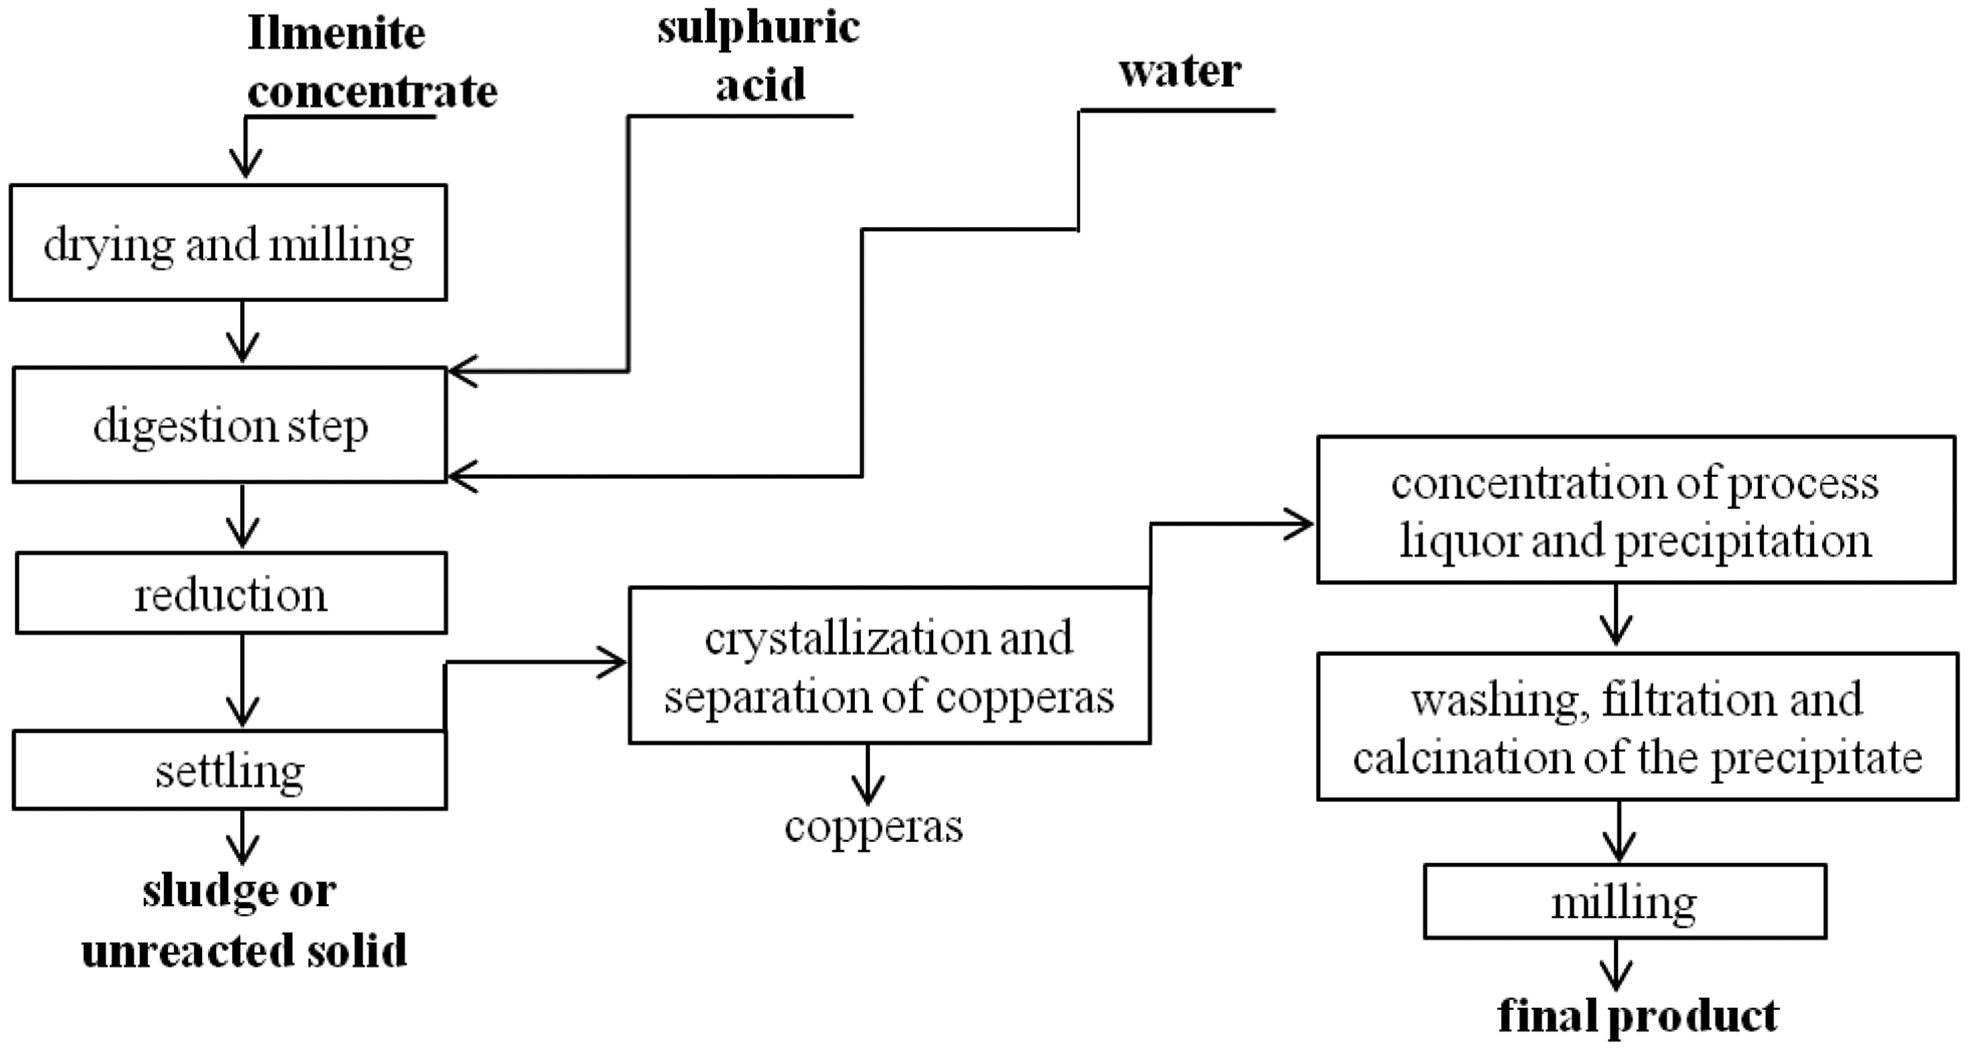
General flow sheet for the production of TiO2 pigment via the sulphate process (after Chernet 1999)
Although emphasis in the current study has been on characterising the ilmenite present in Bangladesh HM river sands, the results also indicated the sands contained a significant component of titanomagnetite. Titanomagnetite ores are among the leading types of commercial iron ore deposits and the main provider of vanadium used in ferrous and non-ferrous alloys (Moskalyk and Alfantazi 2003). Additional work is required to investigate whether the titanomagnetite component is potentially recoverable for further processing.
Conclusion
An ilmenite-rich fraction was prepared from an HM sand concentrate sourced from the Brahmaputra River in Bangladesh. The bulk HM concentrate contained ∼10–15 wt-% HMs with the remaining 85–90 wt-% of the sample comprising silicates and aluminosilicates of various compositions. The most abundant gangue minerals included the ferromagnesian minerals amphibole, muscovite/biotite, clinochlore and garnet, plus sillimanite, quartz and minor feldspar. Mineral grains were noted to be angular in appearance implying they have not been transported a significant distance from their source region, and were well sorted with a grainsize population ranging in size from 100 to 250 μm. Modal analysis for the Fe- and Ti-rich components indicated that the HM concentrate contained 4·7% ilmenite, 4·4% Fe-oxide (magnetite), 0·91% titanomagnetite, 0·94% titanite and 0·08% rutile. Quantitative analysis of the ilmenite component showed the TiO2 content of the ilmenite in the Bangladesh HM river sand concentrate was within the range 40–52 wt-% TiO2 (average ∼48 wt-% TiO2). Major impurities present in the ilmenite included MnO (1·83 wt-%) and MgO (0·20 wt-%) and minor impurities were Al2O3 (0·02 wt-%), Cr2O3 (0·03 wt-%), SiO2 (0·08 wt-%) and V2O5 (0·08 wt-%). Although not all possible impurity elements were analysed in the current study, based on the composition of the Bangladesh HM river sand ilmenite the most likely route for processing the ilmenite-rich component of the HM sands would be via the sulphate route to pigment.
Footnotes
Acknowledgements
The authors gratefully acknowledge the assistance provided by CSIRO co-workers Barry Halstead and Nathan Webster (XRD), Steve Peacock (XRF), Michael Fisher-White (magnetic separation and XRD sample preparation), Cameron Davidson (EPMA sample preparation) and Nick Wilson and Aaron Torpy (EMPA characterisation). The authors also acknowledge the support provided by the Honourable State Minister, Ministry of Science and Technology, Bangladesh and the BCSIR for supporting the secondment of Mr Aminur Rahman to CSIRO as a visiting scientist.