
Abstract
Alloy 22 (UNS N06022) belongs to the Ni–Cr–Mo family, and it is highly resistant to general and localised corrosion; however, it may suffer crevice corrosion in aggressive environmental conditions. The susceptibility to crevice corrosion is measured by the value of the repassivation potential. The objective of this work is to compare different electrochemical methods for determining the repassivation potential of alloy 22; these include cyclic potentiodynamic polarisation, Tsujikawa–Hisamatsu electrochemical, potentiodynamic–potentiostatic–potentiodynamic and potentiodynamic–galvanostatic–potentiodynamic methods. The potentiodynamic–galvanostatic–potentiodynamic technique was found to be the most conservative laboratory technique, which gave the lowest repassivation potential in a relatively short testing time. The polytetrafluoroethylene (PTFE)-wrapped ceramic crevice formers formed more severe crevices, leading to higher repassivation potentials than the solid PTFE crevice formers. Torque values higher than 2 N m were needed for obtaining reliable repassivation potentials. Surface roughness did not affect significantly the repassivation potential.
Introduction
Alloy 22 (UNS N06022)1 belongs to the Ni–Cr–Mo family, and it is highly resistant to general and localised corrosion; however, it may suffer crevice corrosion in aggressive environmental conditions.2 – 4 Alloy 22 is one of the candidates for the construction of engineered barriers of deep geological repositories for high level nuclear waste isolation.5 The susceptibility of alloy 22 to crevice corrosion depends on environmental and metallurgical variables, including chloride concentration, temperature, presence of inhibitors and applied potential. 3 3,4 The susceptibility to crevice corrosion is measured by the value of the repassivation potential E R,crev in each tested condition. The lower is E R,crev, the more aggressive is the environment. In the last few years, several electrochemical methods have been proposed to measure E R,crev, including cyclic potentiodynamic polarisation (CPP) (ASTM G61),6 Tsujikawa–Hisamatsu electrochemical (THE) (ASTM G192),7 potentiostatic (PS), mixed potentiodynamic–potentiostatic (PD-PS-PD) and mixed potentiodynamic–galvanostatic (PD-GS-PD) methods.8 – 16 Whenever crevice corrosion readily occurs (that is, when the environment is aggressive), the values of E R,crev for alloy 22 seem comparable for the same environmental and metallurgical variables. 4 11 4,11,12 This finding suggests that E R,crev is a property of the alloy in each testing condition and does not depend greatly on the manner it is obtained provided that highly aggressive conditions are used. Under less aggressive conditions, when crevice corrosion is more difficult to initiate, the value of E R,crev may differ substantially from method to method.4
Determining the lowest potential at which crevice corrosion is able to stabilise or propagate is the first step for assessing the likelihood of crevice corrosion of an engineered barrier for a geological repository. Water must be present for the localised attack to occur.5 The oxidising power of the environment will set the value of the corrosion potential E corr, which may exceed E R,crev, in the timeframe of the repository operation. For instance, the presence of oxygen or Fe(III) cations will lead to high E corr values, while oxygen free environments with low impurity concentrations will lead to low E corr values. If there is a possibility of crevice corrosion attack, the propagation rate is to be studied as a second step. Models may be used to predict if the localised attack will eventually perforate the engineered barrier. 3 3,4
The objective of this work is to compare the different electrochemical methods (CPP, THE, PS, PD-PS-PD and PD-GS-PD) used to evaluate the susceptibility of alloy 22 to crevice corrosion in chloride solutions. The effects of the crevice former material, applied torque and surface roughness were also investigated.
Experimental
Alloy 22 (N06022) specimens were prepared from wrought mill annealed plate stock. The chemical composition of the alloy in weight per cent was 59·56Ni–20·38Cr–13·82Mo–2·64W–2·85Fe–0·17V–0·16Mn–0·008P–0·0002S–0·05Si and 0·005C (heat 059902LL1). Prism crevice assembly specimens were used. They were fabricated based on ASTM G4817 that contained 24 artificially creviced spots formed by a ceramic washer (crevice former) wrapped with a 70 μm thick polytetrafluoroethylene (PTFE) tape. The applied torque was 5 N m unless stated otherwise. Some tests were performed using solid PTFE crevice formers. The applied torque in these tests was 1 N m. The prism crevice assembly specimen has been described before. 7 7,16 The tested surface area was ∼14 cm2. The specimens had a finished grinding of abrasive paper no. 600 unless stated otherwise. They were degreased in acetone and washed in distilled water. Polishing was performed 1 h before testing.
All the electrochemical tests were conducted in a 1 L, three-electrode vessel (ASTM G5).18 A water cooled condenser combined with a water trap was used to avoid evaporation of the solution and to prevent the ingress of air (oxygen). The temperature of the solution was controlled by immersing the cell in a water bath, which was kept at a constant temperature. The temperature set point was 90°C in all the tests. All the tests were performed at air pressure. N2 was purged through the solution 1 h before testing and was continued throughout the entire test. The reference electrode was a saturated calomel electrode (SCE), which has a potential of 0·242 V more positive than the standard hydrogen electrode at room temperature. The reference electrode was connected to the solution through a water cooled Luggin probe. The counter electrode consisted of a platinum foil (total area, ∼50 cm2) spot welded to a platinum wire. All the potentials in this paper are reported in the SCE scale.
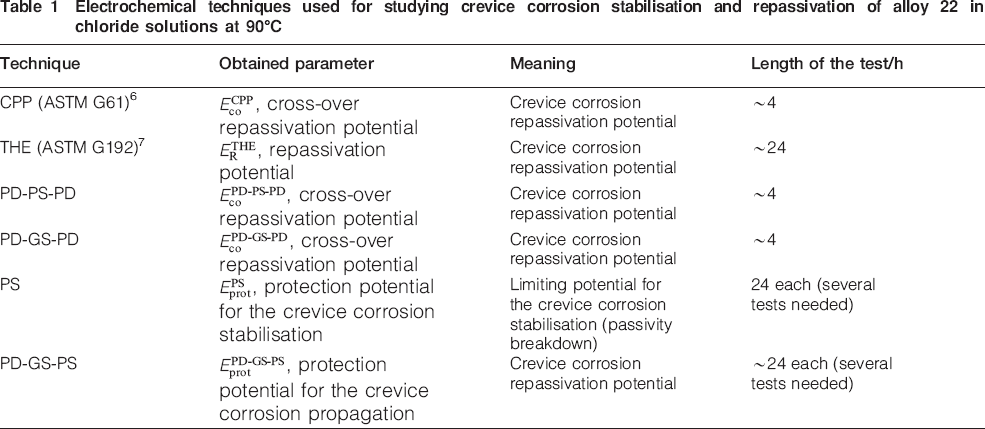
The electrochemical techniques used for determining the critical potentials of alloy 22 are listed in Table 1. The CPP,6 THE,7 PD-PS-PD and PD-GS-PD methods are routine techniques for obtaining the repassivation potential. On the other hand, the PS and PD-GS-PS methods are time consuming techniques for obtaining the protection potentials for crevice corrosion stabilisation and propagation respectively. The results from these two latter methods are used for comparison and validation of the reliability of the data obtained from the routine methods.
Electrochemical techniques used for studying crevice corrosion stabilisation and repassivation of alloy 22 in chloride solutions at 90°C
Results
Routine methods
Figure 1 shows the determination of the crevice corrosion repassivation potential of alloy 22 in 1M NaCl at 90°C by three different methods. The methods started with a potentiodynamic scan in the anodic direction at a rate of 0·167 mV s−1. A cathodic pretreatment of 5 min at 5 μA cm−2 was performed before. The different values of the potential of zero current in the three curves can be ascribed to different oxygen concentrations, surface contamination from the abrasive paper, etc. This fact did not affect the determination of the repassivation potential. In the CPP method, the potential scan was reversed when the current density reached 1 mA cm−2. The PD-PS-PD and PD-GS-PD methods set, as an intermediate step, a 2 h potential/current hold at 0·3 V(SCE)/30 μA (∼2 μA cm−2) respectively. Afterwards, the potential scan was reversed. The three methods finished when the measured current became cathodic. E R,crev was determined as a cross-over E co between the forward and backward potential scans.
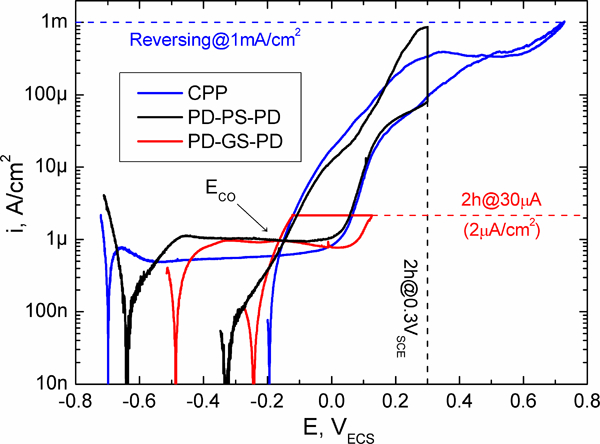
Techniques (CPP, PD-PS-PD and PD-GS-PD) used for determining crevice corrosion repassivation potential of alloy 22 in 1M NaCl at 90°C
Figure 2 shows the determination of the crevice corrosion repassivation potential of alloy 22 in 1M NaCl at 90°C by the THE method. This method also started with a potentiodynamic scan in the anodic direction at a rate of 0·167 mV s−1. The potential scan was stopped when the measured current reached 30 μA (∼2 μA cm−2), and then this current was applied galvanostatically for 2 h. The potential reached after this period was taken as a set point for the following stage, which consisted of reducing the potential in 10 mV potentiostatic steps of 2 h each, until crevice corrosion repassivation was achieved. E R,crev was determined as the highest potential at which the current decreased as a function of time during the 2 h step, and no further current increase was observed at lower potentials  .
.
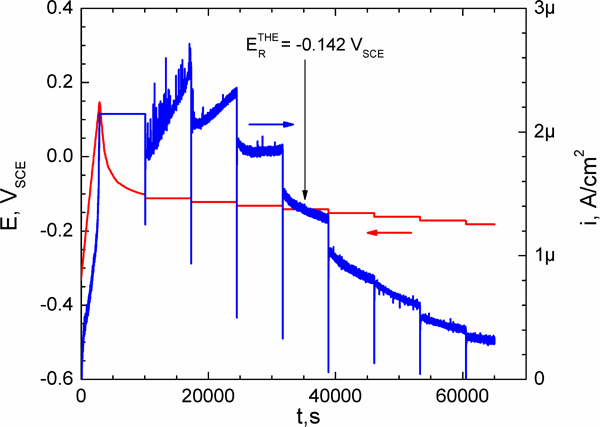
Tsujikawa–Hisamatsu electrochemical technique used for determining crevice corrosion repassivation potential of alloy 22 in 1M NaCl at 90°C
In the four routine methods, three different stages may be distinguished: induction (stage 1), propagation (stage 2) and repassivation of crevice corrosion (stage 3). Stage 1 is almost identical for all the methods, consisting of a potentiodynamic scan until a prestated potential or current condition is reached. Stage 2 consists of crevice corrosion propagation at a fixed applied potential (PD-PS-PD) or current (THE and PD-GS-PD). In the CPP method, the propagation stage is not explicitly separated, and the propagation occurs partially in the forward and backward scans. The THE and PD-GS-PD methods limit the amount of propagation to a small value given by the product of the applied current (30 μA) and the propagation time (2 h). The CPP and PD-PS-PD methods do not control the amount of propagation. The THE, PD-GS-PD and PD-PS-PD methods may avoid the polarisation at potentials in the transpassivity range by setting appropriate parameters for the propagation stage (low currents or potentials). In most of the cases, the CPP method includes a potential scan in the transpassivity range, unless a very small current is set for reversing the scan. Transpassivity might interfere with crevice corrosion, complicating the determination of the repassivation potential. Stage 3 is a potential scan in the cathodic direction, which may be performed potentiodynamically (CPP, PD-GS-PD and PD-PS-PD) or in steps (THE). The PD-GS-PD and THE methods only differ in the repassivation stage.
Time consuming methods
Figure 3 shows PS tests for alloy 22 in 0·5M NaCl at 90°C. These tests consisted of the application of a constant potential for a period of 24 h. The selected potentials were in the vicinity of a previously reported repassivation potential. The repassivation potential must be known beforehand in order to reduce the amount of tests to reach the protection potential. It may be obtained from any of the routine tests described before. The observation of a current increase in time was indicative of crevice corrosion stabilisation. When only a current decrease in time was observed in the 24 h period, crevice corrosion did not initiate, which was verified by microscopic observation. The highest potential at which crevice corrosion did not initiate was set as the protection potential for crevice corrosion initiation  . In the example of Fig. 3, five tests of 24 h were needed to obtain
  .
.
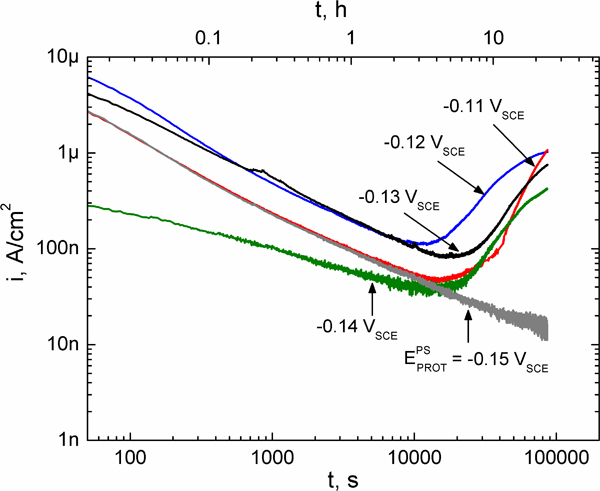
Potentiostatic technique used for determining protection potential for crevice corrosion stabilisation of alloy 22 in 0·5M NaCl at 90°C
Figure 4 shows the PD-GS-PS tests for alloy 22 in 1M NaCl at 90°C. This method started with a potentiodynamic scan in the anodic direction at a rate of 0·167 mV s−1. The potential scan was stopped when the measured current reached 30 μA (∼2 μA cm−2), and then this current was applied galvanostatically for 2 h. Afterwards, a potential in the vicinity of a previously reported repassivation potential was applied for 20 h. The repassivation potential must be known beforehand for applying this method. The observation of a current increase in time was indicative of crevice corrosion propagation. On the other hand, a current decrease in time was indicative of crevice corrosion repassivation. The highest potential at which crevice corrosion repassivated was set as the protection potential for the crevice corrosion propagation  . In the example in Fig. 4, three tests of ∼24 h were performed to obtain
  .
.
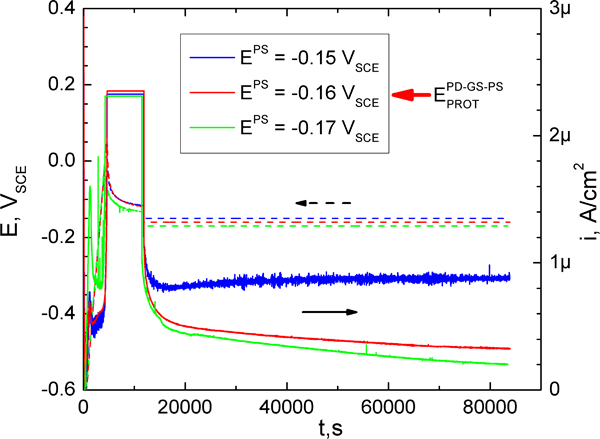
Potentiodynamic–galvanostatic–potentiostatic technique used for determining protection potential for crevice corrosion propagation of alloy 22 in 1M NaCl at 90°C (E PS: applied potential in stage 3)
Comparison of methods
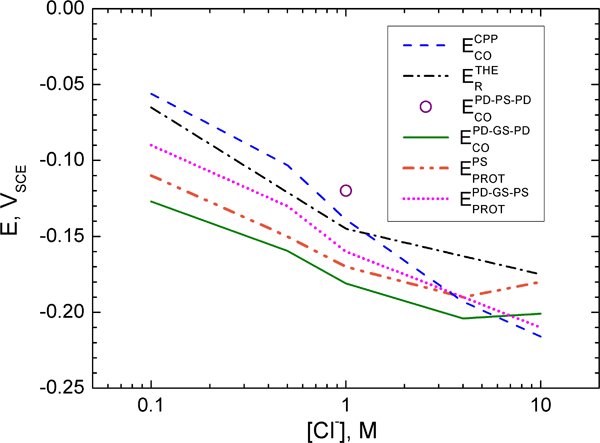
Figure 5 shows the average crevice corrosion repassivation potentials obtained from routine methods and the protection potentials obtained from the PS and PD-GS-PS methods, for alloy 22 at 90°C, as a function of chloride concentration. The critical potentials obtained from the PS and PD-GS-PS methods were used as reliable parameters for comparison. It should be noted that  and
and  did not differ in more than 30 mV, indicating that crevice corrosion stabilisation and repassivation potentials are very close when determined near the steady state. A comparison of the critical potentials from routine methods with those of the time consuming methods indicated the possibility of crevice corrosion below
  and
and  , below
  for the diluted solutions and below
  for the most concentrated solution (5M CaCl2).
  was the most conservative parameter for almost all the chloride concentrations considered.
  was the lowest parameter only for the most concentrated chloride solution. In general, the PD-GS-PD method rendered the most conservative repassivation potential values in a relatively short period of time. An additional safety margin of a few mV should be used for the most concentrated chloride solutions.
Critical potentials for crevice corrosion of alloy 22 at 90°C as function of chloride concentration
Effect of applied torque
Figure 6 shows the crevice corrosion repassivation potential of alloy 22 as a function of the applied torque in 1M NaCl at 90°C. The torque usually applied to solid PTFE crevice formers is shown in Fig. 6 for comparison. 9 10 9,10,15 The repassivation potential obtained by four different methods did not show any dependence with the applied torque for torques higher than 2 N m. The application of torques lower than 2 N m seemed to affect the reproducibility of the results, increasing both the obtained repassivation potential and its statistical dispersion.
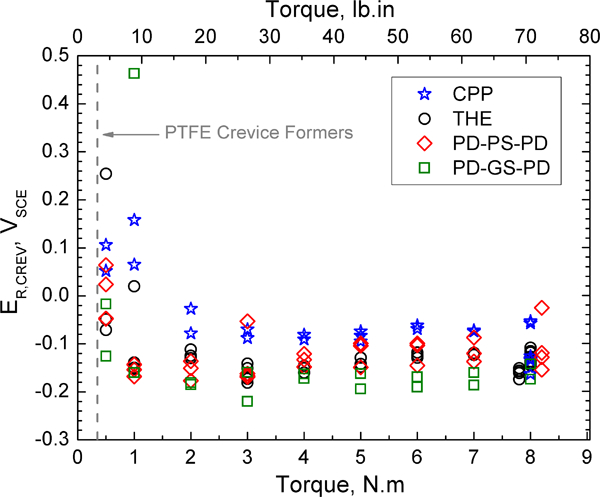
Crevice corrosion repassivation potential of alloy 22 as function of applied torque in 1M NaCl at 90°C
Effect of surface roughness
The effect of surface roughness on the repassivation potential value was assessed by comparing the finished grindings of abrasive paper nos. 220 and 600 and 1 μm diamond paste. The PD-GS-PD method was used for the comparison in 1M NaCl solution at 90°C. The average values of  were −0·162, −0·181 and −0·184 V(SCE) for the 220 and 600 abrasive papers and the 1 μm diamond paste finished grindings respectively. The corresponding standard deviations were 0·027, 0·010 and 0·017 V for the 220 and 600 abrasive papers and the 1 μm diamond paste finished grindings respectively. Increasing the surface roughness caused a small increase in the obtained
  and a moderate increase in the statistical dispersion. This observation indicated that when PTFE wrapped ceramic crevice formers are used, the surface finished grinding of the alloy 22 specimen is not a relevant parameter.
Effect of crevice formers
A comparison was made of the repassivation potentials obtained with PTFE wrapped ceramic crevice formers and those obtained with solid PTFE crevice formers. The PD-GS-PD method was used for the comparison in 1M NaCl solution at 90°C. The statistical analyses included 13 tests with PTFE wrapped ceramic crevice formers and 10 tests with solid PTFE crevice formers. One of the tests with solid PTFE crevice formers was discarded as crevice corrosion did not occur. The average value of  was −0·181 V(SCE), with a standard deviation of 0·010 V, for the PTFE wrapped ceramic crevice formers. The average value of
  for the solid PTFE crevice formers was −0·136 V(SCE), with a standard deviation of 0·048 V. The use of solid PTFE as a crevice former material led to a higher statistical dispersion in comparison with the PTFE wrapped ceramic. Student's t test was used to establish if the results obtained with the two different crevice former materials were comparable. The test indicated a probability of 2·1% for the two samples to be a part of a population with the same mean value. This result showed that the PTFE wrapped ceramic crevice formers formed more severe crevices than the solid PTFE crevice formers.
Discussion
It is generally assumed that crevice corrosion will only occur when E corr of the alloy exceeds its corresponding E R,crev in a certain environment.5 The determination of E R,crev is a key factor for assessing the likelihood of crevice corrosion.3 – 5 Several methods for determining E R,crev were evaluated in the present work. Most of them led to similar E R,crev values, especially in the most aggressive conditions, as reported elsewhere.
11
11,12 A comparison of routine methods with more reliable time consuming methods indicated that crevice corrosion can be expected some mV below the repassivation potentials. The PD-GS-PD method was found to be the most conservative laboratory technique, which gave the lowest repassivation potential in a relatively short testing time. Nevertheless, an additional safety margin of a few mV should be considered for  in chloride solutions with a concentration higher than 4M. PTFE wrapped ceramic crevice formers are preferred over solid PTFE crevice formers, since the formers led to the most conservative results with the least statistical dispersion. Surface roughness was not a sensitive variable affecting the determination of E R,crev when PTFE wrapped ceramic crevice formers were used. An applied torque higher than 2 N m was necessary to obtain reproducible results for any of the considered methods using PTFE wrapped ceramic crevice formers.
Conclusions
Routine methods and more reliable time consuming methods were applied to obtain the crevice corrosion repassivation potential of alloy 22 in chloride solutions at 90°C. The PD-GS-PD technique was found to be the most conservative laboratory technique, which gave the lowest repassivation potential in a relatively short testing time. Torque values higher than 2 N m were found to be necessary for obtaining reliable repassivation potential values using PTFE wrapped ceramic crevice formers. Surface roughness of the metallic samples did not play a significant role with these crevice formers. The PTFE wrapped ceramic crevice formers formed more severe crevices and led to lower repassivation potentials than the solid PTFE crevice formers.
Footnotes
Acknowledgements
R. M. Carranza acknowledges the financial support from Agencia Nacional de Promoción Científica y Tecnológica of the Ministerio de Educación, Ciencia y Tecnología and from the Universidad Nacional de San Martín from Argentina.