
Abstract
The prediction of corrosion damage to times that are experimentally inaccessible by a large factor (e.g. to over 1000 years) is vitally important in assessing various concepts for the disposal of high level nuclear waste. Such prediction can only be made using deterministic models, whose predictions are constrained to being ‘physically real’ by the natural laws [conservation of mass, energy, charge and mass charge equivalence (Faraday's law)]. In this paper, the authors describe the measurement of experimental data that will allow the deterministic prediction of damage to the carbon steel overpack of the super container in Belgium's proposed Boom Clay repository using the point defect model to extrapolate damage to future times. In this paper, the authors describe an experimental programme that is designed to generate values for various model parameters that will be required in making the damage predictions. The impact of chloride, sulphide and thiosulphate anions and mixtures of these species, on the electrochemical behaviour of carbon steel in contact with simulated concrete pore water, is examined.
Keywords
Introduction
The supercontainer concept for the disposal of high level nuclear waste in Belgium's proposed Boom Clay repository comprises a carbon steel overpack containing the waste and an outer, stainless steel liner that defines an annulus containing a cementitious material (similar to Portland cement based concrete), as defined in Part I of this series.1 Both the outer surface of the overpack and the inner surface of the liner will be in contact with concrete pore water, which, for our current purposes is defined as saturated Ca(OH)2+NaOH to yield a pH at 25°C of 13·5. It is recognised, however, that if (or when) the stainless steel liner is breached, sulphide species formed by oxidation of pyrite (FeS2) in the near field, Boom Clay environment may penetrate into the annulus and cause accelerated corrosion of the carbon steel. Chloride ion is present in both concrete and Boom clay environments, to an extent that it, too, must be considered a deleterious species that is capable of inducing passivity breakdown on both carbon steel and stainless steel if the potential is sufficiently high.2 Furthermore, during the initial period of waste disposal, depending upon the type of waste contained (reprocessed waste versus non-reprocessed waste), the initial temperature will be in excess of 100°C and will decay over 300 years to the ambient temperature of ∼22°C. The calculations presented in Part I1 predict that oxygen in the annulus will be consumed quickly by corrosion and that the annulus environment will become essentially anoxic after a few years, after which hydrogen evolution, rather than oxygen reduction, becomes the principal cathodic reaction. As the oxygen concentration decreases, the hydrogen concentration increases and the temperature decreases, the corrosion potential is predicted to increase with the fall in temperature dominating at least over the first 300 years. Once the temperature has decayed to ambient and the annulus is saturated with hydrogen, the corrosion potential is predicted to be more negative than about −0·75 V(SHE).
In the present paper, the authors report the corrosion behaviour of carbon steel during the initial oxic period, i.e. when the potential is expected to be between −0·4 and +0·3 V(SHE). The authors have been particularly concerned with measuring the steady state value of the passive current density and electrochemical impedance spectroscopy (EIS) data for carbon steel in simulated concrete pore water [Ca(OH)2+NaOH to yield a pH at 25°C of 13·5] containing Cl−, S2− and  or mixtures of these species at temperatures ranging from 25 to 80°C. Additionally, on the basis of the point defect model (PDM),2 – 4 the authors have developed models for the impedance of carbon steel from which values may be extracted for the PDM parameters that may be used in the model for predicting the corrosion behaviour over the long term (thousands of years). Space does not permit a detailed discussion of these models here, and the reader is referred to the literature for details.
2
2,3 The authors’ present work is extending these measurements to anoxic conditions, where the corrosion potential is predicted to be much lower [<−0·75 V(SHE)] and the temperature is predicted to be near ambient.
or mixtures of these species at temperatures ranging from 25 to 80°C. Additionally, on the basis of the point defect model (PDM),2 – 4 the authors have developed models for the impedance of carbon steel from which values may be extracted for the PDM parameters that may be used in the model for predicting the corrosion behaviour over the long term (thousands of years). Space does not permit a detailed discussion of these models here, and the reader is referred to the literature for details.
2
2,3 The authors’ present work is extending these measurements to anoxic conditions, where the corrosion potential is predicted to be much lower [<−0·75 V(SHE)] and the temperature is predicted to be near ambient.
Experimental
All the experiments were carried out in a typical three-electrode electrochemical cell. A rod of carbon steel with an exposed area of 7·15 cm2 was used as the working electrode. The exposed surface of the working electrode was polished with SiC paper from 600 to 2400 grit and then polished with diamond paste to 1 μm and then finally polished with colloidal silica/alumina suspension down to 0·05 μm. A mercury/mercury oxide (Hg/HgO) in 2M NaOH [112 mV(SHE)] was used as reference electrode and connected to the cell via a Lugging probe. Nickel gauze, 40 mesh of large surface area, was used as the counter electrode.
The experimental electrolyte was saturated Ca(OH)2 solution with the addition of sufficient sodium hydroxide to bring the pH up to 13·5, which simulates the concrete pore electrolyte. The temperature was 80°C, and the polarisation experiment lasted for ∼1 year (343 days). For the long term experiments, the electrochemical cell was powered by an EG&G model 363 potentiostat/galvanostat, and the impedance measurement was carried out using Gamry potentiostat/galvanostat with frequency response analyser, while a Solartron 1286 potentiostat/galvanostat coupled with Solartron 1250 frequency response analyser was used to conduct the short term experiments.
Six cells were operated simultaneously for the long term experiment in simulated concrete pore water under anoxic conditions, each with a separate potentiostat. Experiments included those at open circuit potential and under constant potential control. Because of the lack of suitable recording systems, the current (potentiostatic polarisation) and the potential (open circuit experiment) were recorded manually on a daily basis. The EIS measurements were conducting weekly and were recorded using an excitation voltage of 10 mV (peak to peak), and the frequency was changed from 100 kHz to 0·01 Hz, with the impedance measured at five frequencies per decade. All EIS data were measured sequentially in both descending and ascending frequency directions.
Results and discussion
Electrochemical impedance spectroscopy4 – 8 was used to study the nature of the processes that occur at the metal/solution interface in the presence of sulphide, chloride, thiosulphate and mixtures of these species, but due to the limitation of space, the authors will present the results only for sulphide, as an example. The EIS spectra for passive mild steel were measured over a wide range of frequency (typically from 100 kHz to 0·01 Hz) as a function of the formation potential across the passive range in saturated solution of Ca(OH)2+NaOH at pH 13·5 in the presence of the above mentioned species. The impedance was measured after holding the potential constant for 20-24 h in order to ensure that the passive film exists in the steady state, as determined by the constancy of the current. Since the stability of the electrochemical system during the EIS measurements is critical to obtaining viable data, the quality of the EIS data was checked both experimentally and theoretically, with the latter being performed using the Kramers–Kronig transforms. The data were checked experimentally by stepping the frequencies from high to low and then immediately back from low to high, with the impedance being measured at each step, to ascertain that the same values were obtained at equivalent frequencies in the two directions. If the system is in the steady state, which means that the thickness and current density are independent of time, the impedance data should match in the two frequency step directions.
Figure 1a shows the Nyquist plots for EIS data of the passive film formed on carbon steel in saturated solution of Ca(OH)2+NaOH in pH 13·5 at 60°C at an applied film formation potential of 0·0 mV(Hg/HgO) as a function of sulphide concentration. The passive film was formed after potentiostatic polarisation for 20 h (short term experiment). The impedance data were found to be correctly transformed according to the Kramer–Kronig integral transforms,8 – 10 demonstrating that the system conforms to the constraints of linear system theory. The form of the plots in Fig. 1 is typical of those for passive metals, indicating the transport of defects and other charge carriers within the film (e.g. electrons and holes). For the lowest frequency sampled (0·01 Hz), the impedance clearly decreases with increasing sulphide concentration, showing that the sulphide is a depassivation species. In consequence, it is clear that sulphide catalyses the transfer of charge across the passive film.
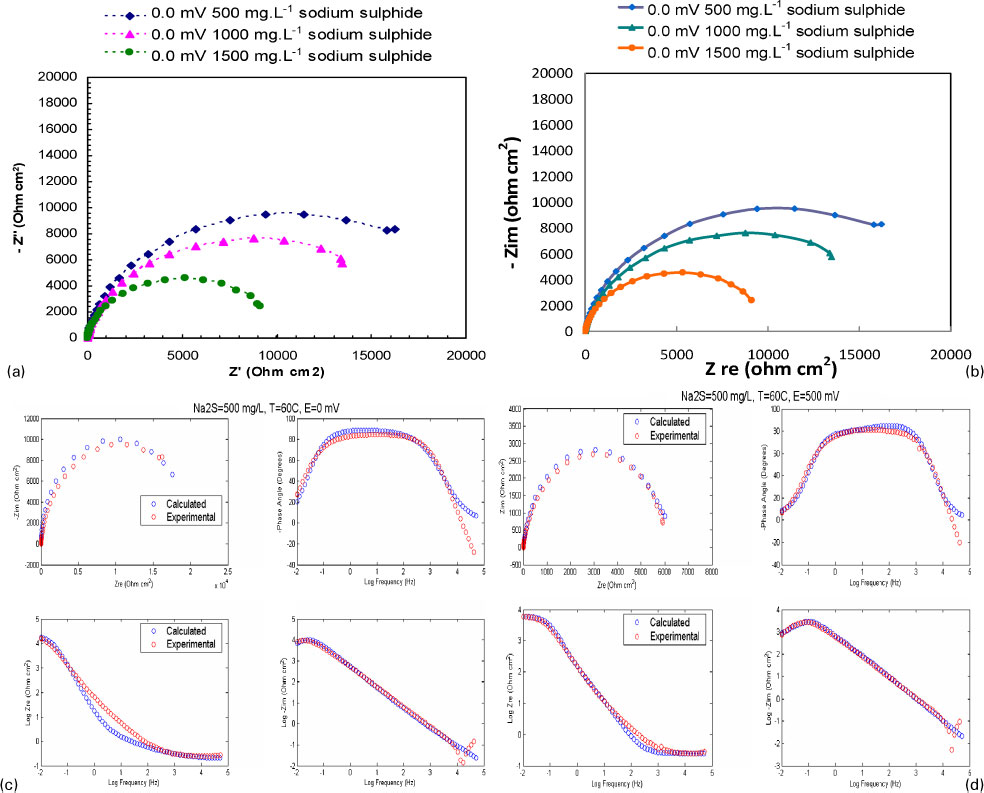
a Nyquist plots for passive film on carbon steel at 0·0 mV(Hg/HgO) as function of sulphide concentration at 60°C, b Nyquist plots calculated from optimised parameter values generated from impedance data shown in Fig. 3, and optimised data of Nyquist and Bode plots in Fig. 3 c under 0·0 mV applied potential in 500 mg L−1 sodium sulphide and d at 500 mV applied potential under same conditions
Figure 1b–d demonstrates the use of the parameters obtained by optimisation of the PDM on experimental data, in which standard rate constants  , polarisability α, transfer coefficients α i, electric field ϵ and other parameters were obtained. The optimised parameter values were then used subsequently to calculate the real and imaginary components of the impedance, and the calculated values were compared directly with the experimental data. The experimental and calculated data plotted in Fig. 1a and b are in good agreement, which instil considerable confidence that the parameter values may be used to estimate other important properties of the passive film, including its ability to protect the metal over extremely long exposure periods.
It was initially decided to perform long term experiments under oxic and anoxic conditions in simulated concrete pore water comprising saturated solutions of Ca(OH)2+NaOH with pH 13·5 at 80°C. The objective of these experiments was to determine whether the passive current density for carbon steel changes over extended polarisation periods (ranging in almost 1 year polarisation time) from that observed in the short term experiments (ranging over 20-24 h polarisation time).
Figure 2 displays the open circuit potential collected over a period of 343 days for low carbon steel tested under the above mentioned conditions. It is clear from Fig. 2 that the steady state is not achieved over the experimental time and the potential drifts towards the noble direction as time goes on. This behaviour is in agreement with the predictions of the PDM 1 1,4 that the passive film is composed of a bilayer or multilayer structure, having a defective oxide adjacent to the metal surface (barrier layer) and an outer layer which formed from the hydrolysis of metal cations that are ejected from the barrier layer into the solution. According to the PDM, the principal defects in the barrier layer are oxygen vacancies and/or cation interstitials. These defects yield an n type semiconductor behaviour.11 – 13
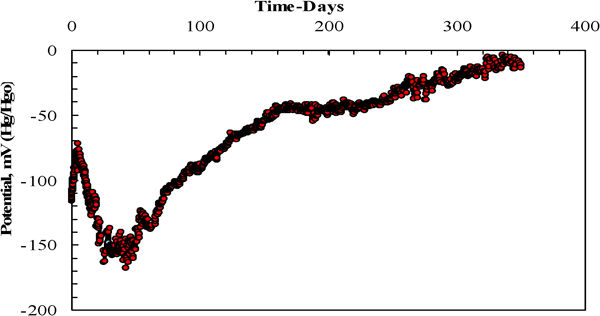
Open circuit potential at 80°C in saturated Ca(OH)2+NaOH solution at pH 13·5 over 343 days
Figure 3 shows the long term potentiostatic polarisation curve for passive carbon steel in saturated Ca(OH)2+NaOH solution at pH 13·5 at 80°C as a function of applied potential over 343 days of polarisation. The current transients are typical in form, in that the current density decreases approximately exponentially with time before attaining a steady state. Also to be noted is the increasing current density at 200 and 0·0 mV, indicating the presence of metastable pitting events and/or crevices due to passivity breakdown under the prevailing conditions (in the absence of any aggressive species). At some potentials, e.g. 400 mV(Hg/HgO), the current density continues to decreases and may be as much as an order of magnitude lower than that indicated by the short term experiments. It is also remarkable, as shown in Fig. 3, that the steady state current density does not depend strongly on the applied film formation potential [from −200 to 500 mV (Hg/HgO)], which is consistent with the diagnostic criteria obtained from the PDM for an n type oxide film character.11 – 13
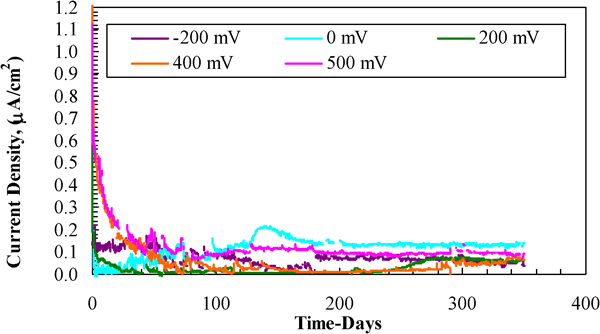
Long term potentiostatic polarisation in saturated Ca(OH)2+NaOH in pH 13·5 at 80°C after polarisation period of 343 days
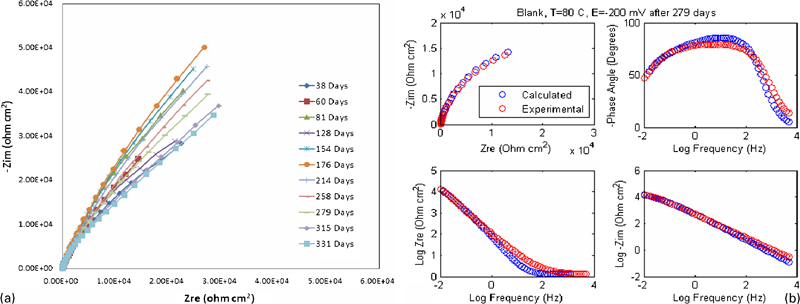
Figure 4 Figure 5 Figures 4-6 show a typical impedance spectra for the passive carbon steel in the saturated solution of Ca(OH)2+NaOH in pH 13·5 at 80°C for different applied potentials and for several extended periods of time. These figures also compare the experimentally measured impedance and that calculated from the parameter values extracted from the PDM by optimisation. It is remarkable that the impedance measurements show minor variation in the impedance magnitude with time during the entire length of the experiment, indicating that the impedance measurements appear to be sensitive to deviation from the steady state conditions. For the potential of −200 mV(Hg/HgO), some changes in the impedance are observed over the first 30 days of the experiment; the Nyquist plot shows a smaller, initial value of the impedance at a fixed frequency, but after 56 days of exposure, the impedance becomes much less dependent on time. These data suggest that modifications of the passive film occur over the long term, at times well beyond those employed in the short term experiments.
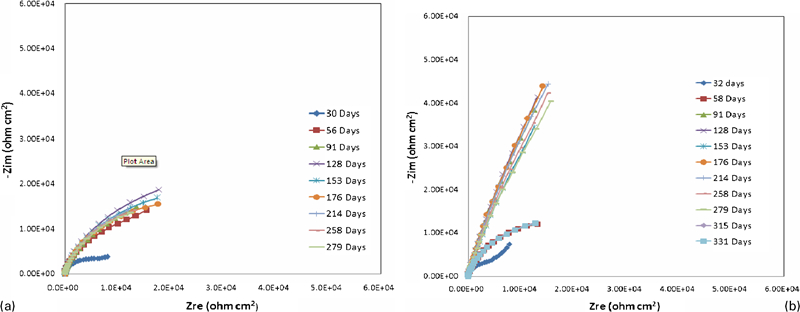
Nyquist impedance diagram calculated from PDM using optimised model parameters a for passive carbon steel at −200 mV(Hg/HgO) from 30 up to 279 days of exposure and b at 200 mV(Hg/HgO) applied potential from 32 up to 331 days
Nyquist impedance diagram calculated from PDM using optimised parameters a for passive carbon steel at 500 mV(Hg/HgO) from 38 up to 331 days and b Nyquist and Bode plots for passive carbon steel at −200 mV(Hg/HgO) after 297 days calculated from PDM using optimised model parameters

Nyquist and Bode plots calculated from PDM using optimised parameters a for passive carbon steel at 200 mV(Hg/HgO) after 176 days and b at 500 mV(Hg/HgO) after 331 days
Analysis of impedance data
Impedance model
The impedance model developed in this work to interpret the impedance data is based upon the PDM and incorporates elements of the authors’ previous works (Fig. 7).4 – 7 Briefly, the authors have taken the total differential of the expression for the passive current density under non-steady state conditions in terms of the independent variables [voltage, barrier layer thickness and concentration of metal interstitials at the barrier layer/solution (outer layer) (bl/ol) interface (Fig. 7)], and the authors assume that these independent variables and the passive current density undergo sinusoidal variations with time.4 – 7 Taking the ratio of the vector current to the vector voltage defines the faradaic admittance, the inverse of which is the faradaic impedance. This impedance was then combined with the parallel capacitance for the barrier layer and the parallel resistance due to the transfer of electronic charge carriers (electrons and holes) across the barrier layer, this combination being in series with a parallel combination of a resistance and a capacitance representing the properties of the outer layer (Fig. 8). In this analysis, the rate constants for the reactions at the metal/barrier layer and the barrier layer/outer layer are corrected for the IR potential drop across the outer layer.

Summary of defect generation and annihilation reactions envisioned at interfaces of barrier oxide layer on metal: cation vacancy, v m≡vacancy in metal substrate,  cation interstitial,
  oxygen (anion) vacancy, Mδ +(aq)≡cation in outer layer/solution interface, M M≡cation in cation site on metal sublattice, O O≡oxide ion in anion site on oxygen sub lattice, MOχ /2≡stoichiometric barrier layer oxide; note that reactions (1), (2), (4), (5) and (6) are lattice conservative processes (they do not result in movement of interface), whereas reactions (3) and (7) are non-conservative5
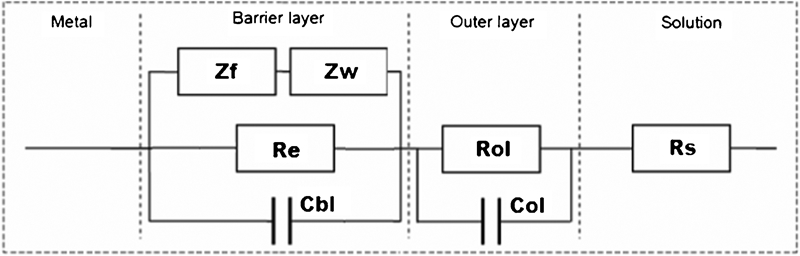
Electrical equivalent circuit used to model impedance properties of passive iron, where Z f is faradaic impedance, Z W is Warburg impedance for defect transport across barrier layer, C bl is capacitance in parallel with barrier layer, R ol and C ol are specific resistance and capacitance respectively of outer layer, and R s is uncompensated resistance between surface of outer layer and tip of Luggin probe of reference electrode
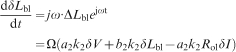
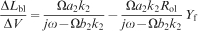
The expression for the faradaic admittance is developed as
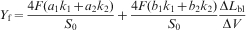
 is the concentration of hydrogen ion at the barrier layer/outer layer interface (assumed to be a constant) and n is the kinetic order of the film dissolution reaction with respect to the concentration of hydrogen ion. Taking the total differential as
Optimisation of PDM on EIS data
The analysis involved optimisation of the above model on the experimental impedance data to yield values for various model parameters [standard rate constants and transfer coefficients for the interfacial reactions (Fig. 1), electrical field strength, polarisability of the bl/ol interface and other important model parameters]. Typical values of the parameter values that are obtained by optimisation are given in Table 1. These data allow us to calculate the properties of passive iron over a wide range of conditions. The effectiveness of the optimisation procedure is illustrated by the ability of the parameter values (Table 1) to reproduce the experimental impedance data ( Figure 1 Figure 5 Figs. 1c and d, 5 and 6), as noted earlier in this paper.
Typical parameters values obtained by optimisation of PDM model on experimental impedance data for iron in 500 mg L−1 sodium sulphide at 60°C
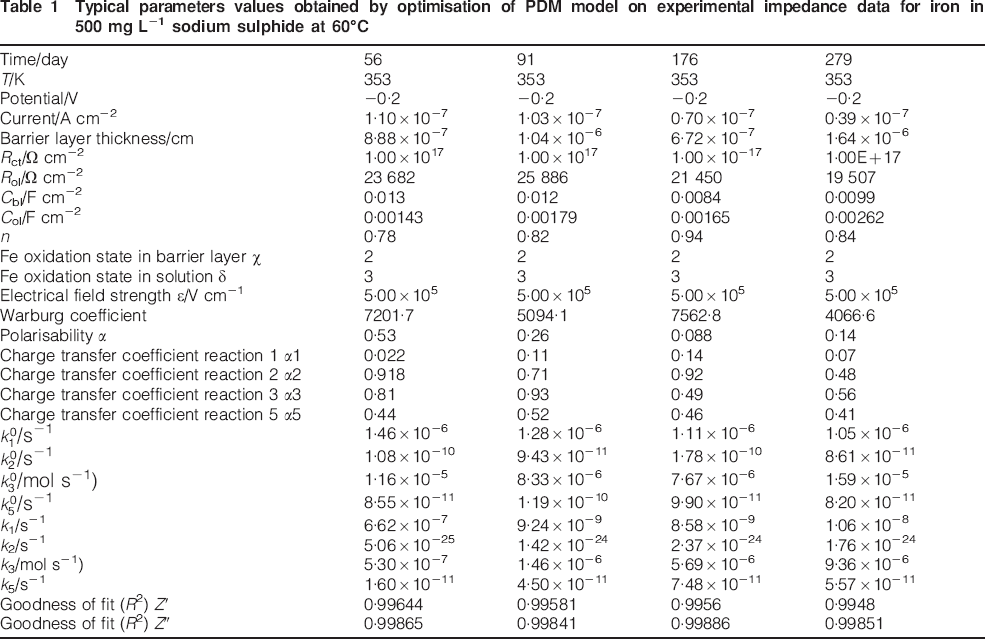
Finally, the optimisation was carried out on the impedance data for each voltage separately. Consequently, certain parameters (standard rate constants, transfer coefficients, polarizability of the barrier layer/solution interface, and the electric field strength should be independent of applied voltage for any given time (found to be the case), but should depend on time as the barrier layer evolves of the long term. This expectation is found, as shown in Table 1.
Conclusions
The findings of this work may be summarised as follows:
The passive current density has been measured potentiostatically in short term experiments after ∼20 h polarisation and in long term experiments lasting more than 343 days.
The short term experiments indicated that the passive state on carbon steel attained a steady state after ∼20 h. However, the long term experiments indicate that the current density continues to decrease and may be as much as an order of magnitude lower than that indicated by the short term experiments. In particular, impedance measurements appear to be sensitive to deviation from the steady state.
The steady state current density is found to be independent of the passive film formation potential, which is consistent with the diagnostic criteria obtained from the PDM for an n type oxide film character.
The impedance of passive carbon steel decreases with increasing sulphide concentration from 0·0 to 1500 mg L−1 sodium sulphide at 60°C.
Optimisation of the PDM on the experimental impedance data for the passive state yields a set of parameter values that can be used to predict the steady state and transient film formation kinetic process over very long exposure periods (film thickness and passive current density).
The measured data are fully in agreement with the expectations from the PDM for the passive state.
Footnotes
Acknowledgements
The authors gratefully acknowledge the support on this work by ONDRAF-NIRAS of Belgium.