
Abstract
The corrosion resistance of aluminium alloys can be improved by the formation of chemical conversion coatings. Usually, chromate pretreatment processes are used. However, because of their high toxicity, alternative methods have been studied in the last years. In the present paper, a process to improve the corrosion resistance of AA 5083 was investigated. The main process consisted of serial immersion in two solutions containing two different cerium salts, followed by a further step involving anodisation in Na2MoO4. The corrosion resistance was investigated by potentiodynamic anodic polarisation tests and electrochemical impedance spectroscopy. The morphology and composition of the oxide layers were characterised by scanning electronic microscopy equipped with an energy dispersive X-ray detector. Serial treatment in the two solutions with different cerium salts and H2O2 produced a more uniform and thicker layer with a larger amount of deposits above the alloy cathodic areas than the single two treatments. In this way, the alloy corrosion resistance in chloride environments was improved and decreased the anodic reaction rate. When anodisation in molybdate salts was added, even better results were found. The corrosion resistance was higher due to a thicker and less conductive passive layer.
Keywords
Introduction
Owing to their properties, such as low density and good workability, aluminium alloys have a wide range of uses, and therefore, they are the subject of a very large number of experimental studies on their mechanical and chemical properties and particularly on their corrosion behaviour.1 AA 5083 is widely used for many applications in the automobile, marine and construction industries due to its high strength/weight ratio, reasonable corrosion resistance and superelasticity behaviour. However, the presence of different kinds of intermetallic precipitates in the alloy matrix leads to a higher susceptibility to localised corrosion, which appears when aggressive ions as chloride break the protection locally or attack the passive film. The main types of intermetallic inclusions in AA 5083 are iron and magnesium rich intermetallics. The iron rich metallic inclusions work as a cathode promoting fast anodic dissolution of aluminium and formation of pit, while the magnesium rich intermetallics have an anodic behaviour, and the high reactivity of magnesium leads to the dissolution and, consequently, to the fast dealloying of these intermetallics.2
One of the most efficient methods to protect Al alloys from localised corrosion is the formation of chemical conversion coatings using solutions containing chromate ions. Owing to its toxicity and carcinogenic nature, chromium is very dangerous for health and far from being environment friendly. Consequently, the research for alternative non-toxic corrosion inhibitors has led to the development of various novel conversion coating processes.3 – 6 One of the most promising systems is based on rare earth elements, especially cerium, which acts as a cathodic inhibitor of aluminium corrosion.7 – 9 Another non-toxic, environment friendly corrosion inhibitor is sodium molybdate Na2MoO4. This agent is classified as an anodic inhibitor for the protection of soft water cooling systems, but its use requires the presence of oxygen or other oxidising agents in solution.10
Being the corrosion resistance of cerium based chemical conversion layers lower than that of chromate ones,11 a Ce–Mo process has been proposed. Aluminium surfaces with exceptional resistance to uniform and localised corrosion were obtained when a step, involving anodic polarisation in molybdate solution, is added to the cerium based chemical conversion coating.12 – 14 However, in these studies, the conversion coatings were obtained by prolonged immersion (4 h) in boiling aqueous solutions of rare earth ions, but the time of conversion treatment can be drastically reduced (10 min), using solutions of Ce(III) salts and H2O2. 11 15 11,15,16
In the present paper, cerium based conversion coatings are obtained on AA 5083 using different cerium salts and an anodisation process, performed at different potentials, in a molybdate solution. The morphology and corrosion resistance of the layers are investigated by scanning electronic microscopy (SEM) and potentiodynamic anodic polarisation and electrochemical impedance spectroscopy (EIS) measurements in NaCl solution.
Experimental
Samples of AA 5083-T6, whose composition is Al–4·50Mg–1·00Mn–0·20Cr–0·4Fe–0·3Cu (wt-%), were prepared following standard metallographic procedures: the aluminium alloy surfaces were polished with SiC grinding paper (grit sizes used: 80, 230 and 500) and rinsed with deionised water. The surface was left rough in order to enhance the adherence of the subsequent conversion coatings.
Cerium based conversion coatings were obtained with two different methods: the first (Ce1) consisted of an immersion in a bath of Ce(NO3)3 and H2O2 for 10 min; the second (Ce2) consisted of an immersion in a bath of CeCl3 and H2O2 for 10 min; and the third (Ce3) consisted of a serial immersion in both baths, that is, Ce1 followed by Ce2.
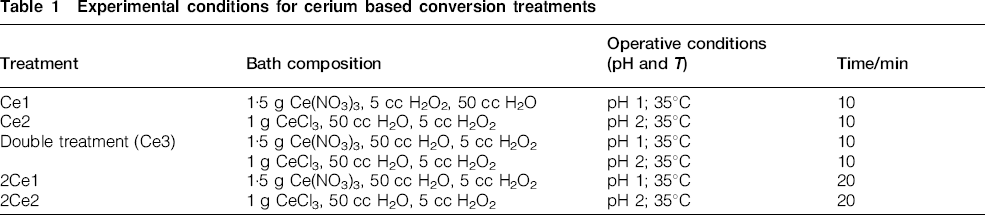
To evaluate the efficiency of the two-step process (Ce1+Ce2) and to compare samples treated in cerium salt solution for the same time (20 min), samples were treated by immersion for 20 min in the bath of Ce(NO3)3(2Ce1) and in the bath of CeCl3(2Ce2). After immersions in chemical conversion baths, the samples were rinsed in deionised water and dried with compressed air. The composition of the baths is indicated in Table 1, and they were established from previous optimisation studies.17
Experimental conditions for cerium based conversion treatments
Molybdenum based conversion coating was obtained by anodisation treatment with 0·1M Na2MoO4 solution for different times (10, 20 and 30 min) at 20°C. Different potentials were applied to the alloy: 100, 300, 500 and 700 mV(SCE).
In order to increase the corrosion resistance of the chemical conversion coatings, Ce3 samples were submitted to anodisation treatment with 0·1M Na2MoO4 solution for 20 min at 20°C with two different applied potentials: 300 and 500 mV. In Table 2, the conditions of anodisation treatments are reported.
Experimental conditions for anodisation in molybdate solution

For surface characterisation, analysis with SEM was performed using a Cambridge Stereoscan 440 electron microscope equipped with a Philips PV9800 energy dispersive spectroscopy (EDS). An electron accelerating voltage of 25 kV was used in the backscattered electron investigation (SEM-BSE).
Corrosion tests were performed in aerated 1%NaCl solution. Potentiodynamic anodic polarisation measurements were performed with an AMEL 551 potentiostat equipped with an AMEL 567 function generator using SCE as reference electrode and a platinum electrode as counter electrode and with a scan rate of 0·5 mV s−1. The EIS measurements were made in 1%NaCl solution in the frequency range between 105 and 10−2 Hz with the perturbation amplitude of 5 mV. The impedance measurements were performed at the value of the open circuit potential and recorded with a Solartron Schlumberger 1255 FRA spectrometer coupled with an EG&G 273 A potentiostat.
Results and discussion
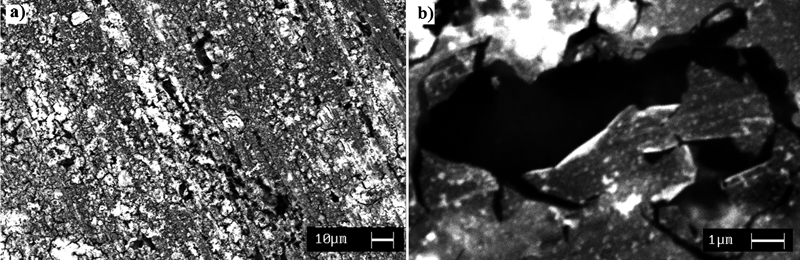
The SEM-BSE image of the untreated sample (Fig. 1a) indicates the presence of two kinds of intermetallics in AA 5083: Al6(FeMnCrSi) and Al6(FeMn), which exhibited a lighter colour than the matrix, and Mg2Si that showed a darker colour than the matrix (particular in Fig. 1a). The first intermetallics affect the corrosion behaviour as they act as permanent cathodes in comparison with the Al substrate, while Mg2Si intermetallics have an anodic behaviour.18
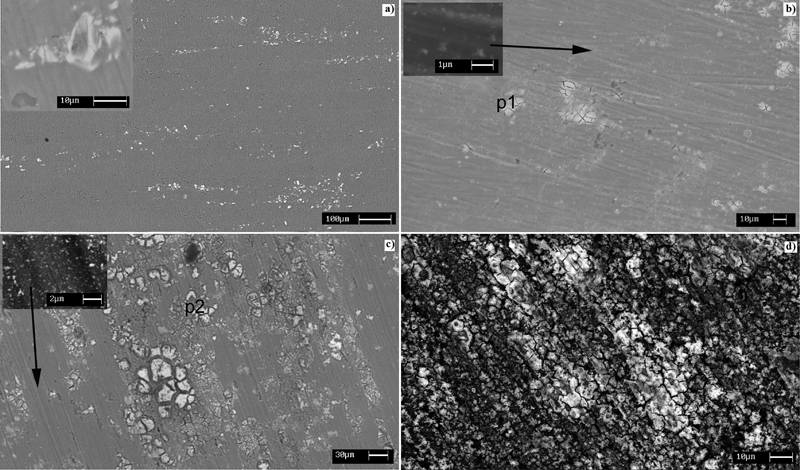
Image (SEM-BSE) of a untreated sample, b Ce1 treated sample [Ce(NO3)3], c Ce2 treated sample (CeCl3) and d treated sample Ce3 [Ce(NO3)3+CeCl3]
Cerium based chemical conversion treatments
The immersion of samples in Ce3+ salts (Ce1 and Ce2) led to the formation of a mixed coating consisting of both cracked cerium rich agglomerates, situated over cathodic intermetallics, and a film of aluminium oxide, in which are dispersed 100-500 nm size particles of cerium oxides (Fig. 1b and c). It is well known that the precipitation of hydrate cerium oxide is induced by the increase in pH, which takes place during the corrosive process (the Ce salt solutions are corrosive for the aluminium alloys), over the cathodic sites where both hydrogen evolution and oxygen reduction reaction to OH− occur.9 The main difference between Ce1 and Ce2 solutions is that the Ce2 solution, being a more aggressive solution (it contains Cl− ions), produces a more marked dissolution of the surface, favouring the precipitation of a coarser and more cracked hydrate cerium oxide layer over the cathodic intermetallics. The chloride ion is a stronger Lewis base than H2O or OH−, and therefore, it is an efficient complexing agent for the Al3+ ion, and it may lower the potential at which the oxidation of Ce3+ is thermodynamically possible,19 promoting the formation of a cerium oxide hydrate layer. The formation of agglomerates started from cathodic sites on the alloys and then grew and expanded to the neighbouring surfaces.
After the Ce1 treatment [immersion in Ce(NO3)3 salts], the samples showed a pale yellow colour on the surface, indicating that a chemical conversion layer was formed. From SEM analysis, the presence of both cerium oxides/hydroxide agglomerates on the cathodic intermetallics and fine precipitates on the matrix is evident (Fig. 1b). The layer is very thin, as it can be inferred from the signals of Fe and Mn revealed by EDS analysis in correspondence of p1 (Fig. 2).
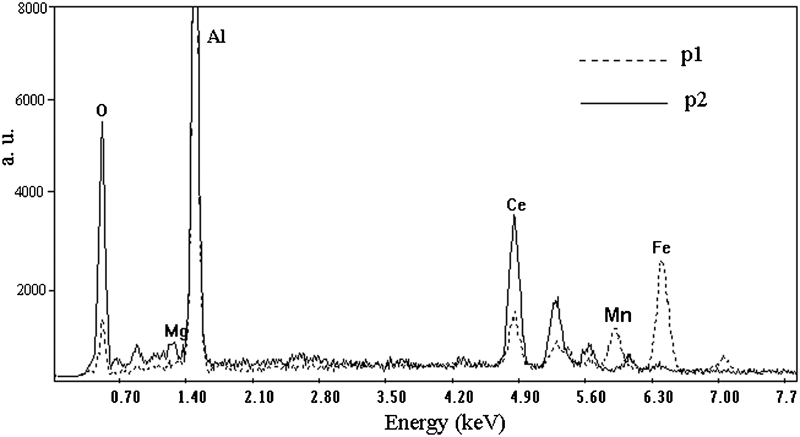
Energy dispersive spectroscopy analysis of Ce1 treated sample above p1 (dashed line) and of Ce2 treated sample above p2 (continuous line)
Scanning electron microscopy analysis of the Ce2 samples (immersed in CeCl3 salts) revealed the presence of a more widespread cracked oxide structure, principally concentrated over the intermetallics, and a higher concentration of small size particles of cerium oxides dispersed on the surface (Fig. 1c). From the EDS analysis, it can be inferred that, in correspondence of the cerium agglomerates, the amount of cerium is higher in the Ce2 sample than in the Ce1 sample (Fig. 2).
The SEM-BSE of the Ce3 sample (Ce1 followed by Ce2 treatment) (Fig. 1d) shows that cerium precipitated all over the surface with a ‘dry mud’ morphology. A whole covering of the surface is obtained, and EDS analysis revealed that the amount of cerium above the whole surface is higher than that detected above the Ce2 sample (Fig. 3).
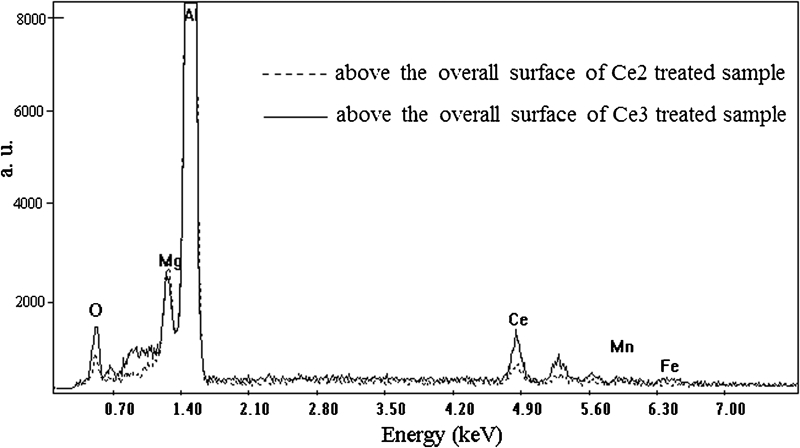
Energy dispersive spectroscopy analysis above overall surface of Ce2 treated sample (dashed line) and of Ce3 treated sample (continuous line)
The SEM characterisation of the 2Ce1 and 2Ce2 samples evidenced that prolonging the time of immersion in the two single solutions from 10 to 20 min induced the formation of an irregular cracked cerium oxide layer where detachments and signs of corrosion were clearly visible. The effect is more remarkable in the sample that was treated in the CeCl3 solution, this solution being more aggressive, where serious damage of the layer can be seen (Fig. 4). A possible explanation of this behaviour is that, by increasing the time of immersion, the corrosive process that initially induced the precipitation of hydrate cerium oxide continues to cause damage of the oxide layer previously formed. The differences between the two single steps, 2Ce1 and 2Ce2, and the two-step process (Ce3) probably derived from the fact that, when the dried layer formed during the immersion nitrate cerium solution is immersed in the chloride solution, a new process of corrosion occurs. In this case, the cathodic sites are the cerium agglomerates and the nanosize particles of Ce, and the anodic site is the substrate, not previously covered. The new corrosion process that takes place induced a further precipitation of hydrate cerium oxide, allowing the formation of a thicker and more homogeneous layer above all the surface.
Images (SEM–BSE) of a 2Ce2 sample treated and b 2Ce2 sample treated at higher magnification
Figure 5 shows the polarisation curves of the samples treated in different cerium baths. All the cerium conversion coatings ennoble both the corrosion potential E corr and the breakdown potential E bd, but higher ennoblement is recorded going from Ce1 and Ce2 to the Ce3 samples. In the same manner, a decrease in the corrosion current density i corr was found, as reported in Table 3. This can be inferred to the inhibition of both cathodic and anodic reaction rates of the alloy by cerium conversion coatings. The cathodic branches of the polarisation curves of the samples immersed in Ce2 and Ce3 solutions are about one order of magnitude lower than those obtained for both untreated and Ce1 solution immersed samples. The higher amount of cerium above the cathodic intermetallics produced by Ce2 and Ce3 treatments, as observed by SEM and EDS investigations, is more efficient to reduce the cathodic reaction than the thinner layer obtained by Ce1 treatment. Moreover, the higher homogeneity of the conversion layer of the Ce3 sample in comparison with the coating of the Ce2 sample provided further reduction of the anodic reaction rates. In Fig. 5, the anodic polarisation curves obtained for the 2Ce1 and 2Ce2 treated samples are also shown. The polarisation curve of the 2Ce1 sample is very similar to that of the Ce1 sample, while the 2Ce2 sample exhibited a higher value of i corr and anodic current and a less noble value of E corr (Table 3). It is evident that increasing the time of immersion (20 min instead of 10 min) in the cerium solutions did not improve the corrosion resistance of the material.
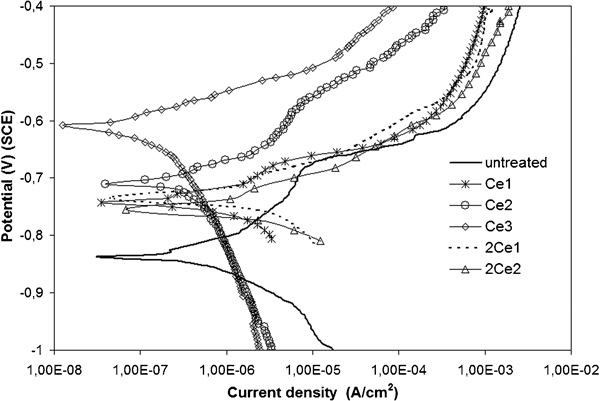
Potentiodynamic anodic polarisation curves of Ce1, Ce2, Ce3, 2Ce1 and 2Ce2 treated samples
Corrosion current densities and corrosion potential of samples
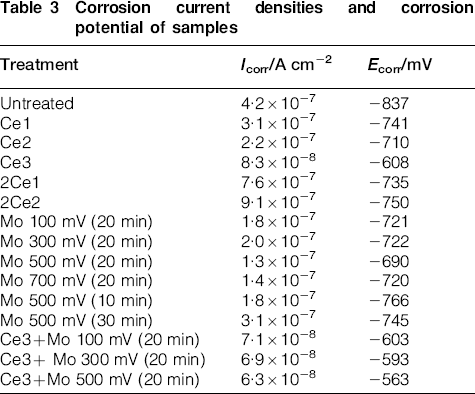
These results are in agreement with the SEM observations, which showed the formation of a cracked and irregular layer on the surface after immersion of the samples in the cerium salt solution for 20 min, especially for the 2Ce2 sample.
To understand better the resistance properties of Ce1, Ce2 and Ce3 samples, EIS tests were performed. The impedance spectra of the untreated and treated samples (Ce1, Ce2 and Ce3) were recorded at the corrosion potential, immediately after the stabilisation of the steady state potential in the corrosive solution, and the Nyquist diagrams obtained are summarised in Fig. 6. As can be appreciated in the Nyquist diagrams, for each sample treated, the arc presents a larger diameter in comparison with that of the untreated sample, which implies a higher degree of protection.
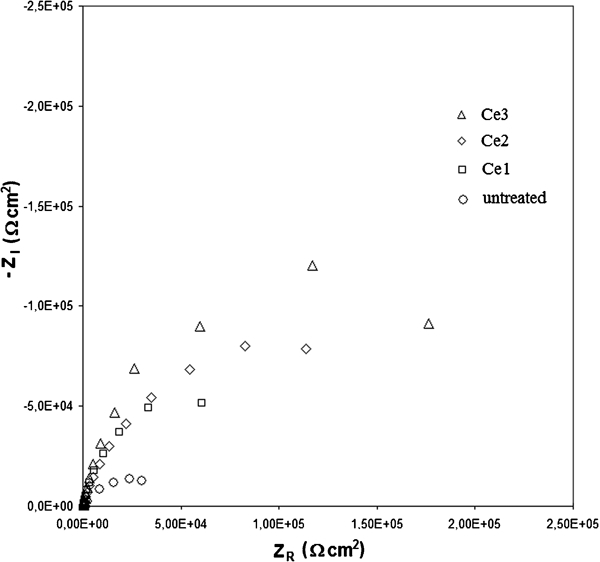
Nyquist diagrams of Ce1, Ce2 and Ce3 treated samples
The model for the cerium surface layer and the equivalent circuit used to interpret the impedance data are shown in Fig. 7: R s is the resistance of the solution, the resistance R 1 has been interpreted as the pore resistance due to electrolyte penetration and at damaged areas of the cerium layer, CPE is the constant phase element of the intact cerium layer and R 2 and C dl are the resistance and the double layer capacitance respectively of the cerium layer/substrate interface. In the equivalent circuit, CPE was utilised instead of a capacitance because often the measured capacitance of the conversion layer is usually not ideal. The impedance representation of CPE is given by

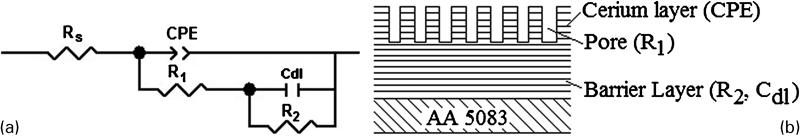
a equivalent circuit for fitting of impedance data and b model for cerium surface layer
To fit the impedance values of the untreated sample, it has been chosen to use the same equivalent circuit adopted for the treated sample to allow a comparison of the data obtained: all the parameters assigned to the cerium layer in this case are related to the oxide film, formed naturally on the alloy.
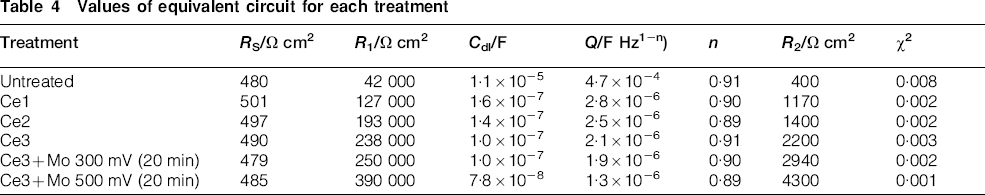
In Table 4, the values of the equivalent circuit are given for the untreated sample and for the three treated samples, and good agreement was shown between the experimental and simulated data. As a matter of fact, very low values of chi square error χ 2 were obtained. From the fitting results, both R 1 and R 2 values increase passing from the untreated sample to Ce1, Ce2 and Ce3 samples, and since the values of R are inversely proportional to the corrosion rate, the higher values of the treated samples indicate that the corrosion resistance increases. The other important parameters are the values of Q, of the CPE and of the capacitor C dl, which, on the contrary, decrease passing from the untreated sample to Ce1, Ce2 and Ce3 samples. Since the values of n corresponding to CPE are ∼0·9, Q can be said to behave similarly to a pure capacitor.
Values of equivalent circuit for each treatment
According to equation (2), which is valid for the parallel plate capacitor of a homogeneous oxide layer

As revealed by SEM-EDS observations and anodic polarisation measurements, the EIS measurements confirm that the Ce3 treatment produces a more protective layer than the Ce1 and Ce2 treatments. Moreover, the highest R 1 value obtained for the Ce3 sample confirms the better corrosion resistance of the layer obtained with this treatment.
Anodic polarisation in 1M Na2MoO4
A preliminary study to investigate the role of molybdate as corrosion inhibitor for the aluminium alloy was carried out. The use of molybdate as anodic inhibitor is well known, and as a matter of fact, the SEM-BSE image of the sample anodised in this salt solution shows that molybdate did not precipitate above all the surfaces but that it can be detected only in restricted areas of the surface (Fig. 8). The EDS analysis revealed that the higher amount of Mo was found in correspondence of the Mg2Si intermetallics, which demonstrate an anodic behaviour (Fig. 9). Therefore, it is possible to conclude that Mo precipitated preferentially on the anodic site of the surface.
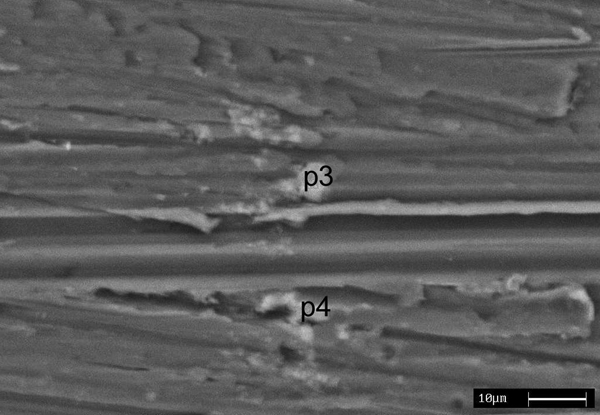
Image (SEM–BSE) of Mo treated sample at 500 mV for 20 min
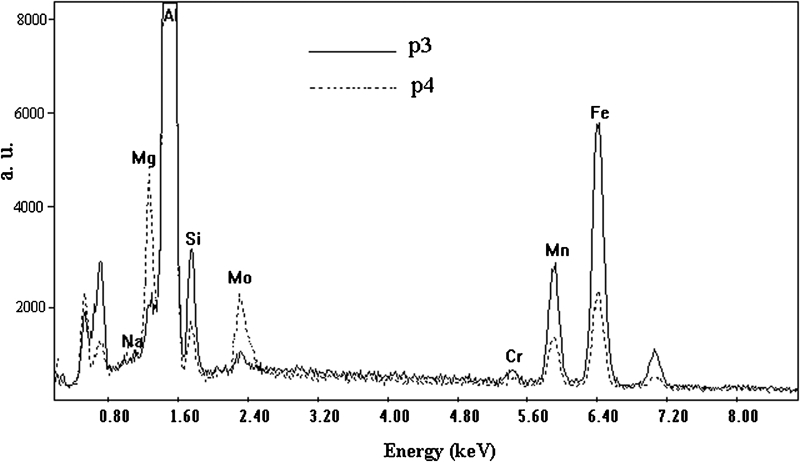
Energy dispersive spectroscopy analysis of Mo treated sample at 500 mV for 20 min above p3 (continuous line) and above p4 (dashed line)
Among the different anodic potentials used (100, 300, 500 and 700 mV), the test carried out at 500 mV resulted to allow the deposition of a higher amount of Mo over the surface.
The results of potentiodynamic tests are reported in Fig. 10. The sample treated at the potential of 500 mV resulted to show nobler E corr and lower i corr than the untreated sample. However, the results obtained by Ce3 treatments are better than those by Mo treatments (Table 3). The higher amount of Mo over the alloy surface obtained with the treatment at 500 mV increases the corrosion resistance of the layer. Different times of anodic polarisation have been tested for the potential of 500 mV, and the samples were submitted to anodic polarisation tests. The best results were obtained for a treatment time of 20 min (Table 3).
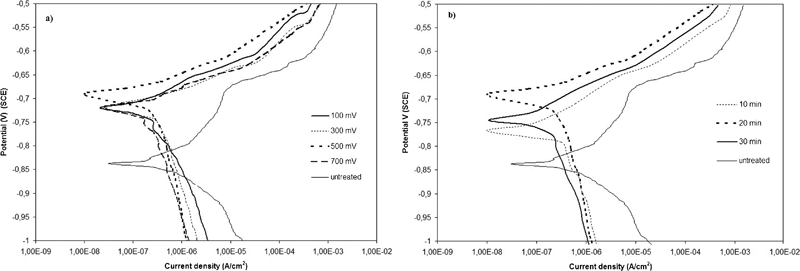
Potentiodynamic anodic polarisation curves of Mo treated samples a at different anodic potentials for 20 min and b at potential of 500 mV for different times
The values of potential and time of anodisation treatment resulted to be two fundamental parameters to ensure a protective layer with respect to corrosion. Regarding the effect of potential, it was found that treatment with lower potentials than 500 mV induced a lower dissolution of the substrate, while treatment with higher potentials than 500 mV produced a too high corrosion of the substrate: in both cases, the formation of the molybdate rich layer was inhibited. The effect of the time is analogous to the one of the potential, and it is important to find the best coupling of these values.
Ce3+ anodic polarisation in 1M Na2MoO4
The surface of the Ce3+Mo treated samples appeared with a dry mud morphology, and the anodisation potential seemed to influence the distribution and amount of molybdate above the surface but not its morphology (Fig. 11). As a matter of fact, in all the samples, the SEM-BSE images revealed the presence of lighter zones, and their amount increased with increasing potential. From EDS analysis, it resulted that these lighter areas are rich in Mo, and that the deposition of Mo occurred above all the surface, with a greater amount above agglomerates of cerium ( Figure 11 Figure 12 Figs. 11c and d, 12 and 13). Moreover, the EDS analysis carried out on the extended area pointed out that the anodisation treatment carried out at 500 mV allowed the precipitation of a higher amount of molybdenum in comparison with the treatment carried out at 300 mV (Fig. 14).
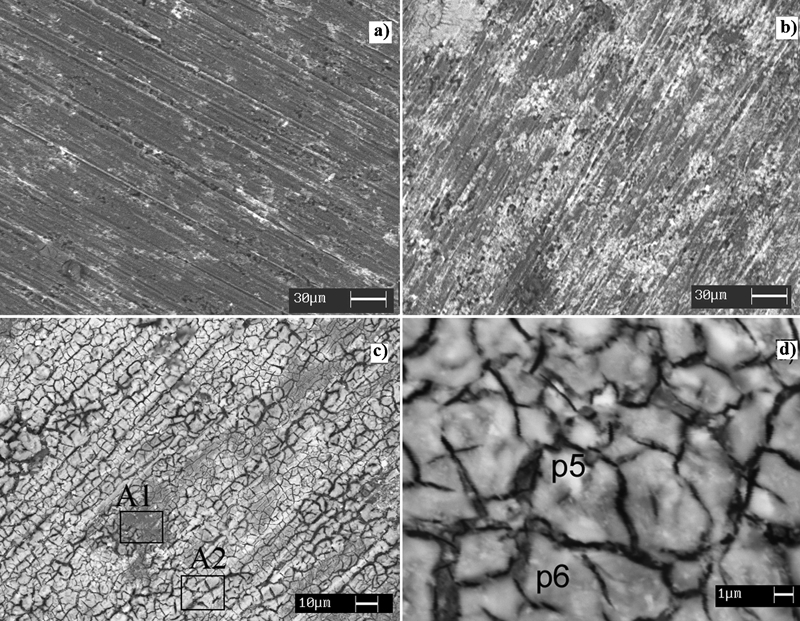
Images (SEM–BSE) of a Ce3+Mo 100 mV (20 min) sample, b Ce3+Mo 300 mV (20 min), c Ce3+Mo 500 mV (20 min) and d magnification of c
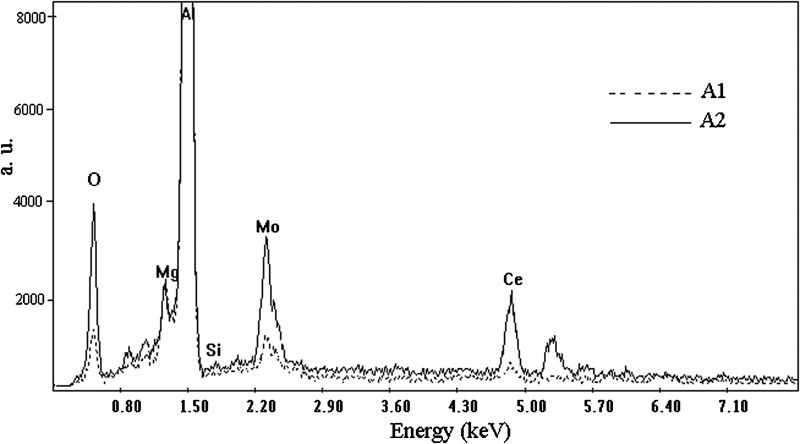
Energy dispersive spectroscopy analysis of Ce3+Mo 500 mV sample in correspondence of zones A1 (dashed line) and A2 (continuous line) of Fig. 10c
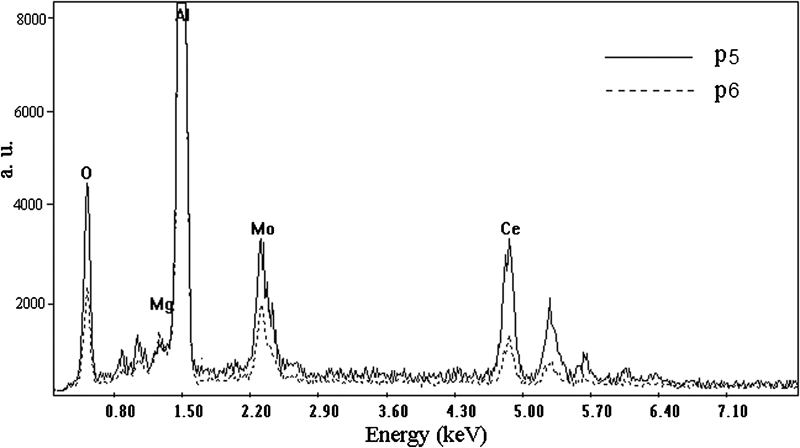
Energy dispersive spectroscopy analysis of Ce3+Mo 500 mV sample in correspondence of points p5 (continuous line) and p6 (dashed line) of Fig. 10d
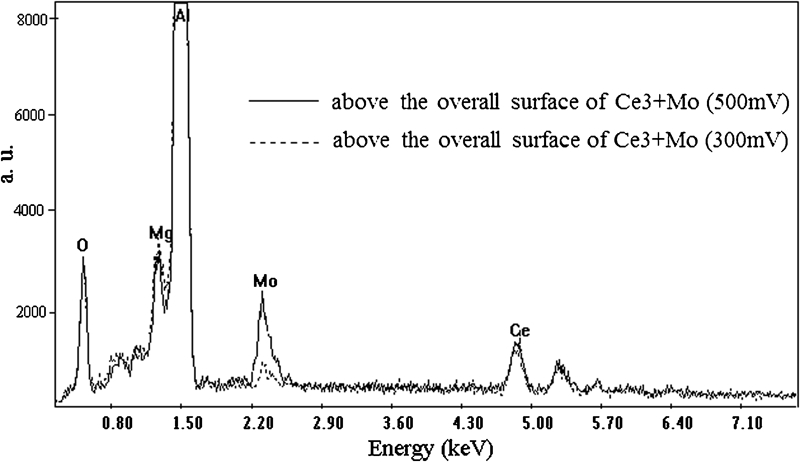
Energy dispersive spectroscopy analysis above overall surface of Ce3+Mo 300 mV sample (dashed line) and Ce3+Mo 500 mV (continuous line)
These results are in agreement with the mechanism via two paths of incorporation of Mo into the coating proposed by Hughes et al.21 The preferential precipitation of molybdenum above the Ce rich agglomerates confirmed that molybdate can react with them and indicated also that they may have a net positive charge. Moreover, the presence of Mo above all the surface indicated that, under anodic polarisation conditions, the MoO4− anions are attracted to the surface and incorporated in the coating.
The results of the anodic polarisation pointed out that the anodisation process in 1M Na2MoO4 solution induced an ennoblement of the corrosion potential. The greatest ennoblement was obtained with an anodisation treatment at 500 mV. Lower potentials are less effective in producing a uniform passive layer. Moreover, the anodisation treatments decreased both the anodic current and the cathodic branch of the polarisation curves. The polarisation curves show that the treatment at 500 mV produces the best surface corrosion resistance properties (Fig. 15).
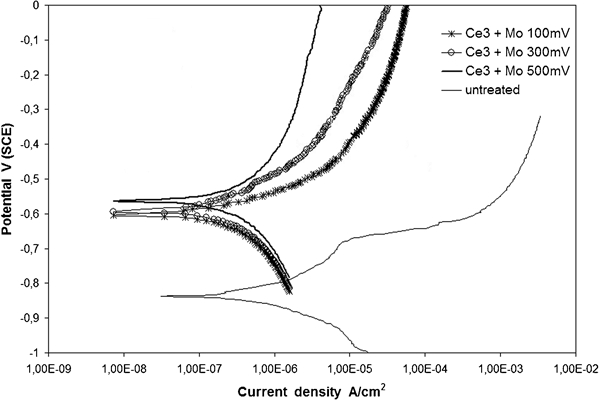
Polarisation curves of Ce3–Mo treated samples
The impedance spectra of Ce3, Ce3+500 mV and Ce3+300 mV samples were recorded, and the Nyquist diagrams, Bode diagrams for |Z| and Bode diagram for the phase are summarised in Fig. 16. As can be appreciated in the Nyquist diagrams, the arc of the Ce3+500 mV sample shows a larger diameter in comparison with that of the Ce3+300 mV and Ce3 samples, which means a higher degree of protection.
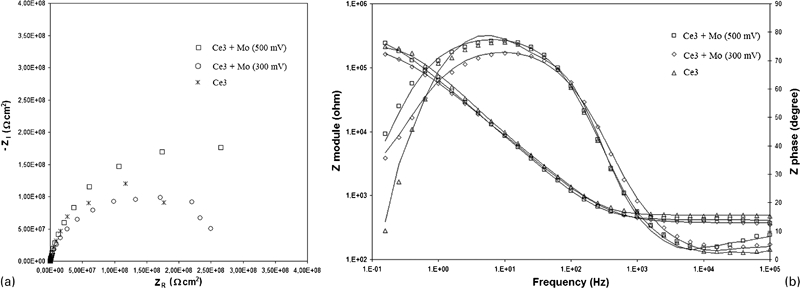
a Nyquist diagrams of Ce3–Mo samples and b Bode diagrams for |Z| and Bode diagram for phase of Ce3–Mo samples (continuous lines represent simulation data)
The equivalent circuit used to interpret the impedance data is shown in Fig. 6, and it has been previously described. A good agreement was shown between the experimental and simulated data (Table 4 and Fig. 16b). The data obtained from the fitting of EIS values confirm the further improvement of corrosion resistance of the surfaces obtained by anodisation in molybdate solution after Ce3 treatment (Table 4). In fact, the R 1 values of the Ce3 sample submitted to anodisation in molybdate salts are higher than those obtained for Ce3 sample. Moreover, the Q and C dl values of the molybdate treated samples are lower than those of the Ce3 treated ones. This indicates that the anodisation treatment further increases the protective layer and/or reduces the real corrosion area of the coated samples than the Ce3 treatment. This is in agreement with the results obtained from the analysis by SEM. The anodisation treatment produced a larger covered surface of molybdate compounds acting as inhibitors of corrosion. The best results were obtained with the anodisation treatment performed at 500 mV, which allowed the higher deposition of Mo in comparison with the treatment carried out at 300 mV.
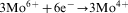
The improvement of the corrosion resistance can be attributed to the fact that the anodic polarisation of the Ce3 treated aluminium alloy in molybdate solution healed flaw sites in the hydrate film by anodic alumina formation, where the substrate anodises, generating acidic conditions and leading the dissolution of some Ce(OH)3 and precipitation of MoO3 gel-like material. Ce(OH)4 may also dissolve or be reduced due to the strong oxidising properties of Ce4+ ions in acid environment.22 If incorporated into the coating, Mo(VI) is potentially capable of undergoing a redox reduction with aluminium being reduced to Mo(IV)

Therefore, the Ce3 treatment followed by the anodic polarisation in sodium molybdate salts led to the formation of a coating that can protect from corrosion acting in three different ways:
the deposited cerium compounds reduced the cathodic activity
the anodic polarisation treatment induced the formation of an oxide film that limits the exposure of aluminium to the corrosive environment
incorporated Mo(VI) ions provide a potential self-healing ability when the film is damaged.
Conclusions
A process for the surface modification of AA 5083-T6 has been investigated. The process consisted of chemical passivation with two different cerium salts followed by a further step involving anodisation in Na2MoO4 solution.
The effects of the immersion of aluminium alloy in different cerium salts were analysed. By immersing the samples in a Ce(NO3)3 solution (Ce1 treatment), a thin film was formed on the surface of the alloy, while the immersion in CeCl3 (Ce2 treatment) led to a higher precipitation of cerium with the formation of a thicker layer and more effective in preventing corrosion than that obtained by immersion in Ce(NO3)3 solution. By combining the two treatments (Ce3 treatment), a more uniform and thicker layer with a larger amount of deposits on the cathodic areas was obtained. In this way, the corrosion resistance is further improved, and the anodic reaction rate decreases.
The anodic polarisation in molybdate solution of the AA 5083 sample confirmed the role of molybdate as anodic inhibitor.
The combination of Ce3 treatment followed by Mo anodic treatment (anodic polarisation at 500 mV) caused a further improvement in corrosion resistance, inducing both an ennoblement of the corrosion potential and a reduction in the corrosion and anodic current. The EIS measurements pointed out that the Ce3+500 mV sample exhibits a resistance of polarisation value one order of magnitude higher than the Ce3 sample.