
Abstract
Online NobleChem is a technology to mitigate stress corrosion cracking in reactor internals and recirculation pipes of boiling water reactors (BWRs). For a more efficient reduction of the electrochemical corrosion potential (ECP) under hydrogen water chemistry conditions, noble metals (e.g. Pt) are injected into the feed water during power operation. They are claimed to deposit as very fine metallic particles on all water wetted surfaces and to stay electrocatalytic over long periods. To study the deposition and (re)distribution behaviour of Pt, a sophisticated high temperature water loop has been constructed, in which specimens can be exposed to simulated BWR water and Pt can be deposited in situ. The specimens are analysed by laser ablation–inductively coupled plasma–mass spectrometry and electron microscopy after the experiments. Results from two experiments with different Pt injection rates but similar total Pt amounts revealed a faster and more pronounced reduction of the ECP and slightly larger average Pt particle size using the higher Pt injection rate. A longer preoxidation of the specimens seems to increase the average Pt concentration on the specimen surface.
Keywords
Introduction
Boiling water reactors (BWRs) are operated with neutral high purity water. Because of the radiolysis of the reactor coolant in the core and the limited volatility of H2O2, water contains a stoichiometric excess of O2 and H2O2 over H2. Therefore, under normal water chemistry conditions, the reactor water is highly oxidising; this is reflected by the high electrochemical corrosion potentials (ECPs) of the structural materials from +100 to +250 mV(SHE). This oxidising environment has caused numerous corrosion problems in BWR plants. Intergranular stress corrosion cracking (SCC) in stainless steel and nickel based alloy components of the primary circuit led to significant capacity losses in BWR plants worldwide during the last three decades and in some cases even challenged the integrity of the primary coolant circuit.1,2 From early laboratory studies, it was clear that the SCC susceptibility and growth rates can be relevantly reduced by lowering the ECP of these steels, e.g. by the injection of H2 into feed water (hydrogen water chemistry, HWC), which recombines with O2 and H2O2 to H2O.3–5 This method was first introduced in the early 1980s.6,7
To overcome several disadvantages of the classical HWC (e.g. high H2 contents in feed water and increase of the operating main streamline and shutdown dry well dose rates), the Online NobleChem (OLNC) technology has been developed by General Electric (nowadays GE–Hitachi). 8 In this method, very dilute noble metal compounds [as Na2Pt(OH)6] are injected into the feed water where they quickly decompose. 9 Very fine noble metal particles are formed and able to deposit on the water wetted surfaces of the different structural materials. 9 The noble metals very efficiently electrocatalyse the recombination of H2 with O2 and H2O2 by providing surface sites on which H2 and O2 can dissociatively adsorb and readily undergo electron exchange reactions.4,5,9,10 Because the consumption rate of O2 (and H2O2) by the Pt particles on the steel surface is much faster than the diffusion of O2 through the stagnant boundary layer,4,5,9,10 the surface oxidant concentration is reduced to virtually zero if a near stoichiometric concentration of H2 is available (H2/O2 molar ratio of 2). 11 With OLNC, all BWR locations with stoichiometric excess of H2 and a sufficient Pt coverage of the surface are able to decrease ECPs to <−450 mV(SHE) with a low feed water H2 content, thus with minimal negative impact on BWR plant operation.
To achieve new phenomenological insights and a better basic understanding of the Pt distribution and deposition behaviour in BWRs, a research project (‘Noble metal deposition behaviour in BWRs’, NORA, see Ref. 12) has been started at the Paul Scherrer Institut (PSI) as a joint programme together with the Swiss Federal Nuclear Safety Inspectorate (ENSI) and the Swiss nuclear power plants Leibstadt (KKL) and Mühleberg (KKM). The current paper briefly presents selected results from the first lab experiments investigating the effect of the Pt injection rate on the ECP and Pt deposition on stainless steel specimens.
Experimental
Material and specimens
For the investigation of the Pt deposition behaviour, a type 304L stainless steel (UNS S30403) from an original pipe from a nuclear power plant was chosen. 12 Coupons (13×10×4 mm) with a defined surface roughness (R a≈0·3 μm) were used for the experiments. Some of the specimens were preoxidised for ∼310 h in HWC environment before the tests, and some were used in the ‘as received’ state.
Experimental set-up and procedure
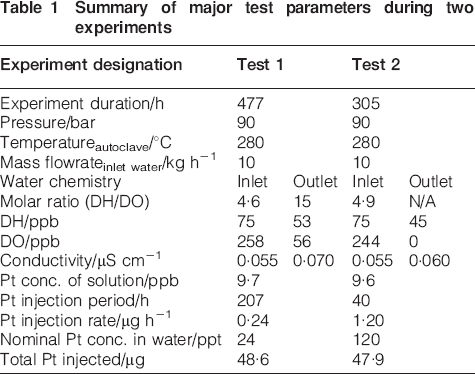
The Pt deposition tests were performed in a sophisticated high temperature water loop with a 1 L stainless steel autoclave (Fig. 1). During the experiments, all environmental parameters at inlet and outlet [dissolved oxygen (DO), dissolved hydrogen (DH), conductivity, temperature, pressure, flowrate, etc.] were recorded continuously. Four coupon specimens (two preoxidised and two in as received state) were exposed to high temperature water in the autoclave, whereas one of them (as received state) was electrically connected to a stainless steel wire for ECP measurement. The ECP of this specimen, the autoclave and the redox potential (Pt sheet) were measured versus an external Cu/Cu2O/ZrO2 membrane reference electrode. The BWR conditions were simulated with high purity water at a temperature of 280°C and a pressure of 90 bar. For HWC conditions, a mixture of H2 and O2 was adjusted (stoichiometric excess of H2). After 1 week of preconditioning (at ‘t = 0’), a 1% Na2Pt(OH)6 aqueous solution from Johnson & Matthey (provided by KKM), diluted down to 10 ppb, was injected through ion chromatography polytetrafluoroethylene tubing into the inlet water stream by an Eldex high pressure dosing pump. Following several pretests, two comparable tests were performed by injecting the same total amount of Pt at two different Pt injection rates. Compared to plant OLNC applications, injection rates as well as the total amount of Pt injected were much lower in these tests. Three days after Pt injection was finished, the experiments were shut down. The major test parameters are shown in Table 1. To avoid possible contamination of the specimens with Pt particles from previous tests, the loop was operated ( = cleaned) without specimens for a few days in between the tests.
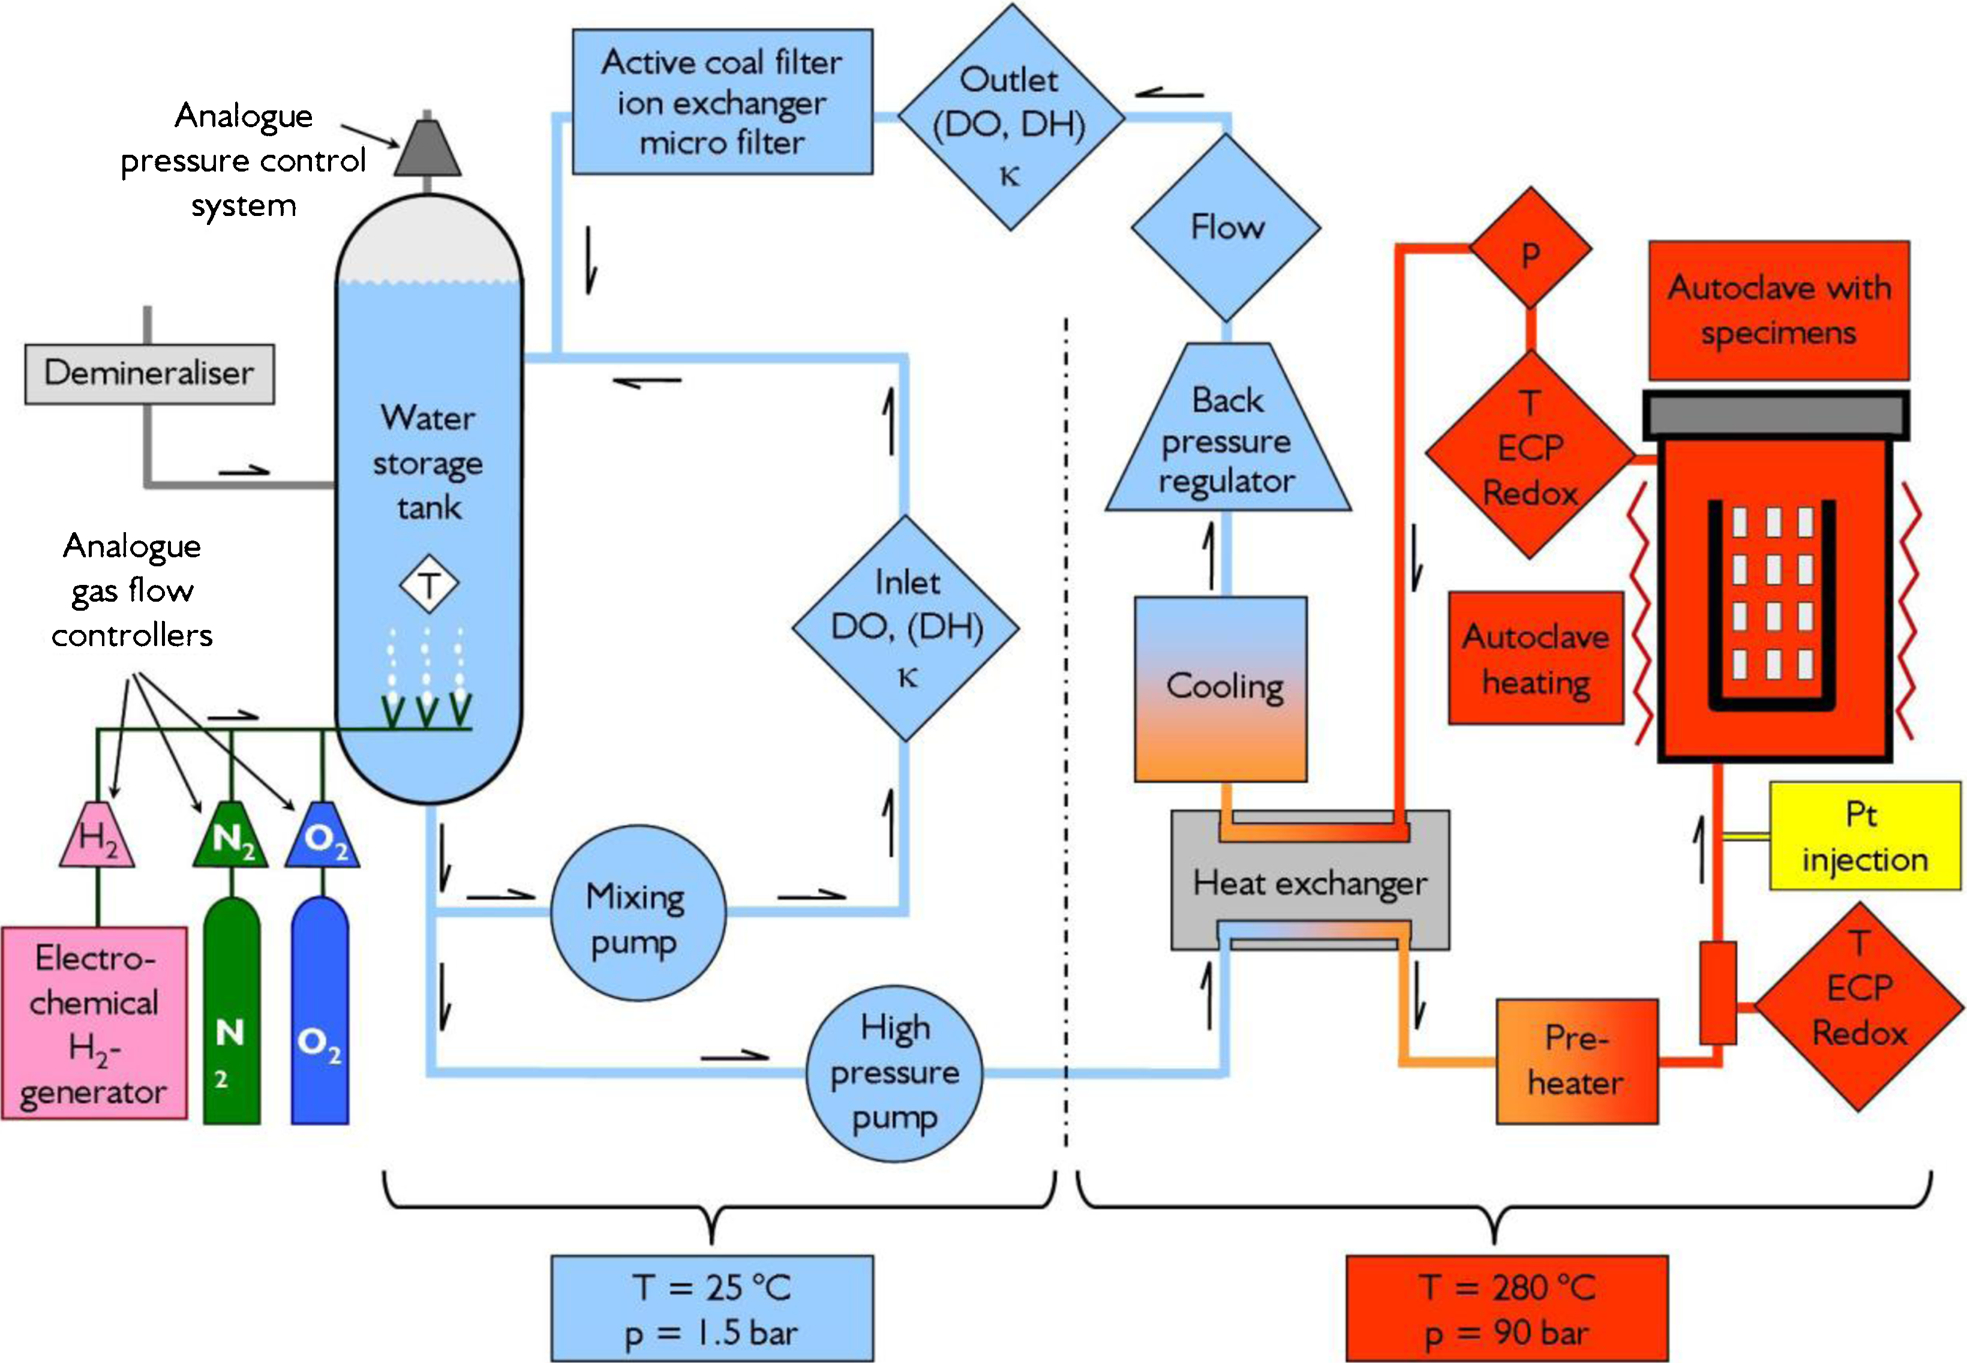
Schematic of high temperature water loop facility for Pt deposition experiments
Summary of major test parameters during two experiments
Analytical techniques
Microstructural investigations were performed using a Zeiss SEM equipped with a field emission gun and X-ray energy dispersive spectrometer (EDS) from Oxford Instruments for chemical analyses. A secondary electron detector was used to investigate the oxide layer topography, whereas a back scattered electron detector was used to identify Z (chemical) contrast across the oxide layers.
Transmission electron microscopy (TEM) observations were performed with 3 mm diameter disks, which were punched from the specimens. One side of the specimen (without any oxide film) was mechanically polished down to ∼100 μm thickness. Final thinning to electron transparency was performed by electro back polishing technique at −2°C and 21 V using a solution of 10 vol.-% perchloric acid in ethanol. These specimens were investigated in a JEOL 2010 TEM, which has a LaB6 gun and a high tilt lens and was operated at 200 kV. An EDS equipped with an Oxford Instruments Si(Li) detector was used to identify the chemical composition of the observed oxide crystals and Pt particles.
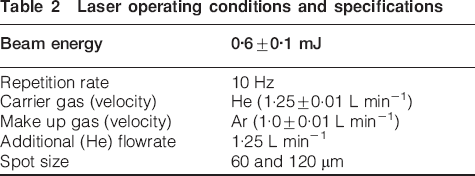
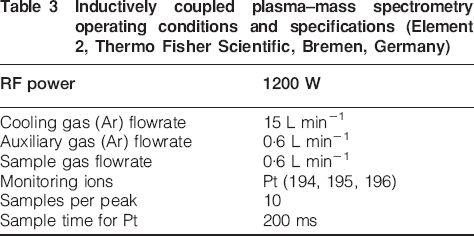
The Pt concentration on the surface of all specimens was measured by laser ablation–inductively coupled plasma–mass spectrometry (LA–ICP–MS). The front and back sides of the specimens were ablated using an ultraviolet LA system, coupled to a sector field ICP–MS instrument (Element 2, Thermo Fisher Scientific, Bremen, Germany). The laser system is a quadrupled Nd∶YAG laser delivering a beam of 266 nm wavelength. 13 Analyses of Pt on the specimens were carried out using a point analysis mode. The laser system operating conditions are shown in Table 2. The specifications and operating conditions of the ICP–MS are described in Table 3. The Pt standards used for the calculation of the Pt concentration on the surface of the specimens are homogenous thin films of Pt with layer thicknesses of 0·14 and 1·4 nm on steel substrate. The layer thickness corresponds to Pt concentrations of 0·3 and 3 μg cm−2 respectively.
Laser operating conditions and specifications
Inductively coupled plasma–mass spectrometry operating conditions and specifications (Element 2, Thermo Fisher Scientific, Bremen, Germany)
Results and discussion
Pt concentration on specimen surface
Table 4 lists the Pt concentrations measured on the specimens from tests 1 and 2. A very low but clearly measurable amount of Pt has been detected on the surface of all specimens using LA–ICP–MS. The Pt concentration was found to be homogenous over the 120 measurement points across the front and back sides of each specimen. However, the uncertainty level marked in the table amounts up to 50%, mainly caused by the calibration curve established at higher concentrations. In spite of the high level of uncertainty, a tendency in Pt concentration between tests 1 and 2 and also between the non-preoxidised and preoxidised specimens can be seen. The specimens of test 1 have slightly less Pt deposited on the surfaces than the ones from test 2. This could be due to the higher Pt injection rate in test 2 resulting in a higher Pt concentration in high temperature water (Table 1). This result is also confirmed by the more pronounced reduction of the ECP during Pt injection in test 2 (see the section on ‘Effect of Pt injection rate on ECP’). In case of both tests, the non-preoxidised specimens revealed lower Pt concentrations than the preoxidised ones.
Pt concentration on surface of specimens from tests 1 and 2 determined by LA–ICP–MS
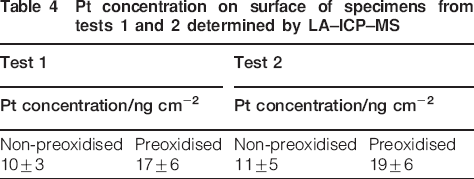
One could argue that the slightly higher Pt concentrations on the specimens of test 2 are due to a decreased ‘sink effect’ of the autoclave surface for Pt. However, the clear decrease of autoclave potentials upon Pt injection in both runs (Fig. 2) shows clearly that Pt is still being deposited on the autoclave surface also in test 2. Therefore, its ability to adsorb Pt has not been affected significantly by the first test. Another way to look at it is to consider the amount of Pt deposited on the autoclave surfaces during an individual run. This amount is significantly smaller (∼10 ng cm−2) than the maximal possible loading (e.g. a monatomic layer corresponds to ∼300 ng cm−2) one could assume. This is unlikely to affect the ratio between the Pt that deposits on the specimens versus the amount that goes to the autoclave. Therefore, it is believed that the sink effect of the autoclave should be the same for both tests and has no major impact on the results.
a test 1; b test 2
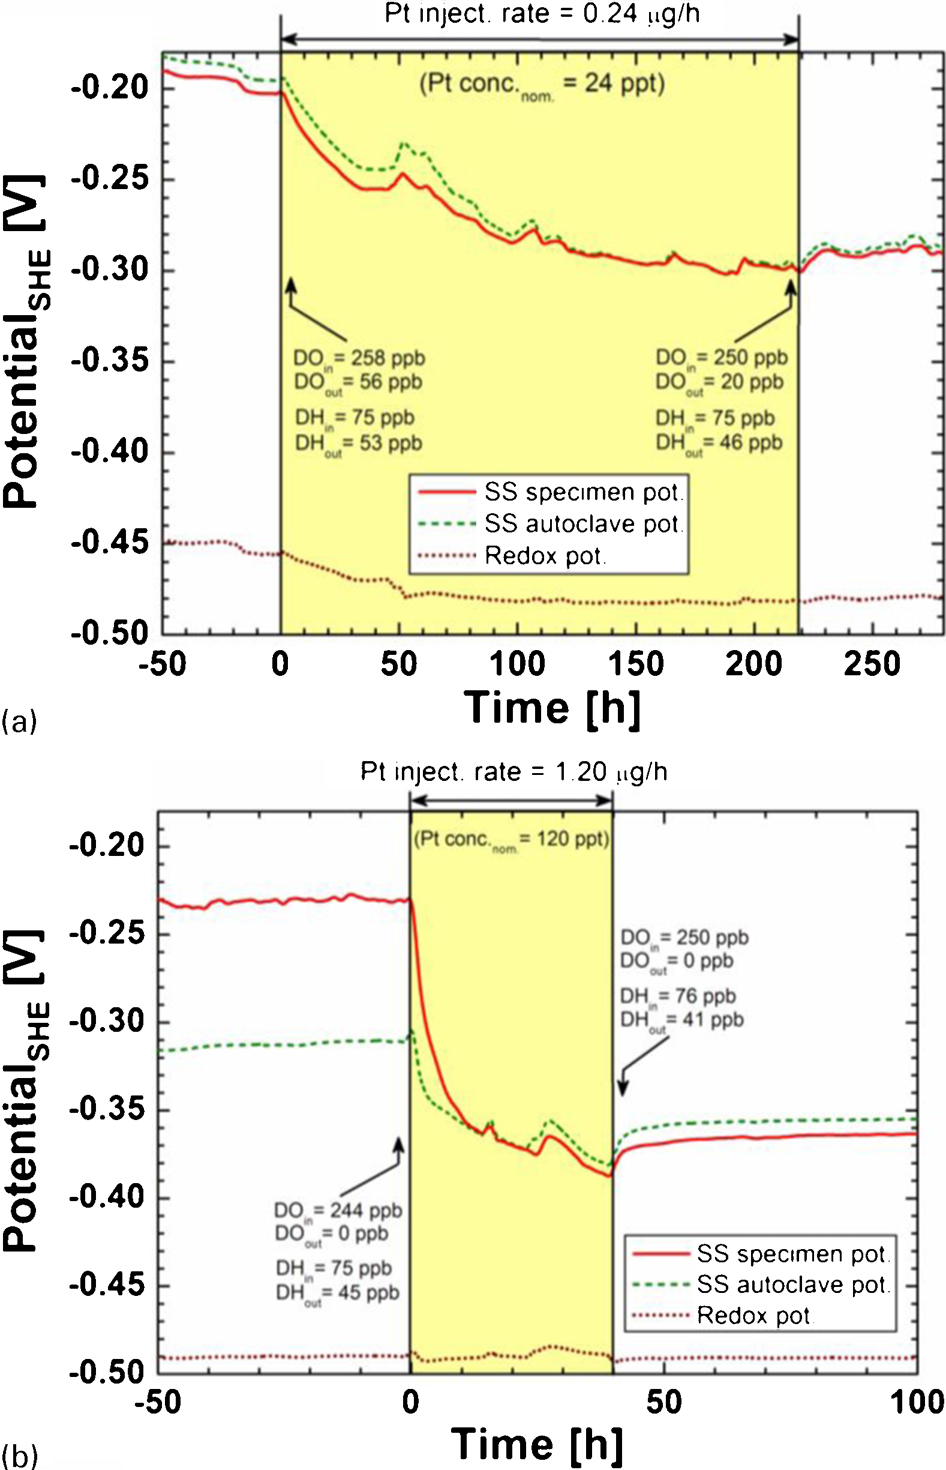
Effect of Pt injection rate on ECP
Figure 2 shows the course of the specimen, autoclave and redox potentials during tests 1 and 2. The small fluctuations of the potential curves are due to short interruptions of the Pt injection (e.g. change of the Pt injection solution storage bottle) and to water sampling. Just before Pt injection, the specimen potentials in both tests were in a comparable range at ˜−200 and −230 mV(SHE) respectively. The slightly lower ECP in test 2 can be correlated to the lower DO content in the outlet water. This is explained by the fact that with each experiment, more Pt accumulates on the inner surface of the piping and autoclave walls, which get more catalytic, and therefore, more O2 is consumed. This can also be seen by the slightly lower redox potentials at the end of test 1 and during test 2. Shortly after Pt injection started, the ECP decreased continuously in both experiments, although with different rates and to a different extent. With the lower Pt injection rate (0·24 μg h−1), the ECP of the specimen decreased over 220 h by 100 mV, and with the higher injection rate (1·20 μg h−1), the ECP decreased by 160 mV in only 40 h, even though the total amount of Pt injected was the same in both cases. After Pt injection was stopped, the ECP slightly increased and stabilised at −290 mV(SHE) in test 1 and at −360 mV(SHE) in test 2. Considering the decrease of the DO content during test 1, this difference is even more pronounced. The slightly lower Pt concentrations measured on the specimens of test 1 (see the section on ‘Pt concentration on specimen surface’) fit well to these observations.
On a first view, it seems that very low Pt injection rates (corresponding to low Pt concentrations in the high temperature water) are less effective in depositing Pt on the surface of stainless steel in BWR environment or at least it takes longer to get a sufficient coverage of Pt on the specimen surface. The reason for this behaviour is not clear so far. Further insights might be obtained by microscopic analysis of the Pt particle size and distribution. The results of these microscopic investigations are described and discussed in the following section.
Microstructure
Scanning electron microscope investigations
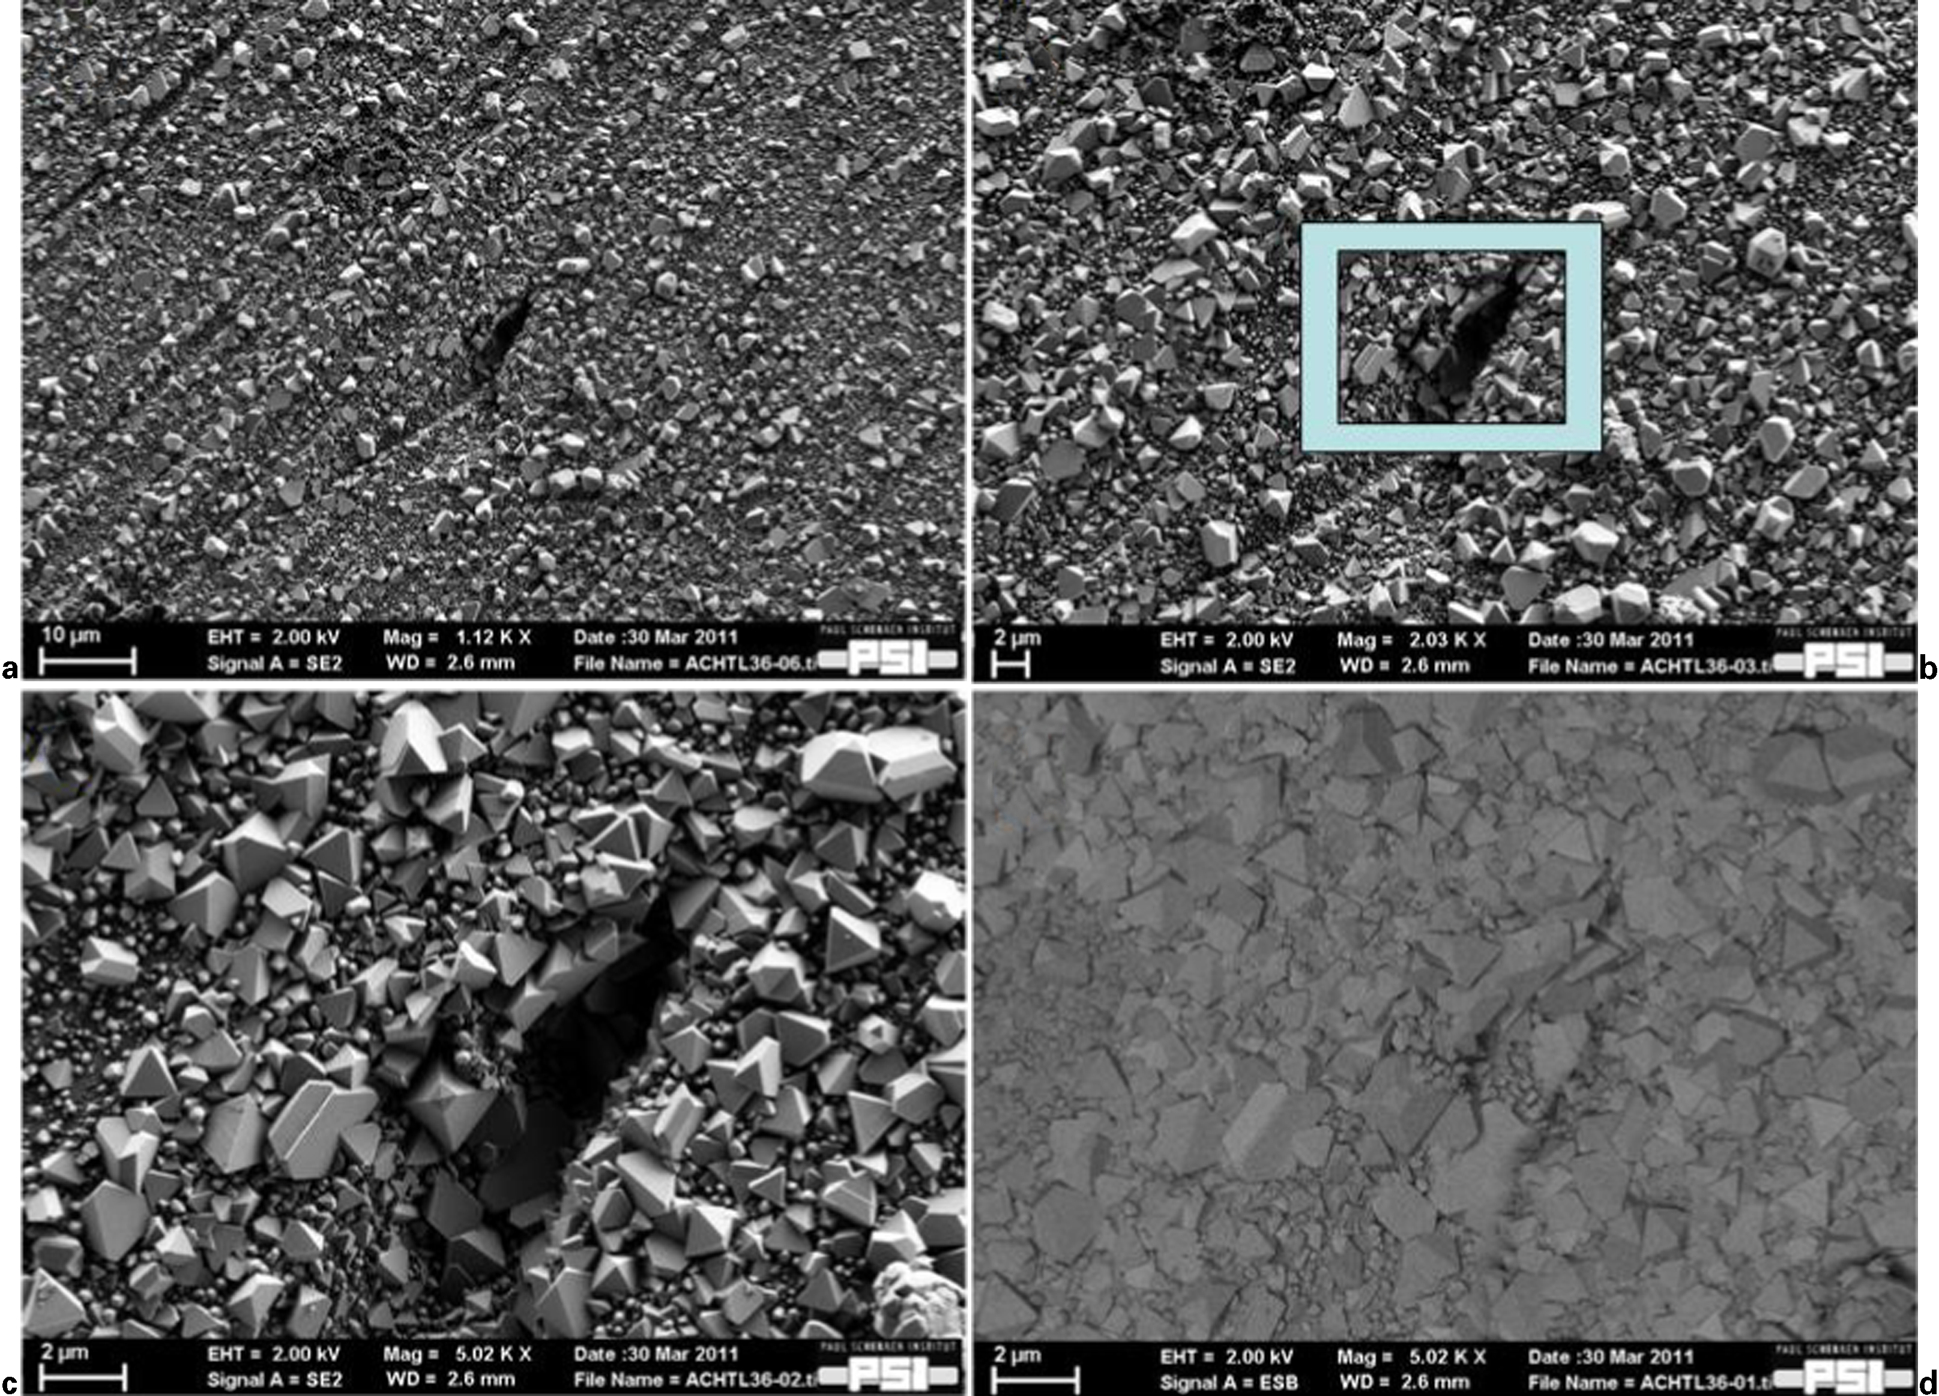
Figures 3 and 4 show the SEM images respectively of non-preoxidised and preoxidised specimens from test 1. Figures 3a and 4a present the overall structure of the oxide layers at lower magnification. Figures 3b and 4b show a higher magnification of this oxide structure. The oxide crystal size distribution is 70 nm to 2 μm (Fig. 3c) in non-preoxidised and 70 nm to 5 μm in preoxidised specimens (Fig. 4c). In non-preoxidised specimens, Fig. 3d shows the Z contrast imaging with no specific contrast between the smaller particles and the larger ones. The EDS analysis performed on these particles shows that they are Fe oxide. In both non-preoxidised and preoxidised specimens, all the faceted crystals are Fe oxide with low or no Cr content, whereas all the rounded crystals are Fe oxide with higher Cr content. The smaller crystals exhibit a rounded structure, whereas all larger crystals have nice faceted morphologies in all specimens. Unlike in the non-preoxidised specimen, there are some finer crystal-like flakes (marked with arrows) with sizes ranging from 50 to 100 nm that are attached to the larger faceted oxide crystals, as shown in Fig. 4b and c. Initially, it was believed that these were Pt particles, but there is no specific contrast between the smaller and the larger particles when imaged using the back scattered electron detector (Fig. 4d). The EDS analysis performed on these flaky particles showed that they are Fe oxides too. No Pt crystals or particles could be identified in the oxide layers in both non-preoxidised and preoxidised specimens from test 1.
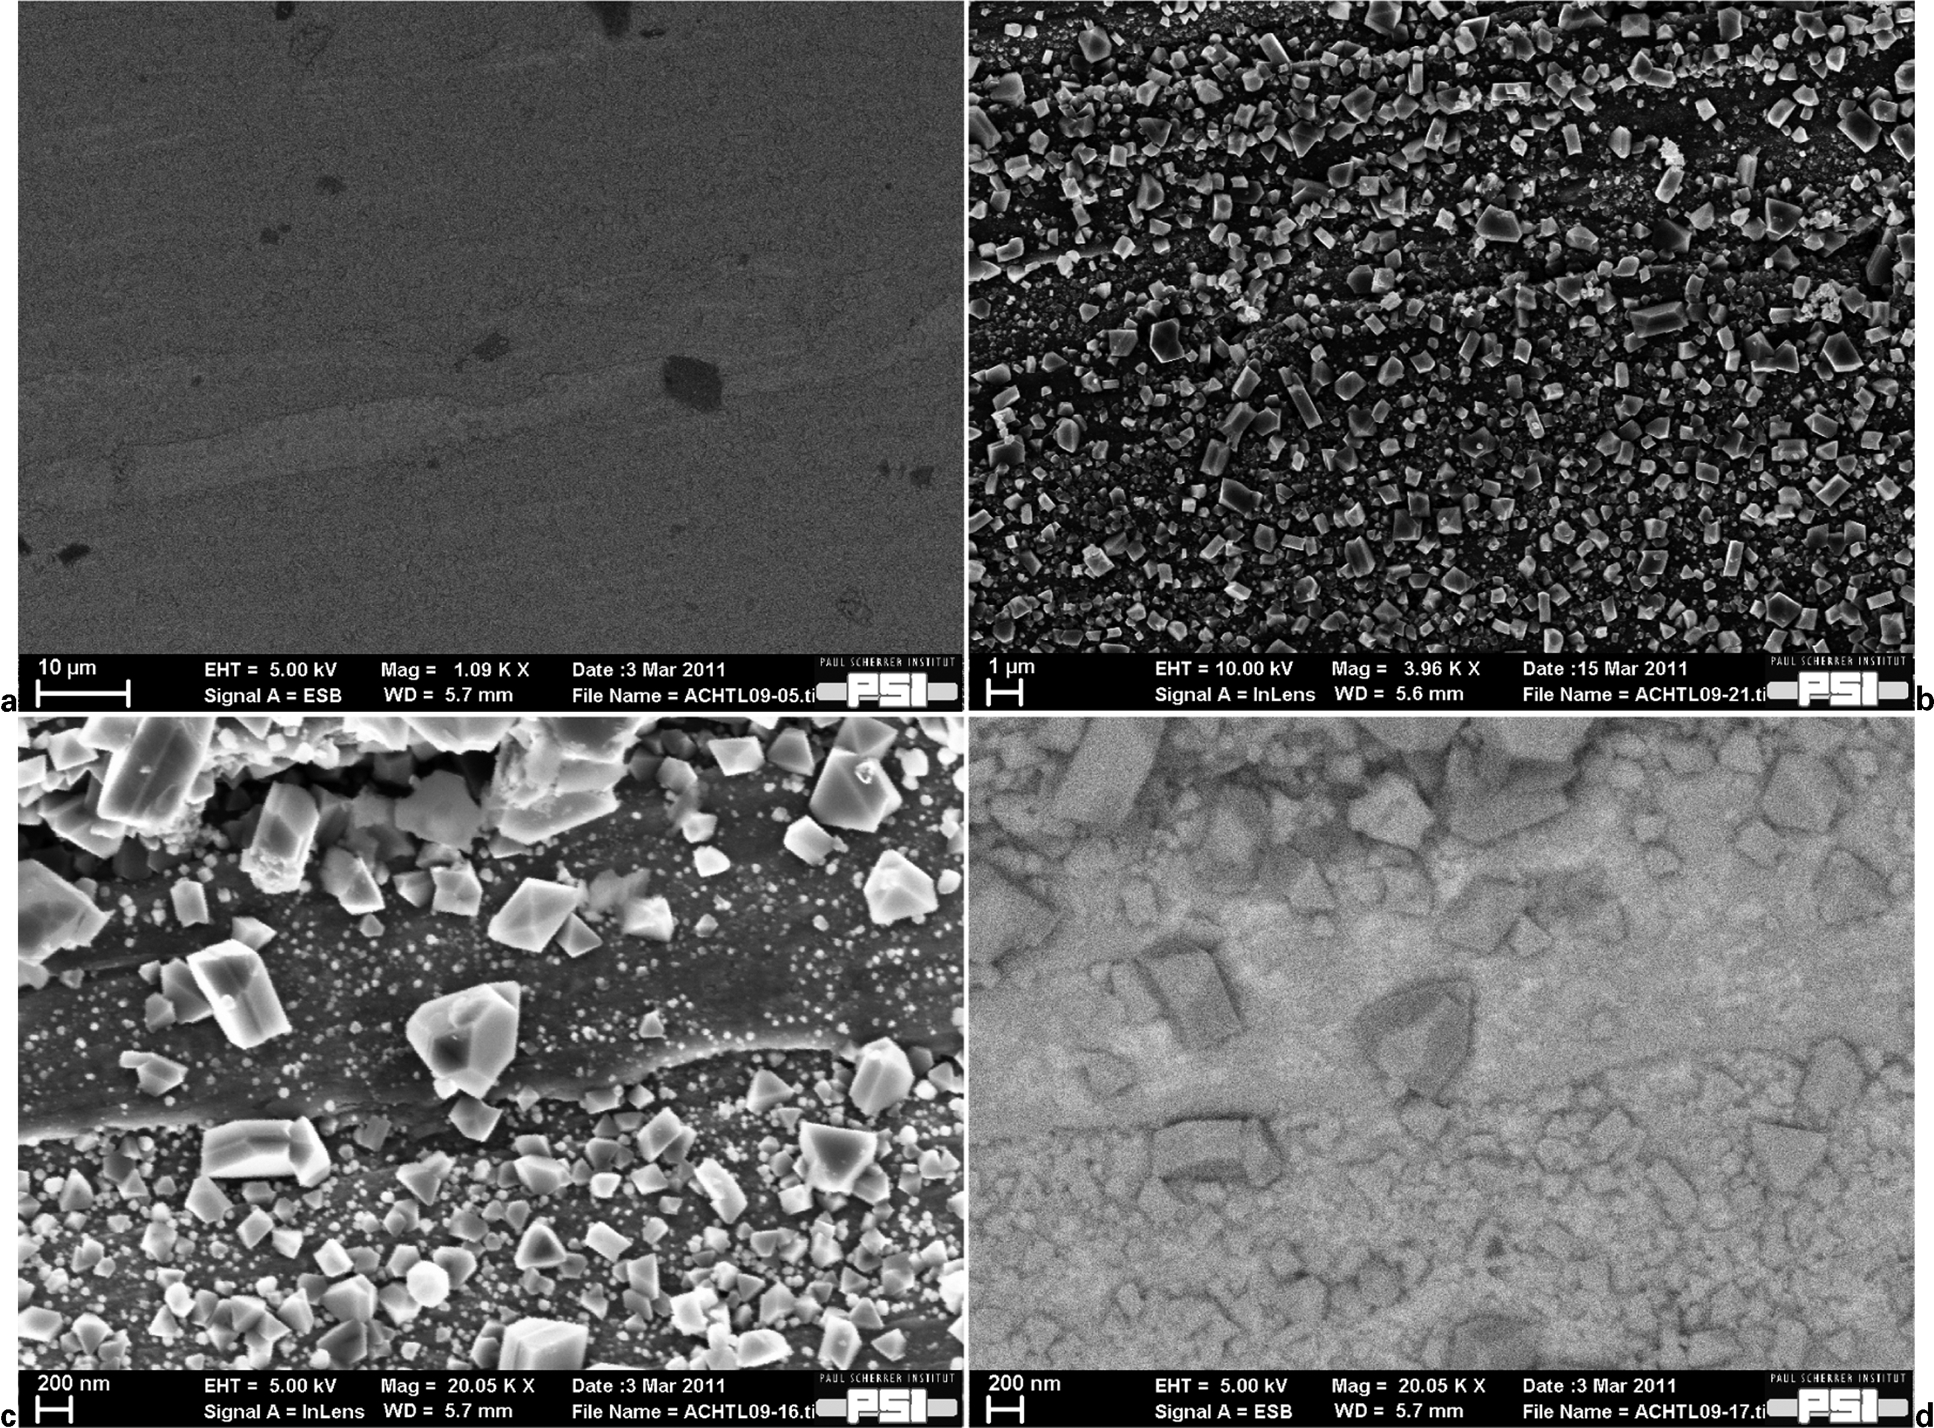
a, b, c secondary and d back scattered electron images of non-preoxidised specimen from test 1
a, b, c secondary and d back scattered electron images of preoxidised specimen from test 1
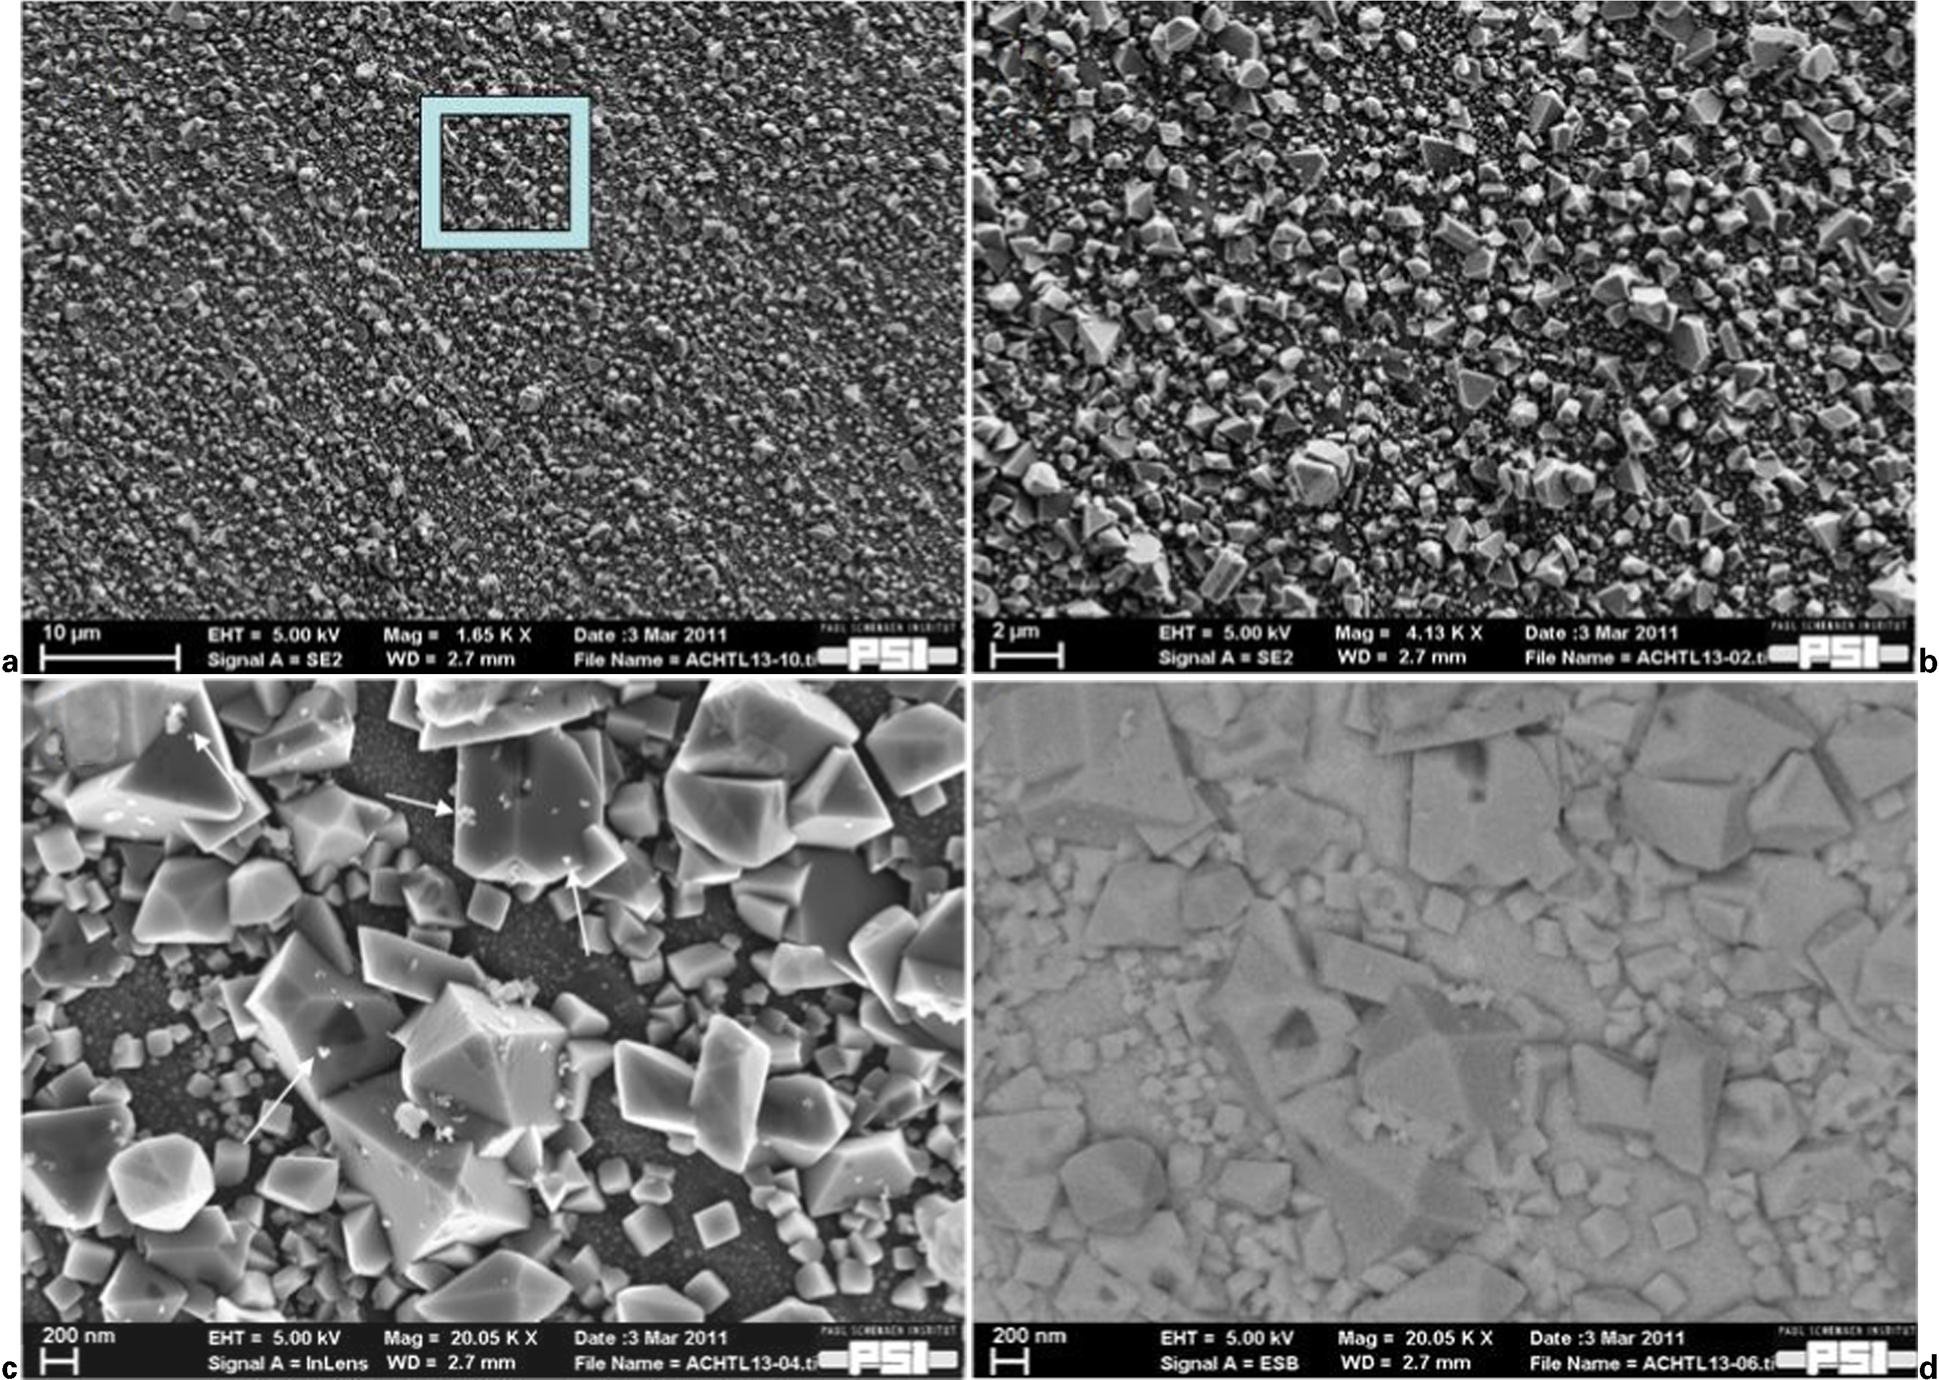
Figures 5 and 6 present the SEM images of non-preoxidised and preoxidised specimens from test 2. Figures 5a and 6a present the overall structure of the oxide layers at lower magnification. Figures 5b and 6b show a higher magnification of this oxide structure. The size distribution of the oxide crystals is 70 nm to 10 μm (Fig. 5c) in the non-preoxidised specimen and 70 nm to 5 μm (Fig. 6c) in the preoxidised specimen. The particle size distribution is found to be bimodal in both specimens. In the non-preoxidised specimen, the Z contrast image (Fig. 5d) shows no specific contrast between the smaller particles and the larger ones, which reveals that they all are Fe oxide or Fe–Cr oxide in nature. As in test 1, all the faceted crystals are of Fe oxide with low or no Cr content, whereas all the rounded crystals have a higher Cr content. No Pt crystals or particles are found in the oxide layers in non-preoxidised specimens. In the case of preoxidised specimens, there is a homogenous distribution of smaller rounded crystals that cover the whole surface of the steel and are found to be a Fe–Cr oxide. Similar to the preoxidised specimen from test 1, some smaller crystal-like flakes with a size of ∼50 to 100 nm are present, although with a much lower density compared to test 1. They are mainly attached to the larger faceted oxide crystals. Not all, but few of the finer flakes (marked with arrows) show a clear chemical contrast in the back scattered electron images (Fig. 6d), indicating a different element. The EDS analysis performed on these particles showed that they are pure Pt particles.
a, b, c secondary and d back scattered electron images of non-preoxidised specimen from test 2
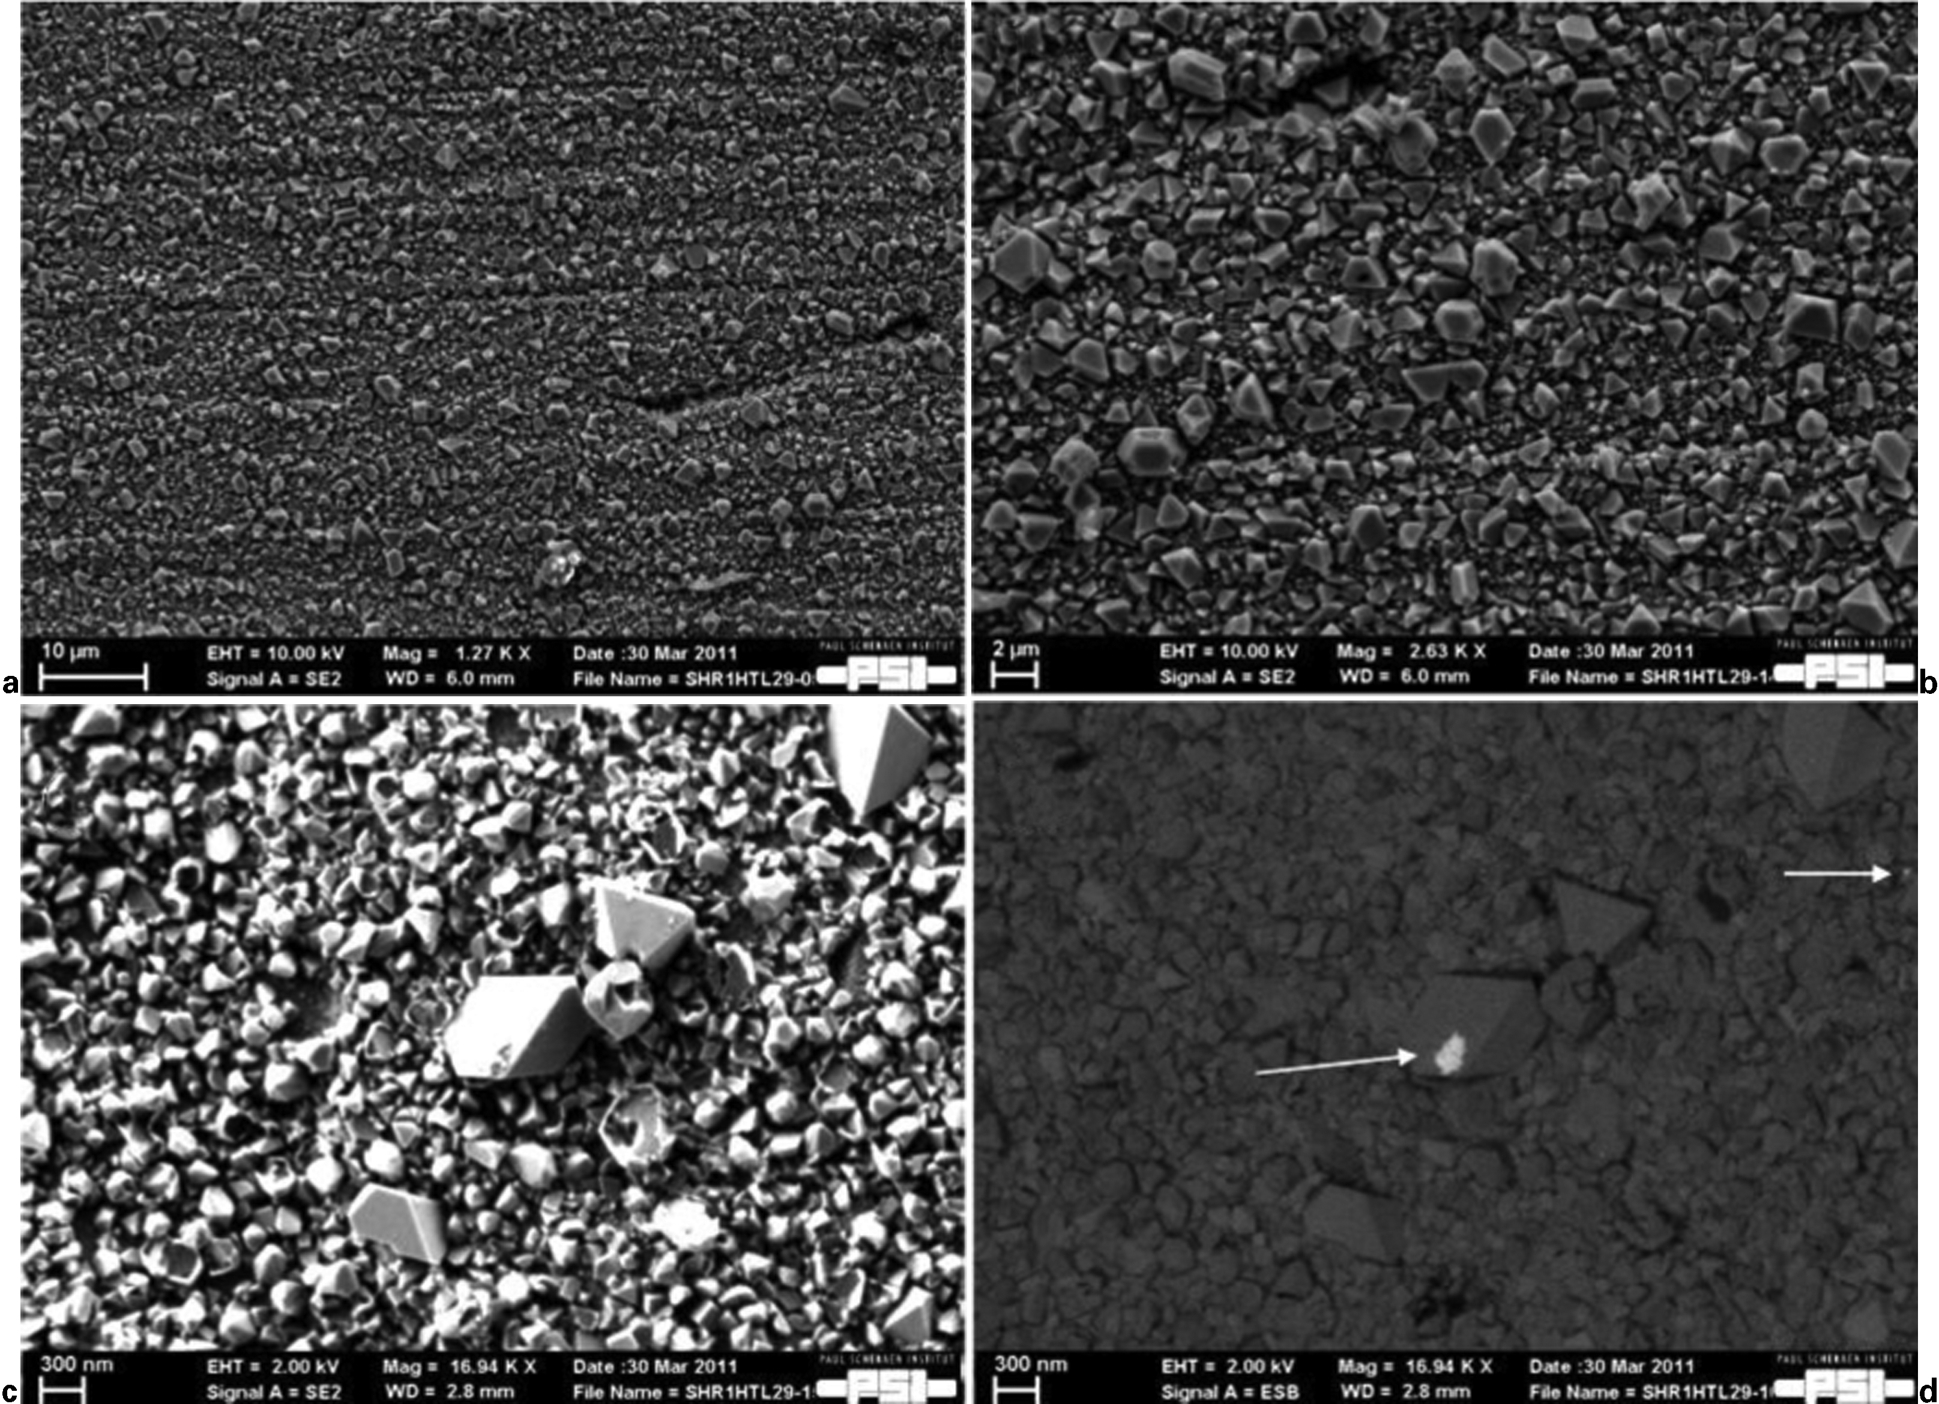
a, b, c secondary and d back scattered electron images of preoxidised specimen from test 2 (arrows indicating Pt particles)
By comparing the oxide crystal morphology of non-preoxidised specimens from tests 1 to 2, the former one has a higher density of larger faceted crystals, whereas the latter one has a higher density of finer particles with sizes ranging from 100 to 200 nm. This could be due to the longer time interval the specimens of test 1 were exposed to the high temperature water (additional 172 h). Comparing the non-preoxidised and preoxidised specimens from both tests, the latter ones have a higher density of larger faceted Fe oxide crystals. All preoxidised specimens have very fine particles attached to the larger faceted particles; however, not all particles are of the same elemental composition. Only in case of test 2 are few of them found to be Pt particles. In both tests, all the large faceted crystals are of Fe oxide with low or no Cr content, whereas all the rounded crystals are Fe oxide with higher Cr content.
Transmission electron microscopy investigations
As quantitative Pt analysis by LA–ICP–MS clearly revealed that Pt is present on all specimens (see the section on ‘Pt concentration on specimen surface’), a more detailed microscopic analysis with higher resolution was needed to clarify where and in which shape the Pt is located on the coupons. Therefore, TEM investigations were performed.
In Figs. 7 and 8, TEM bright field images taken from preoxidised and non-preoxidised specimens from tests 1 and 2 can be seen. The image reveals the micrometre sized inner oxide crystals and part of the outer oxide crystals. The insert in Fig. 8 shows the diffraction pattern that reveals the hematite type crystalline structure along the {112} zone axis of the oxide crystals. The secondary diffraction (extra) spots in Fig. 8 (insert) appear to be due to the interface between the inner and outer oxide layers. Figures 7c and d and 8c and d show small nanosized particles (marked with arrows) with size ranging from 1 to 5 nm. Energy dispersive spectrometer analysis of these nanosized particles showed that they are Pt in nature. The observed Pt particles are found hidden under large oxide crystals, as shown in Fig. 7c, whereas others are found ∼5-10 nm deep in the inner oxide layer. Inner oxide Pt particles are studied using the defocus technique in TEM, where the particles light up for a certain value of defocus and disappear with the increase or decrease of focal distance. To estimate the depth at which the particles are embedded, the specimen roughness was also taken into consideration. The roughness was estimated to be ∼20-30 nm.
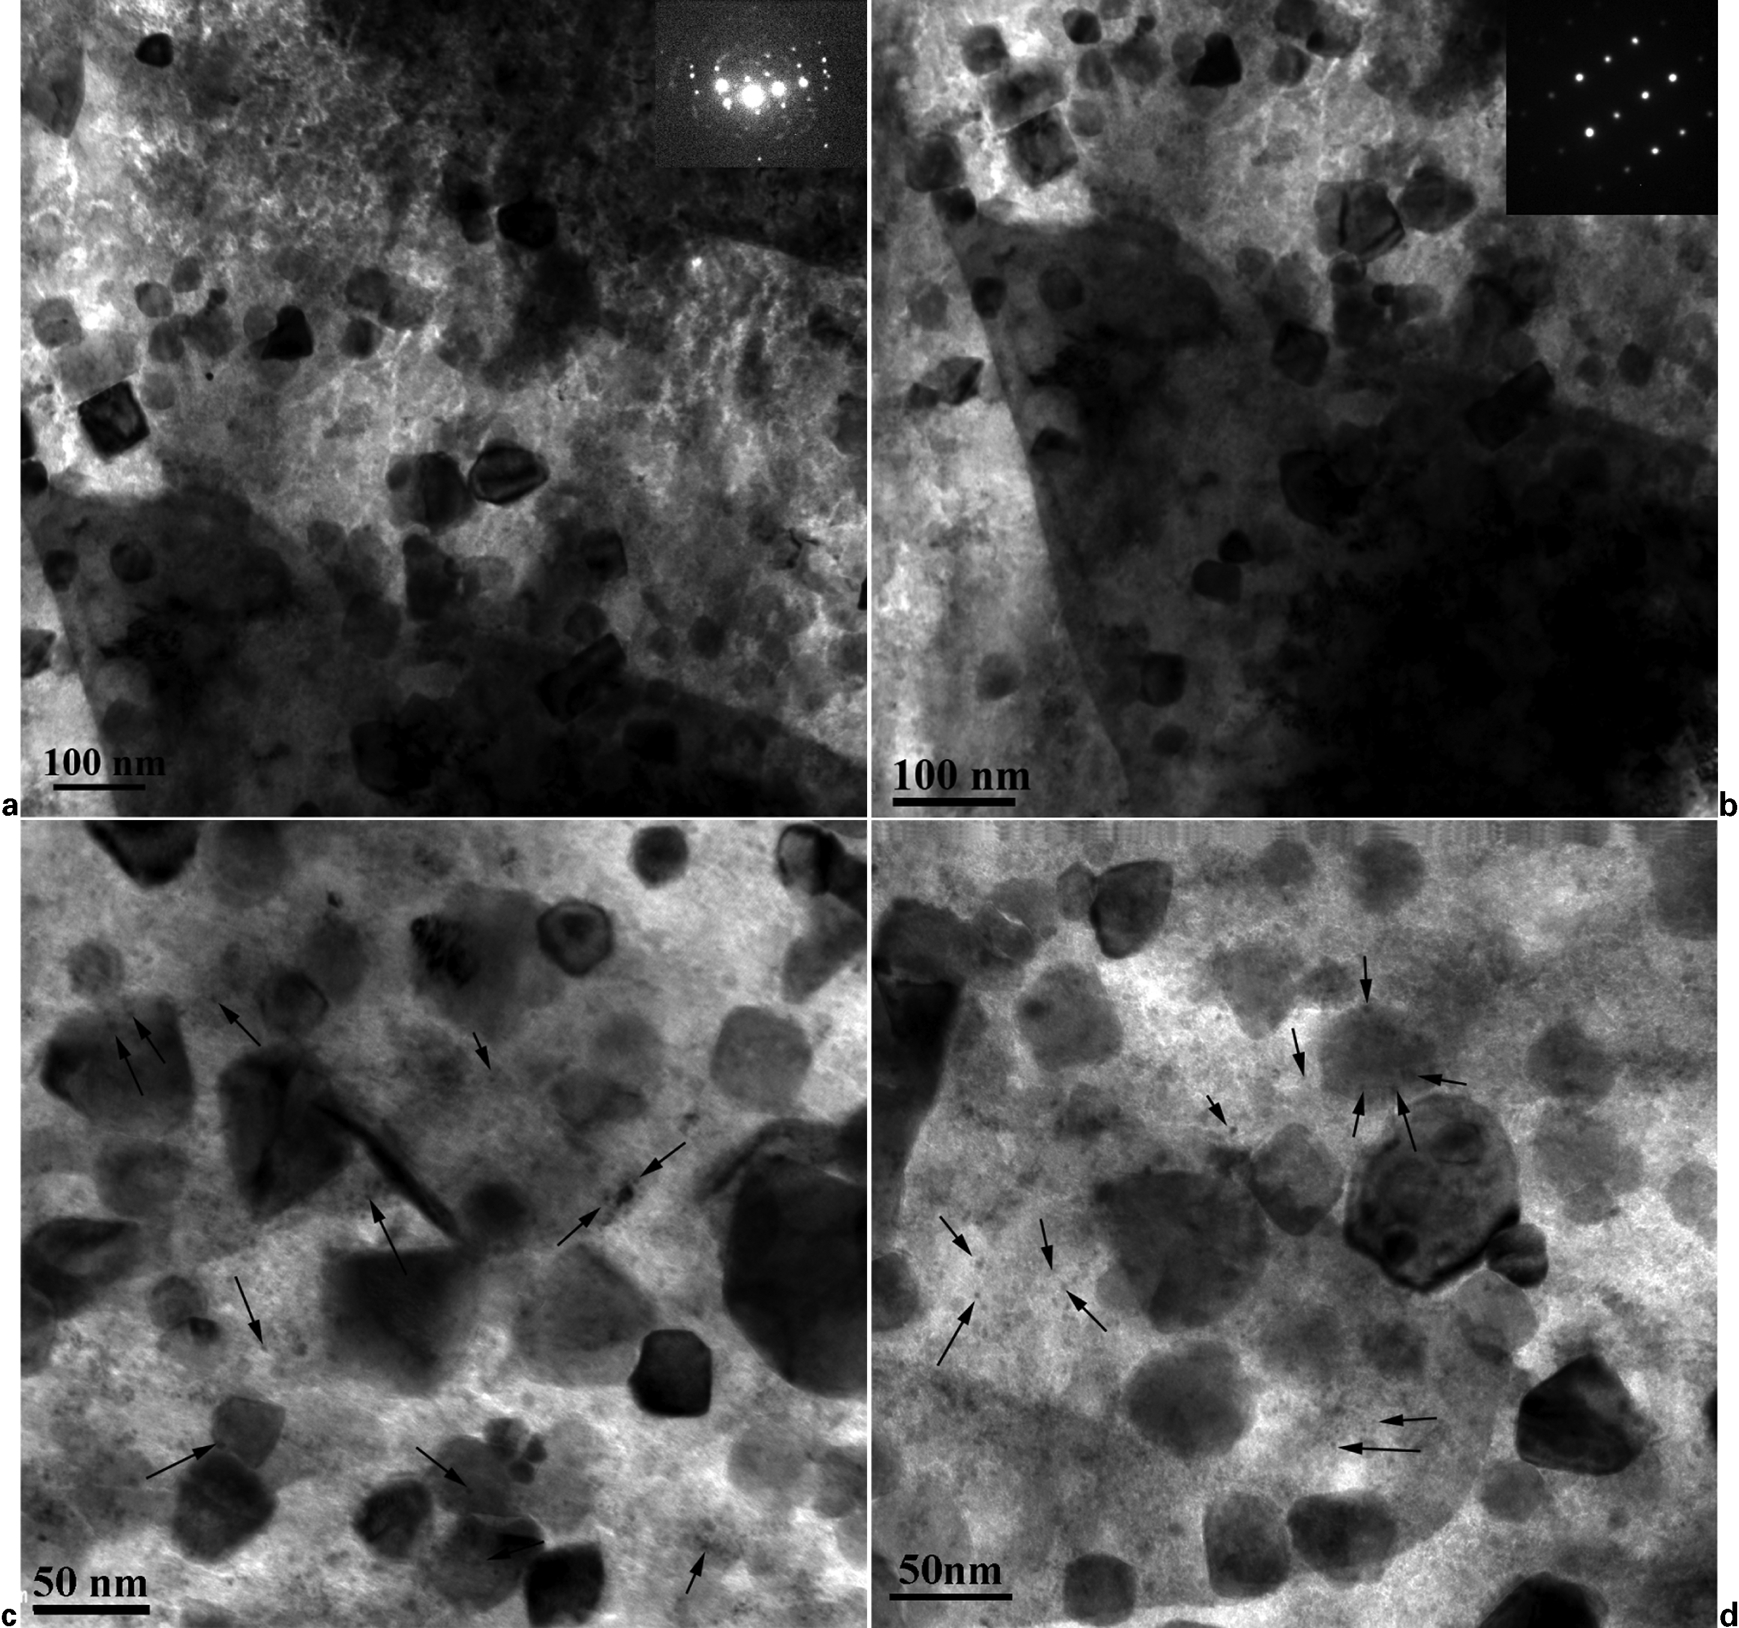
Bright field (TEM) image of a, c non-preoxidised and b, d preoxidised specimens with Pt nanoparticles (pointed with arrows) from test 1
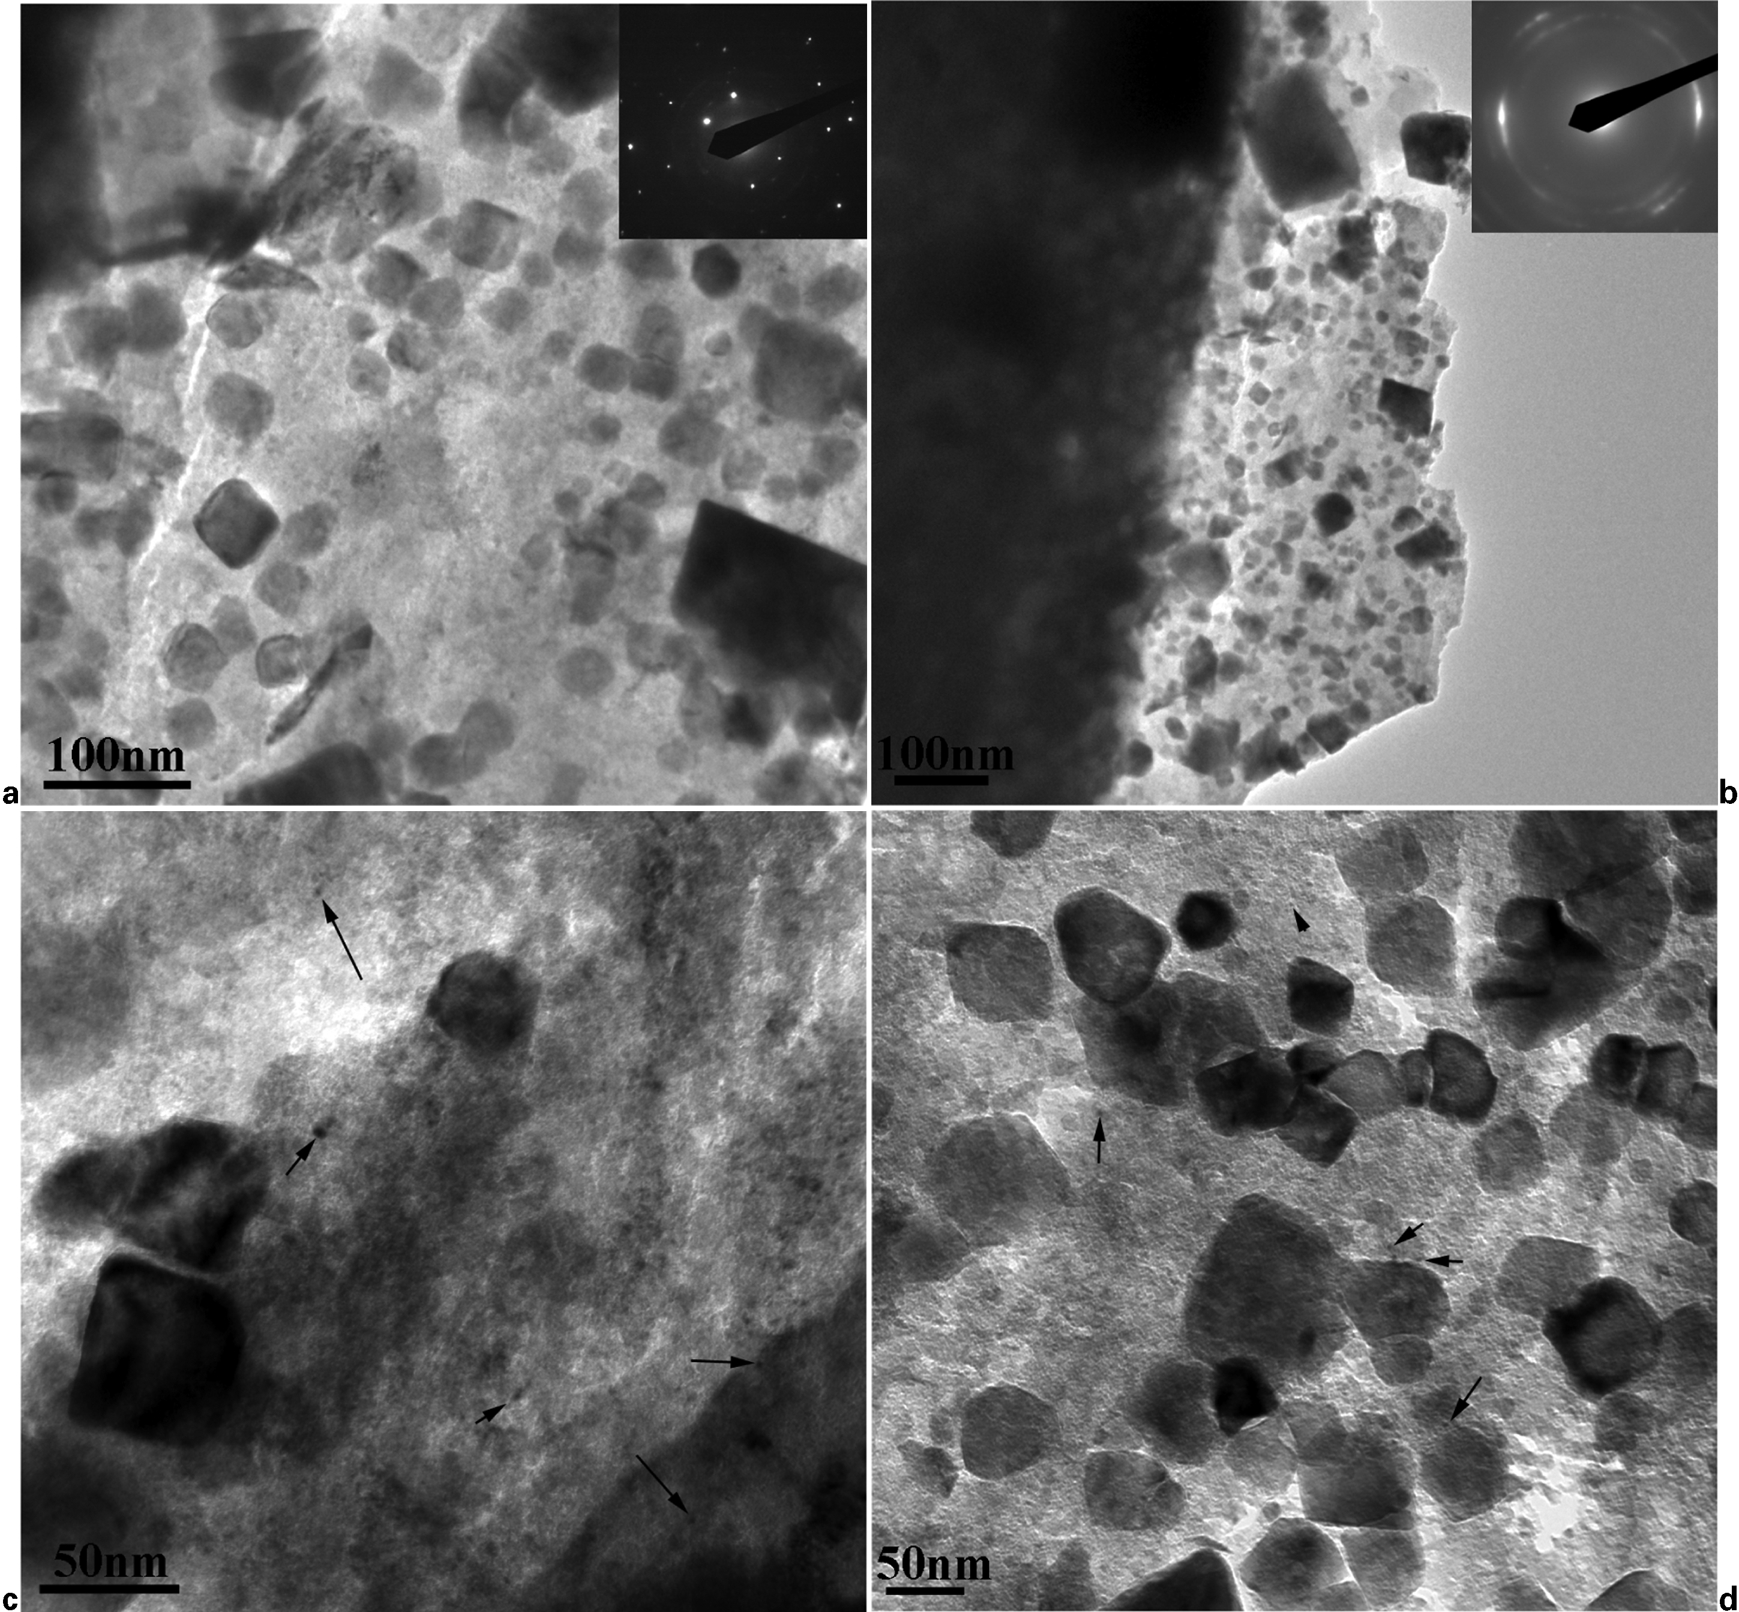
Bright field (TEM) image of a, c non-preoxidised and b, d preoxidised specimens with Pt nanoparticles (pointed with arrows) from test 2
Figure 9 shows the Pt particle size distribution of preoxidised and non-preoxidised specimens from both tests (test 1: Fig. 9a, test 2: Fig. 9b). The particle sizes were calculated using TEM pictures and ImageJ software 14 by thresholding the matrix background and increasing the contrast of the particles. The resolution of the particle size determination is limited by the pixel size in each TEM picture, which is ∼0·25 nm. As a result, the standard deviations of the measured particle sizes are rather large. Nevertheless, a trend in the particle sizes can be seen comparing both tests. The average Pt particle size from both preoxidised and non-preoxidised specimens was found to be ∼2·5±0·75 nm in test 1 and 3·2±0·90 nm in test 2. Therefore, it seems that a lower Pt injection rate results in the deposition of smaller Pt particles on the oxide layer of the steel. According to earlier investigations, 11 this is regarded as advantageous, because the reduction of the ECP is most effective if a relatively large number of small particles are evenly distributed across the specimen surface, compared with larger, and therefore fewer, particles. This seems to be in contradiction with the observation stated in the section on ‘Effect of Pt injection rate on ECP’, that the reduction of the ECP was less pronounced in case of test 1. So far, the exact reason for this behaviour is unclear, but regarding the lower Pt concentration on the specimens from test 1, it seems that less small Pt particles are deposited on the oxide surface compared to the slightly bigger particles in test 2. Additionally, some of the Pt particles are located inside the inner oxide layer and are not able to catalyse the recombination of O2–H2O2 with H2 to H2O.
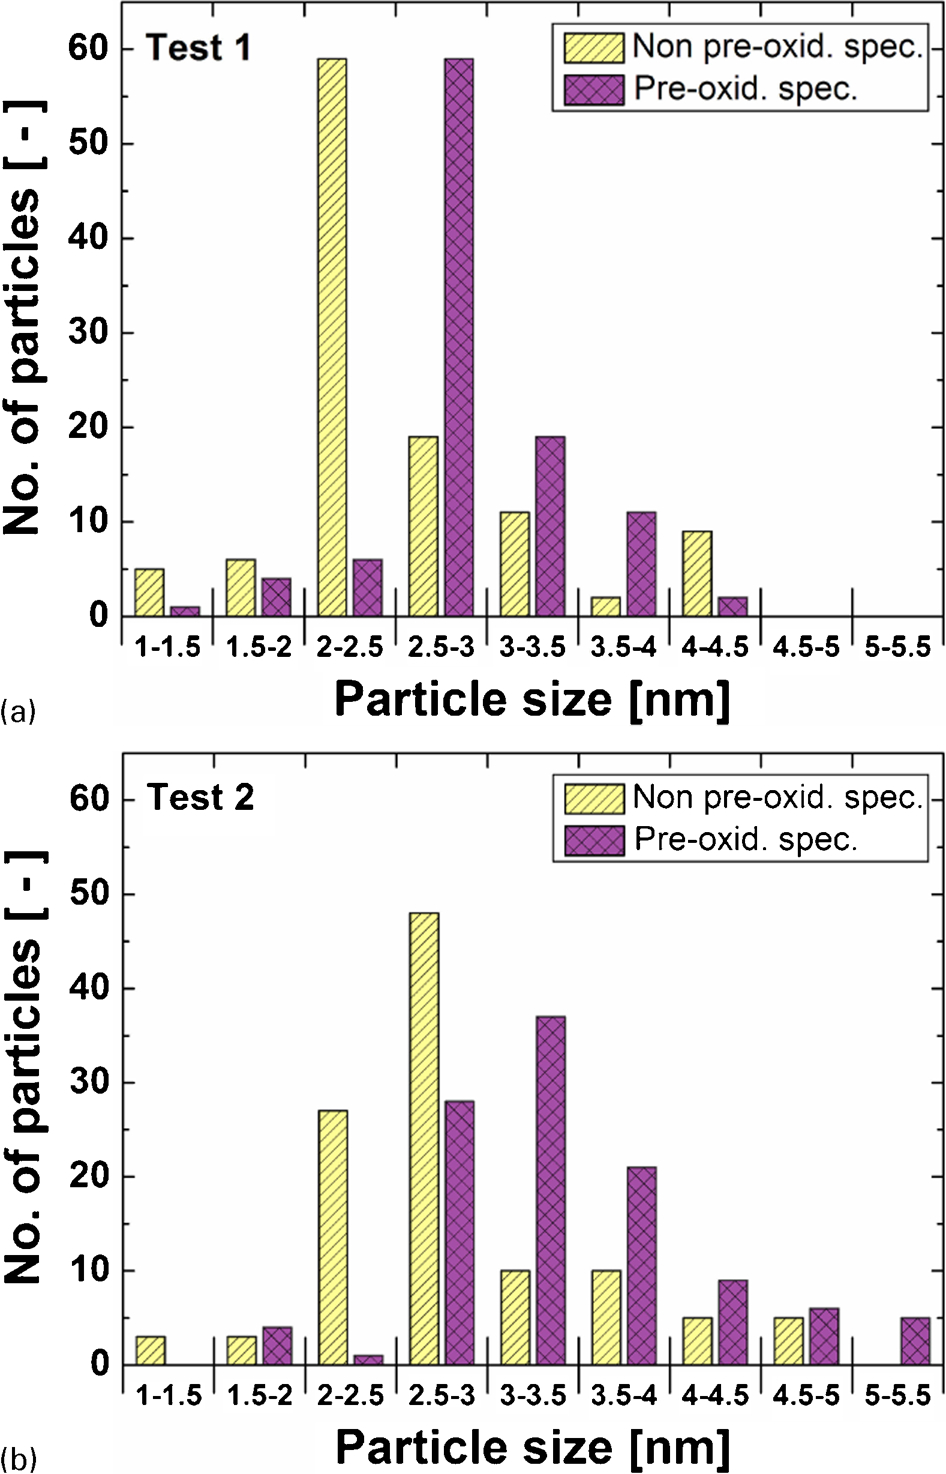
Pt particle size distribution from a test 1 and b test 2 for both non-preoxidised and preoxidised specimens respectively
Conclusions
In a sophisticated high temperature water loop facility at PSI, two experiments were performed investigating the Pt deposition behaviour under simulated BWR conditions at two different (extremely low) Pt injection rates and with differently pretreated coupon specimens. Taking together all observations from the ECP measurements, SEM and LA–ICP–MS analyses of these tests, it was shown that a more effective Pt deposition, resulting in a lower ECP and therefore better protection against SCC, could be achieved using a higher Pt injection rate (corresponding to a higher Pt concentration in the high temperature water). A longer preoxidation of the specimens seems to additionally increase the Pt concentration on the specimen surface. Transmission electron microscopy analysis of the surface–oxide film structure showed a more conclusive picture of the Pt distribution on stainless steel. In addition to some very few large Pt particles (found only in case of test 2), the diameter of the majority of Pt particles ranged from 1 to 5 nm. The experiment with lower Pt injection rate leads (in average) to slightly smaller sized Pt particles, which are believed to be advantageous for catalytic effectiveness. On the other hand, some of the Pt nanoparticles were found hidden under large oxide crystals, and some of them were found ∼5-10 nm deep in the inner oxide layer. Together with the slightly lower Pt concentration on the coupons from the test with lower injection rate, this again can explain the less effective reduction of the ECP during this test.
Experiments with larger amounts of Pt (closer to plant OLNC application conditions) and different injection rates are currently performed to verify the results and to get better insights into the Pt deposition behaviour and processes behind.
Footnotes
Acknowledgements
The financial support by ENSI and the contributions of the Swiss nuclear power plants KKL and KKM are gratefully acknowledged. Special thanks are also expressed to H. P. Seifert, B. Baumgartner, L. Nue (all PSI), G. Ledergerber (KKL) and C. Weber (KKM) for their excellent support of this project.