
Abstract
The corrosion study of the pipeline steel is extremely important for the safety of CO2 pipeline. The present work studied the effect of temperature on the corrosion behaviour of X70 steel in high pressure CO2/SO2/O2/H2O mixtures. Weight loss method was utilised to measure the corrosion rate. Environmental scanning electron microscopy and focused ion beam technology were employed to observe the morphology of product scales. X-ray diffraction was used to analyse the composition of product scales. The porosity of product scales was measured, and the exhaust gas was detected by gas chromatography. Results showed that the corrosion rate increased with the increasing temperature and then started to decline with temperature with the peak corrosion rate at 348 K. Results also showed that there was hydrogen that existed in the exhausted gas, indicating that the hydrogen evolution reaction was contained in the corrosion cathodic process.
Introduction
In recent years, climate change has caused extensive attention among the government, industry, academia and public almost all over the world. Carbon capture, transport and storage has been taken as one of the effective ways to address this issue,1 and therefore, it became a worldwide hot research topic.
Pipeline transport is one of the main ways to transport the captured CO2 to the sequestration sites under supercritical condition. There are many CO2 transportation pipelines that existed for enhanced oil recovery in the world with a length longer than 6000 km.2 Therefore, there is industrial experience for CO2 pipeline transportation. However, the experience is limited only for enhanced oil recovery application, in which there are almost no corrosive gases such as SO2 that existed in the CO2 mixtures. However, when the CO2 is captured from exhaust gas of power plant rather than natural CO2 well, a certain amount of impurities are present, especially when the CO2 will be coinjected with other impurities such as SO2 captured by oxyfuel technology. There are still many problems requiring in depth study.
A number of scholars have conducted a preliminary study on the corrosion of pipeline steel in supercritical CO2 containing impurities like SO2,3 – 8 but the job is far from the end, including the impact of temperature on corrosion behaviour. The possible factors that can affect the corrosion behaviour of pipeline steel include temperature, pressure, SO2 concentration, O2 concentration, relative humidity and flowrate. Among these factors, temperature is a very important factor since it greatly affects the rate of physical and chemical process as well as the growth of corrosion product scale, and it has been regarded as one of the most important parameters in corrosion rate determination.9 – 16 Therefore, so far, no detailed study has been published regarding the temperature effect on the corrosion behaviour of pipeline steel under supercritical CO2 mixtures with SO2, O2 and water vapour as impurities. To carry out an in depth and systematic research is of necessity.
Researchers have made a thorough study and analysis on the temperature effect on carbon steel corrosion in aqueous solution containing CO2 and other impurities.17 – 20 Although in the present study, CO2 is the solvent instead of solute and the mixtures are under supercritical or liquid condition instead of aqueous condition, the research approaches should still be applicable, such as the weight loss method and the scale analysis methods. Taking into account the practical CO2 pipeline transport temperature range, the temperature range of the present work was set to be under 100°C. Under such temperature range and environmental gaseous mixtures, there should have some similarities with carbon steel corrosion in the humid atmosphere containing SO2.
In this work, an environmental scanning electron microscope was utilised to observe the surface and cross-section morphology of the product scales, and it was also applied to observe morphology of the specimen after the removal of corrosion product scales to check the occurrence of pitting. Focused ion beam (FIB) technology was employed to study the inner structure of the product scales. The chemical composition of the product scales was analysed by X-ray diffraction (XRD) and energy dispersive X-ray spectroscopy (EDAX). A mercury intrusion porosimeter (MIP) was used to measure the porosity of product scale, and gas chromatography (GC) was employed to detect the exhaust gas content to understand the corrosion mechanism.
Experimental
The composition of X70 steel used in this study was Fe–0·054C–1·53Mn–0·266Si–0·011P–0·05Ni–0·0052S–0·013Cr–0·014V–0·010Cu–0·019Als–0·021Alt–0·0015Ca–0·209Mo–0·039Nb–0·015Ti–0·017Sn–0·0085N–0·012As. It is noted that Mn has the largest amount among the trace elements. The sample used for weight loss method had a size of ∼40×20×2·7 mm. The sample used for measuring the porosity of the product scale had a size of ∼20×15×2·7 mm. The sample size for the morphology observation and composition analysis was ∼10×10×1 mm. The samples were polished using silicon carbide papers up to 1200 grit, and then washed with acetone and anhydrous ethanol. Before the samples were weighed by an electronic balance, they were placed in vacuum desiccators to remove water.5 In this study, a CORTEST autoclave provided the high pressure reaction environment, which had a volume of 2·2 L. The test rig schematic diagram is shown in Fig. 1.
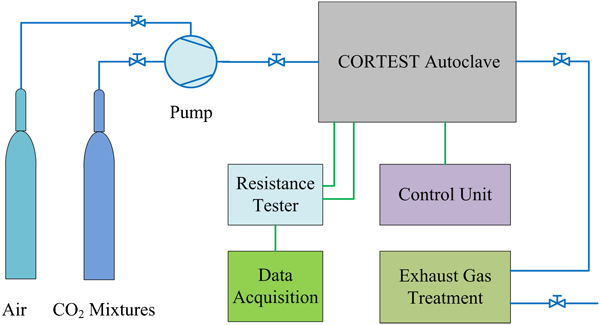
Test rig schematic diagram
The corroded samples were exposed to the Clarke solution to remove the corrosion products.21 The corrosion rate was determined by weight loss method.22 The traditional electrochemical methods are not suitable for this environment.15
The experimental conditions are shown in Table 1. A certain amount of water will be injected into the autoclave by pipette gun to generate a water vapour saturated CO2 state. The solubility of water in the high pressure CO2 was referred to open literatures.23 – 26 The oxygen in the autoclave was coming from the initial air in the autoclave. Using the autoclave volume data, the oxygen quantity can be calculated accurately, as shown in Table 1.
Test conditions
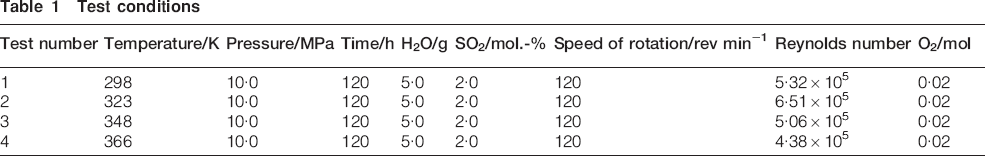
The rotation speed was chosen to be 120 rev min−1 to make a flowing environment, and the rotator was driven by a motor outside the autoclave through electromagnetic force. The rotation speed can be controlled and set through the autoclave control panel. Using the equation proposed by Wei and Ji,27 the average flow velocity of the CO2 mixtures in the autoclave can be approximately calculated as
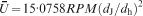
 is the average flow velocity of the CO2 mixtures (m s−1), RPM is the rotation speed (rev min−1), d J is the paddle diameter (m) and d h is the inner diameter of the autoclave (m). In the present study, the paddle diameter was 0·058 m and the inner diameter of the autoclave was 0·127 m. Based on the calculated average flow velocity, the Reynolds numbers can be calculated, which are also shown in Table 1. The CO2 density and viscosity were referred to NIST REFPROP software.
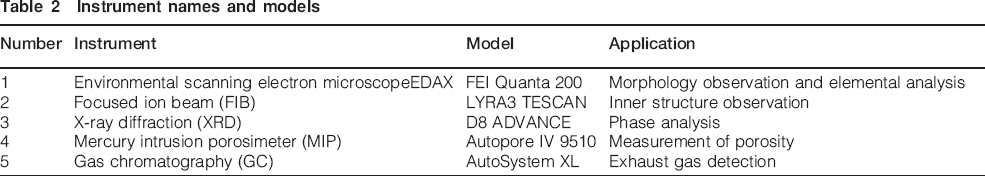
In addition, the instruments and their applications in the present study are listed in Table 2.
Instrument names and models
The porosity of corrosion product scale with uncorroded substrate was measured by MIP. Using the volume data before and after the entrance of mercury into the pores, the porosity can be determined. The real porosity of the product scale can be calculated as follows.
The volume of the sample before corrosion is V 1 (m3), the surface area of the sample before corrosion is A 1 (m2) and the immersion time is t (h). The total volume of corroded sample including the product scale is V T (m3), the measured porosity is ϵ F and the corrosion rate is CR (mm/year) calculated by the weight loss method. When the corrosion product scale was removed, the sample volume V 2 (m3) will be


Results and discussion
Corrosion rate
The result of corrosion rate using weight loss method is shown in Fig. 2. As seen, when the temperature increased, the corrosion rate first increased and then decreased with the maximum corrosion rate at ∼348 K. As described above, the supercritical CO2 is mixed with saturated water vapour. Under this environment, there should be a thin water film on the sample surface possibly due to adsorption condensation and chemical coagulation effect.7,8 The corrosion of steel occurring in a thin layer of electrolyte is quite different from that occurring in a bulk solution. The change trend of corrosion rate with temperature can be explained as follows.
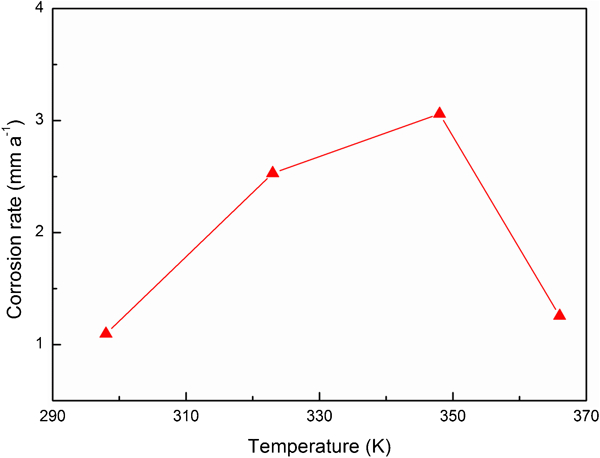
Corrosion rate of X70 steel in supercritical CO2 mixtures changes with temperature
As temperature increases, the mass transfer rates of the reactants diffusing across the water film increase. At the same time, the chemical reaction rates will also increase. In addition, the corrosion product substrate that formed at high temperature generally has different protection effect for further corrosion.20,28 All these effects may result in such increase first and then decrease profile as shown in Fig. 2. In the following sections, more details of the physical–chemical processes involved in the steel corrosion process in supercritical CO2 mixtures were explained and analysed.
Product scale analysis
Morphology analysis
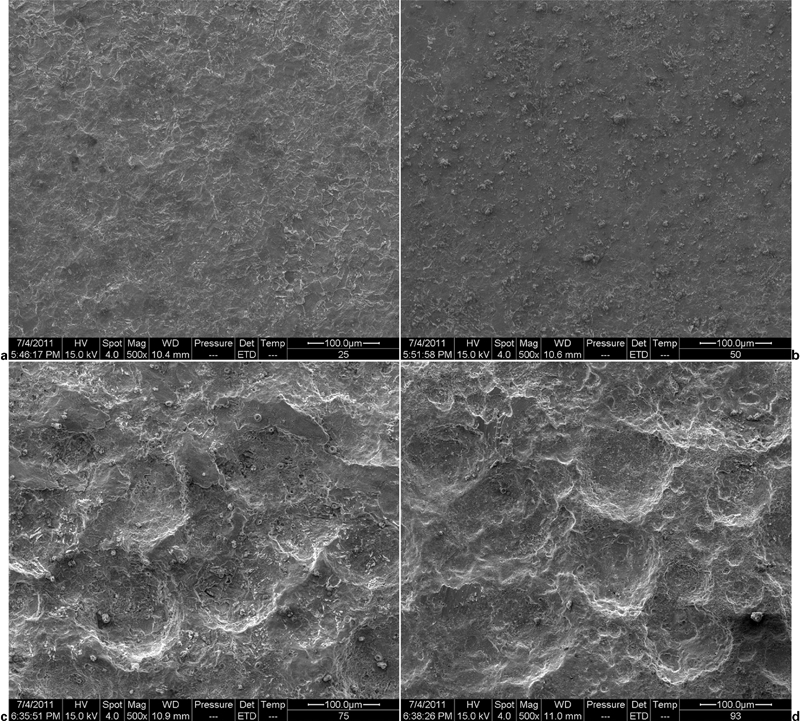
Figure 3 shows the surface morphology of X70 steel specimen after corrosion under different temperatures. The morphology for different temperatures was quite different. When the temperature was at 298 K, there were massive block shaped products formed, which were covered with some irregular thin product layer, and scale had tiny cracks. For a temperature of 323 K, there was two types of product scale: the dense inner scale and the loose outer scale, and the outer scale was easy to fall off. When the temperature was at 348 K, the stripped shaped products appeared. For a temperature of 366 K, the sphere shaped corrosion products accumulated on the surface together with some small irregular corrosion products on their top, and the scale seemed to be more dense and compact.
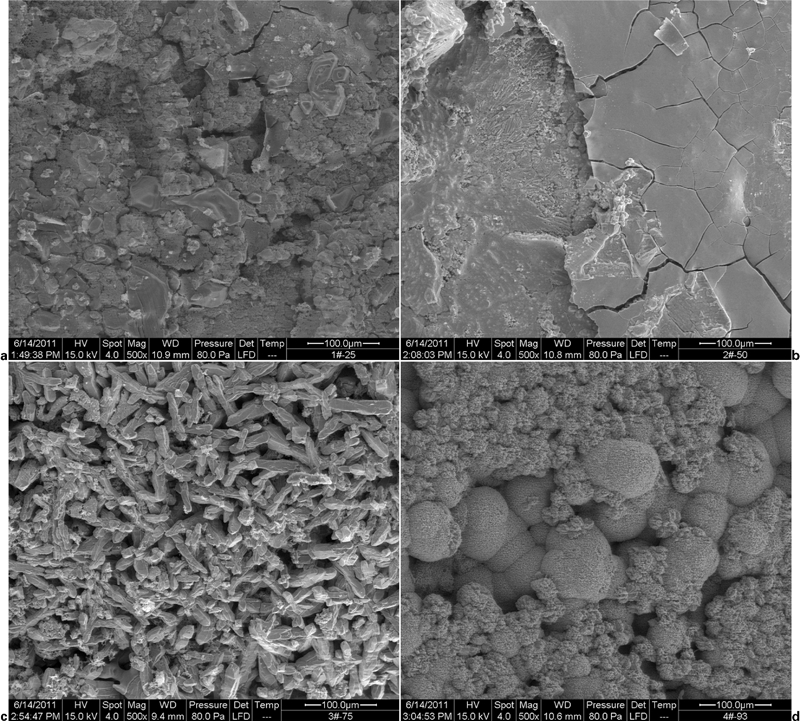
a 298 K; b 323 K; c 348 K; d 366 K
Figure 4 presents the cross-section morphology of corroded sample at different temperatures. Epoxy sealed corroded samples were polished to form the cross-section. The cross-section can be divided into three layers: the top layer in deep colour is the epoxy, the middle layer is the corrosion product scale with many pores or cracks and the bottom layer is the steel base. It was seen that when the temperatures were at 323 and 348 K, the product scales were relatively thicker. It was also found that the scales that formed under such two temperatures were easier to fall off and the epoxy samples could not be well polished to be a plane. Especially for scale formed at 348 K, the underneath layer had a poor connection to the substrate metal. The sphere shaped product that formed at 366 K had dense cross-section morphology, and it was closely connected to the base metal, which may explain the slowdown of the corrosion rate at 366 K as temperature increases.
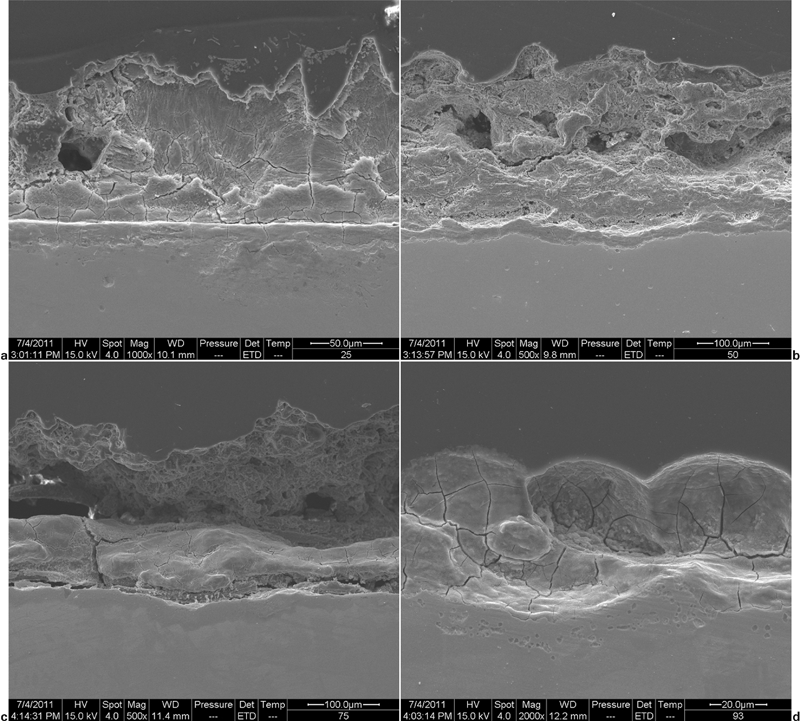
a 298 K; b 323 K; c 348 K; d 366 K
To further verify the existence of pitting, the surface of the corroded sample without product scales was checked. Figure 5 shows the surface morphology of corroded samples after the removal of product scales. It was seen that as the temperature was low (298 and 323 K), there was no clear pitting shown on the surface, which was relatively flat. As the temperatures increased (348 and 366 K), the surface was not flat yet. However, there was no sufficient evidence to show the occurrence of pitting corrosion. The harmfulness of pitting is far greater than the uniform corrosion. Therefore, we should try to avoid pitting phenomenon when CO2 is transported by pipeline in order to ensure the safety of pipeline transportation. Longer corrosion cycle experiments will be carried out to check the occurrence of pitting in the future work.
a 298 K; b 323 K; c 348 K; d 366 K
Figure 6 is a morphology diagram using the FIB technology to cut the sphere shaped product formed at 366 K. The spherical corrosion product was ∼50 μm in diameter. From the figure after cutting, it can be seen that the inner part of the sphere was solid, only with some micropores, but these micropores were not connected. This means that these micropores are not effective pores, which cannot provide the necessary channels for reactants and products in and out. No obvious cracks exist within the sphere. This indicates that the cracks on cross-section morphology in Fig. 4 are generated after processing.
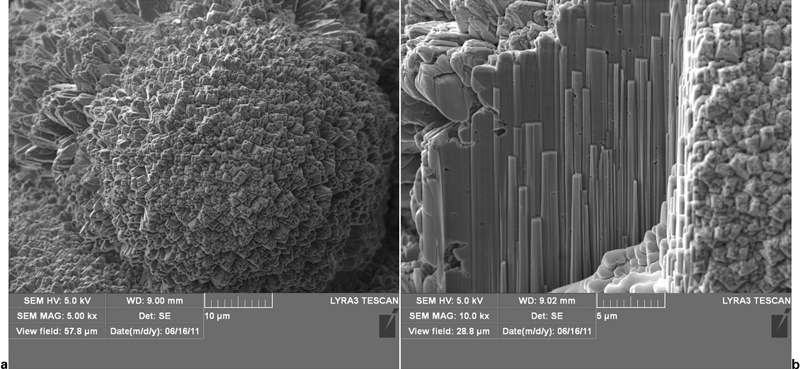
a before cutting; b after cutting
Chemical composition analysis
Figure 7 shows the XRD spectra of corroded samples with product scale. It can be seen that when the temperature was at 298 K, the corrosion product was mainly composed of FeSO3.3H2O and FeSO4.7H2O. For a temperature of 323 K, the main component of the corrosion product was FeSO4.4H2O. When the temperature was at 348 K, the corrosion product was mainly composed of FeSO4.H2O, with a small amount of FeSO4.4H2O. For a temperature of 366 K, only FeSO4.H2O was detected in the corrosion product. The results suggest that when the temperature is higher, the number of crystal water of the ferrous sulphate will be reduced, as well as the possibility to form ferrous sulphite. The ferrous sulphite may be decomposed or oxidised to ferrous sulphate by oxygen at higher temperature where the sulphite oxidation process will be faster. In addition, there was no FeCO3 detected, showing that SO2 plays a critical role in the electrochemical reaction process.5
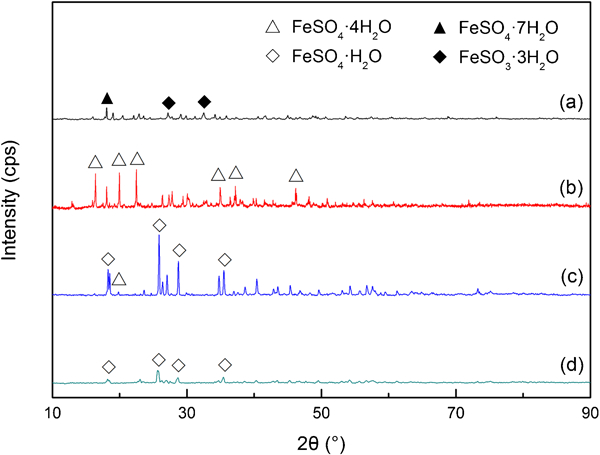
a 298 K; b 323 K; c 348 K; d 366 K
Figure 8 is an EDAX line scanning result of sample cross-section with scale. The scanning curve represents the element of C, O, Si, S, Mn, and Fe from top to bottom, respectively. From the EDAX line, the boundary of product scale and the substrate metal can be clearly distinguished. At the two sides of this boundary, the elemental content of Fe, S and O had a mutation. From the direction of the base metal to the scale, the elemental content of Mn also had a small degree of reduction, which means that Mn was consumed in the corrosion reaction, and MnSO4 might be generated.29 In addition, it can be found that the elemental content of C was higher at the higher temperature in the product scale. Because product scales that formed at temperatures of 323 and 348 K were easy to fall off when preparing for the cross-section sample and it was difficult to find a flat surface for EDAX scanning, the EDAX line scanning was not carried out at these two temperatures for the cross-section samples.
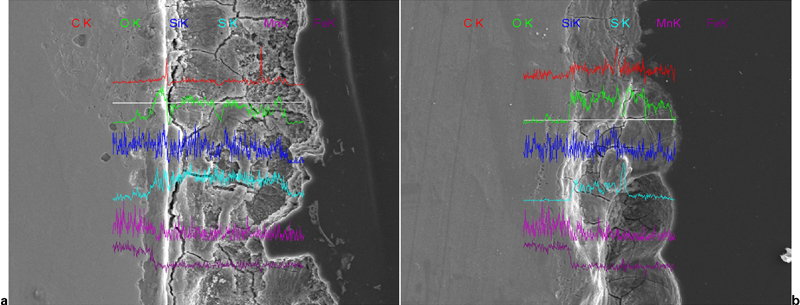
a 298 K; b 366 K
Physical properties measurement
X70 steel samples in the autoclave were hanging vertically. When finishing the experiment, it was found that the thickness of the sample at the lower part was thicker than the higher part, as shown in Fig. 9. To reduce measurement error, the average values of multiple measurements by vernier calliper were taken. Results indicate that the corrosion product on the sample surface has mobility and is easy to gather at the bottom of the sample. The main reasons for this phenomenon should be as follows: the major corrosion product ferrous sulphate has a strong hygroscopicity, and its solubility in water is greater,30 so the ferrous sulphate dissolved in water is easily flowing from the top to the bottom with the water film because of gravity, which appears that the thickness of the sample at the three parts will have a different thickness after corrosion. If the corrosion products were mainly ferrous sulphite, this phenomenon may not appear, because ferrous sulphite has a low solubility in water, though the solubility will increase when SO2 is contained in the solution.31
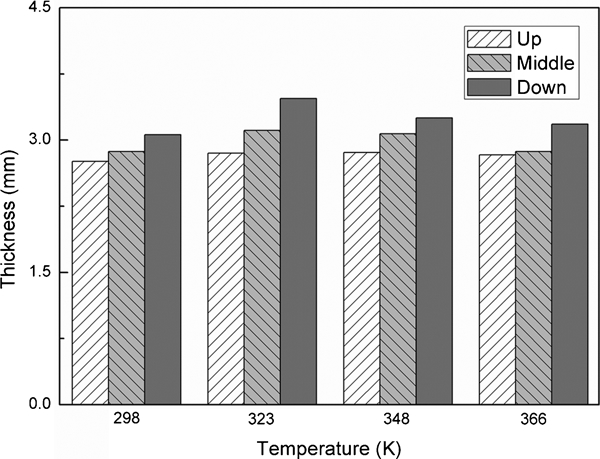
Thickness of corroded sample with scale at different parts
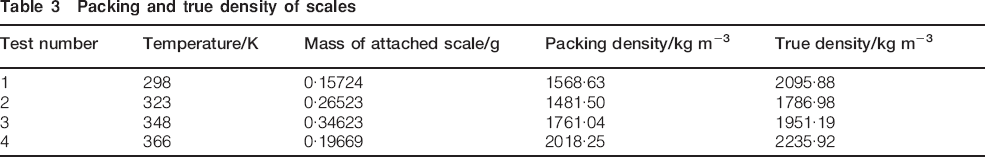
Figure 10 shows the average porosity and total attached volume of product scale. The result shows that the higher the temperature is, the lower porosity of the corrosion products would have. The trend of attached total volume of scale with the temperature was similar with the trend of corrosion rate with the temperature. In addition, the packing density and true density of scale can be calculated by the experimental data for the porosity, and the results are shown in Table 3. The true density of FeSO4.7H2O given by literature30 is 1895 kg m−3, which shows that the present results have a high credibility.
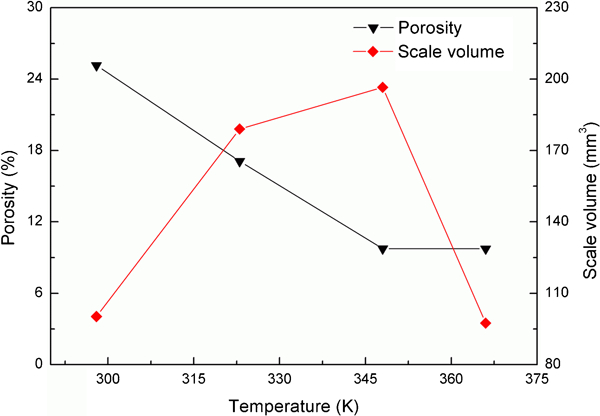
Average porosity and total attached volume of product scale
Packing and true density of scales
Exhaust gas detection
In order to understand the corrosion reaction mechanism, there is a necessity to examine whether the hydrogen is contained in the exhaust gas. For this purpose, gas bag was used to collect the exhaust gas at the end of experiment for GC detection. For the first time, 1 L of exhaust gas was collected directly for GC detection, and the results showed no significant peak of hydrogen. There are two possible reasons: the exhaust gas did not contain hydrogen, and the exhaust gas contained a very small amount of hydrogen and it was under the GC detection limit. In order to prove whether it is the latter reason, the exhaust gas was cleaned by NaOH solution to absorb large amount of acid in the exhaust gas before collection in order to increase the hydrogen concentration. By this approach, the significant peak of hydrogen was detected by GC, which means that the hydrogen was generated by the corrosion reaction. When hydrogen exists, hydrogen embrittlement may occur.32,33 This issue needs further research to confirm.
Additional discussion
From the above experimental results, it can be seen that the temperature has a great impact on the corrosion rate, scale morphology, scale composition and scale physical properties. From the results of scale porosity, it can be found that the scale porosity at 348 and 366 K has little difference. However, the corrosion rates under these two temperatures have big difference. The reason for this might be that out of the effect of the dense scale on the corrosion rate, the impact of temperature on the solubility of SO2 and O2 in the sample surface solution film is also an important reason, because the temperature will reduce the solubility of SO2 and O2 in the water film. These two factors together have led to great reduction to the corrosion rate when increasing the temperature.
It should also be realised that because of the high pressure characteristics of this experiment, many kinds of corrosion measurement methods cannot be employed in the experiment for in situ measurements. Because FeSO4 has a great solubility in water, when the sample was picked out for testing, the water on the sample surface would evaporate, resulting in precipitation of dissolved FeSO4, which will affect the morphology and porosity and other physical properties of the corrosion product scale in the corrosive environment. The use of electrochemical techniques in this environment has some difficulty, because the water film on the sample surface might not be continuous and the conductivity may also be poor.15 Therefore, scholars generally use weight loss method to measure the corrosion rate of carbon steel in this kind of environment.3 – 8
The corrosion mechanism of X70 steel in this kind of environment has been discussed in detail by Choi et al.3 and Xiang et al.5 The anodic reaction should be


It was noted that the X70 steel sample had a 1·55% weight fraction of Mn element. Mn2+ will be generated by corrosion, which is a kind of catalyst for oxidisation of sulphite ion into sulphate ion.35 The mechanism of sulphite catalytic oxidation by Mn2+ ions can be explained by Backstrom chain reaction theory.36 The existence of Mn2+ ions makes ferrous sulphite change into ferrous sulphate in a shorter period of time, and the reaction rate constant will be larger at the higher temperature, so oxidation rate of sulphite will be higher, which is the reason why ferrous sulphite was detected at low temperature and it was not detected at high temperature. The existence of sulphate will induce the pitting corrosion.37 Sulphate increases the critical concentration of metal salt in the pit, expressed as a fraction of the saturation concentration, which is required to sustain pit dissolution.37 However, this effect was not sufficiently reflected, which might be due to the short corrosion cycle in this study.
Conclusions
In this paper, weight loss method was used to measure the corrosion rate of X70 steel in high pressure CO2/SO2/H2O/O2 system for different temperatures, and a series of analytical instruments were employed to analyse morphology, composition and porosity of corrosion product scale. Through this study, the following conclusions can be concluded.
As the temperature increased, the corrosion rate increased until it reaches a peak value, and then declined. This is due to not only the high protectiveness of corrosion product scale at high temperature but also the reduction of the solubility of SO2 and O2 in the thin water film when increasing the temperature.
When the temperature reached 366 K, there was an accumulation of dense spherical corrosion products, which had a strong protection to the substrate metal. The product scales formed at temperatures of 323 and 348 K have a poor protection to the base metal.
The higher the temperature is, the less the number of water in crystallisation of ferrous sulphate will have, and the smaller the porosity of corrosion product scale will be.
The existence of hydrogen in the exhaust gas proves the existence of the hydrogen evolution reaction process.
Footnotes
Acknowledgements
This work received financial support from the National Key Technologies R&D Program of China (grant no. 2007BAC03A03).