
Abstract
The electrolytic properties of sodium chloride and no-clean solder flux residue, and their effects on electrochemical migration and dendrite growth on surface mount chip capacitors were investigated. The leakage current dependency on concentration of contaminants was measured by a solution conductivity method and compared with current measurements using DC voltage. The effect of electrolyte concentration and potential bias on the probability of electrochemical migration was investigated using a water droplet method on chip capacitors. The results from leakage current and conductivity measurement showed a difference which is caused by polarization effects, and demonstrated existing issues when indexing contamination levels on printed circuit board assemblies using a standardised solvent extract method. The experimental results showed that dendrite growth was dependent on the type and amount of contamination. The probability of migration becomes less dependent on the amount of contamination for sodium chloride at high concentrations. However, for organic acids from flux residues the migration probability shows an abrupt decrease with increasing concentration, which is attributed to a pH change in the condensed electrolyte phase.
Introduction
The corrosion of various metallic parts on printed circuit board assemblies (PCBA) is an increasing problem in recent years. A number of inherent factors such as: the use of multimaterial combinations, closer spacing due to demand for miniaturisation, contamination issues, and widespread use of electronic devices under outdoor conditions is contributing to the dramatic increase in reliability issues.1–4 Owing to technological advances, electronic devices have become more sensitive towards climatic conditions synergistically with levels of ionic contamination present on the surface of PCBAs today. Trace amounts of ionic contamination are able to act as corrosion enhancing factors by: assisting water adsorption on the surface by their hygroscopic nature; and increasing the surface electrolyte conductivity by dissolution of ionic contamination within the adsorbed water layer. Both of these factors increase the risk of leakage currents that subsequently lead to corrosion and premature failures.
A major source of ionic contamination on the PCBA surface is from the manufacturing processes. This includes bare printed circuit board (PCB) manufacturing processes involving the use of various plating, etching, and cleaning solutions, and most importantly the use of no-clean flux systems for soldering process during PCB assembling stage. One of the commonly used flux systems consists of weak organic acids (irrespective of wave or reflow soldered) as activators. Consequently, organic acid residues remain on PCBA surfaces5,6 and can dissolve into the water layer, resulting from humidity exposure, thereby causing leakage current and corrosion issues, especially electrochemical migration (ECM) under certain conditions.4,7–10
The cleanliness levels of a PCBA after the manufacturing are generally assessed through solution conductivity measurements called solvent extract conductivity or resistivity of solvent extract testing using the IPC-TM-650 tests methods manual no. 2·3·25. This test method relies on assessment of the level of ionic contamination through conductivity measurement of solution extracted from PCB or PCBA immersion. 11 As the level of ionic contamination increases, the resistivity of extracted solution decreases. The level of contamination on a PCBA surface is commonly expressed in terms of NaCl equivalent as described in the IPC J-STD-001 standard. The allowed level of total contamination is then defined as 1·56 μg cm−2 NaCl equivalent irrespective of the type of ionic contamination. However, the effect of various ionic residues on the leakage current and electronic corrosion mechanisms is different, which is not differentiated by the above method of cleanliness assessment. Therefore, inorganic residues such as chlorides will contribute more to the conductivity and are also more aggressive to corrosion of metals/alloys in general compared to partially ionised weak acids resulting from organic acid based solder flux systems. The effect of weak organic acids on electronic corrosion mechanisms such as ECM is likely to be different from chloride, while it can also adsorb onto the metal surface resulting in different surface chemistry. 10 Literature shows a number of investigations on the effect of flux residues on the leak current and corrosion on the PCBAs as a function of humidity levels, temperature, flux concentrations, and flux types.6,8,12–14 However, none of these investigations have correlated the behaviour of flux residue with NaCl at equivalent concentrations, which is the standard method for comparing different species with respect to surface contamination levels.
Therefore, the focus of this investigation is to compare the behaviour of a known organic acid based wave solder flux system with equivalent levels of NaCl with respect to electrolytic properties and corrosion behaviour, including ECM. The aim is to demonstrate the difference between the effect of flux residues and NaCl in causing leakage currents and, therefore to show that both types of residues need to be treated differently with respect to allowable levels of contamination. The results of this investigation are also useful to show the difference between weak organic acid type fluxes, and halide fluxes (as some of the flux systems have chlorides) and their effects on PCBA surface at levels defined by the IPC J-STD-001 standard.
Experimental
Components used for experiments
All the tests for determining probability of electrochemical migration were conducted using a chip capacitor as the substrate. The component used was a surface mount multilayer ceramic capacitor (Yageo, Phycomp) with 0805 housing size, 10 nF capacitance, and 50 V voltage rating. The electrode terminals of the capacitor were made of copper electroplated with pure tin; 15 the average distance between the terminals was 1 mm. All the parameters were tested on 18 replicate chip capacitors.
Electrolytes used as contamination
Two electrolytes (equivalent to different contamination) were used in this study namely: NaCl, which is also used to define the equivalent contamination levels on a PCBA as described before; and no-clean organic acid based wave solder flux, and thus typical of residue found on PCBA surfaces. The acid number of the flux is 15·8 mg KOH (+/−2·5%). The volatile organic compound content of the flux is 92 wt-%, water content is 5 wt-%, and the solid content is 2·2 wt-%. The flux contains synthetic resin as the film former. Both electrolyte solutions were prepared using water purified with Synergy UV system from Millipore Corp, and the base level resistivity of the water was the range between 2 MΩ cm and 2·5 MΩ cm as measured before the electrolyte preparation.
The concentrations of the electrolytes are presented in Table 1. Amounts of NaCl and flux residues in solutions were selected to represent concentrations below and above the IPC standard value of 1·56 μg cm−2. The volume of electrolyte and therefore the amount of contaminants was confined to the surface area of the components with the relationship of 1 mm3/1 mm2 providing the units of μg cm−2.
Electrolyte concentrations and amounts (shown in brackets as μg cm−2) following relationship of 1 mm3/1 mm2
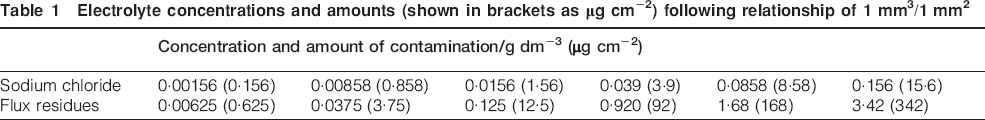
The electrolyte containing flux residues was prepared by pouring a desired amount of flux into a petri dish, allowing for the solvent to evaporate for 24 h at room temperature, and dissolving the remaining residues into the purified water. The concentrations given in Table 1 represent the residual solids content, which is comprised from water insoluble resin, and organic activators which contribute to ionic conductivity in the electrolytes. The main organic acid used in this flux system as an activator is adipic, as was determined by ion chromatography.
Leakage current measurements using platinum electrodes
The level of leakage current that can be sustained in various electrolyte solutions was measured using a pair of closely spaced platinum electrodes immersed into a droplet of the electrolyte solution on a clean polystyrene substrate. The diameter, length of each electrode, and the distance between them were respectively 0·5, 2·5 and 3 mm. All measurements were carried out at 5 V DC and by placing 100 mm3 droplets of the desired solution under the electrodes. Current passing through the solution was then measured for 2 min and the steady state value of the leakage current was noted. The leakage current measurements were performed using a ‘BioLogic VSP’ multichannel potentiostat having three independent potentiostat units with 0-20 V compliance voltage and 1 nA resolution.
Conductivity measurement of electrolyte
In order to differentiate between the leakage currents from an applied DC voltage, and standard conductivity measurements using AC voltage (IPC-TM-650 2·3·25), the conductivity of the electrolyte solutions were also measured using a conductivity meter with 4-electrode conductivity cell (cell constant k = 0·521 cm−1) from Radiometer Analytical, ‘CDM210’.
Single component electrochemical migration tests
Electrochemical migration tests at single component level were conducted using a special in-house built ‘single component electrochemical migration’ set-up described elsewhere. 16 Figure 1 shows a picture of the setup where three components can be loaded simultaneously for experiments (Fig. 1b shows a magnified view of the component with droplet connecting both electrodes of the component). The set-up consists of a sample holder having two small adjustable probes, which act as connectors to each end of the surface mount component under test. Therefore, a single test component is fixed between the metal which being spring-loaded onto the sample to ensure good electrical contact.
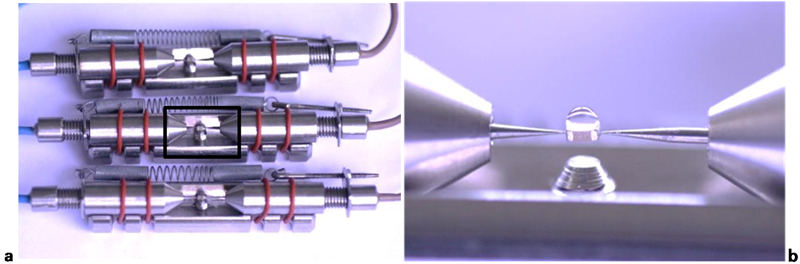
View of single component electrochemical migration set-up
Once within the set-up, a microdroplet of the desired electrolyte is placed on top of the components using a micropipette. The volume of droplet was confined to the area of the component providing a fixed level of contamination in terms of μg cm−2 (using solutions shown in Table 1). A relationship of 1 mm3 of solution over 1 mm2 area was used to fix the level in μg cm−1, which enabled an equivalent between g dm−3 and μg cm−2 with a ratio of 1∶100. The test component used in this work was a size 0805 multilayer ceramic capacitor (surface area 2·5 mm2), and accordingly 2·5 mm3 of solution was applied on top of it.
The effect of potential bias on the tendency for electrochemical migration was examined in the DC voltage range 1-25 V using an in-house built multichannel multiplexer unit described elsewhere. 17 The leakage current, and any short circuit currents as a result of dendrite growth were measured with a 1 μA resolution ammeter connected in the circuit via a two switch system. The sampling rate for the leakage current reading was set to 1 s. The experiments were carried out under ambient conditions: temperature 23·5-24·5°C, relative humidity 30-40%.
Results
Comparison of electrolytic properties of contaminants
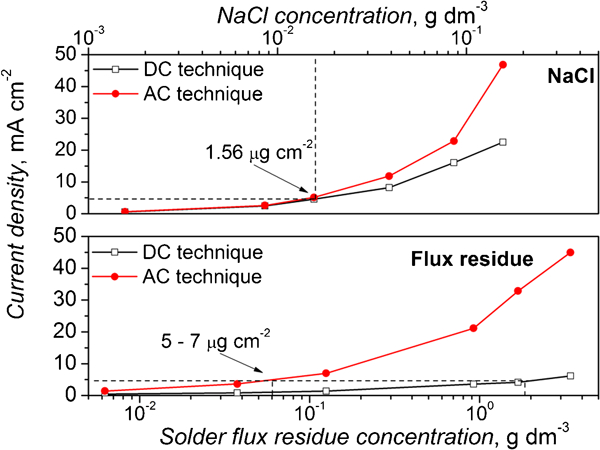
Leakage current and solution conductivity dependence on concentration at room temperature was measured experimentally for various sodium chloride and flux residue levels with quantities equivalent to IPC standard level 1·56 μg cm−2. The results are shown in Fig. 2. The conductivity values for both NaCl and flux residue are of similar magnitude at lower concentration levels. However, the conductivity of NaCl follows a linear dependence with concentration while the organic acid flux residue showed a curved response that flattens off above a concentration indicating a maximum current limit compared to NaCl contamination. The measured base leakage current for pure water at 5 V DC was in the range between 1·25 and 1·6 μA.
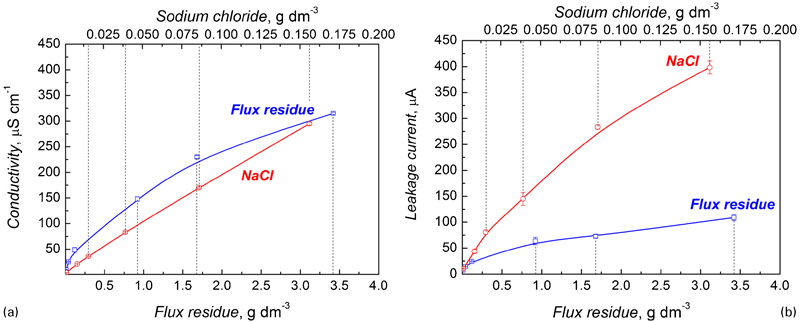
Solution conductivity and leakage current for NaCl and flux residue solution
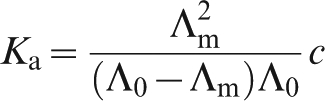
The conductivity dependence of NaCl on concentration can be understood because of the fact that NaCl is a strong electrolyte and completely dissociates into Na+ and Cl− ions following Kohlrausch's law
18

pKa values for various weak organic acids commonly used in no-clean fluxes at 25°C
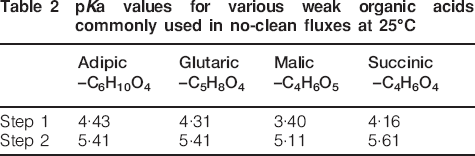
The logarithm of dissociation constant of adipic acid is 4·43 and 5·41 for the first and second dissociation constants respectively (Table 2). The larger the value of pK a, the smaller is the extent of dissociation and the lower the conductivity.
The increase in concentration shifts the dissociation equilibrium in the direction of non-dissociated acid resulting in hindering of conductivity with increase in flux residue concentration. It causes the main difference in solution conductivity dependence on concentration for NaCl and WOAs in the flux residue. When comparing the leakage current at higher concentrations, the difference between NaCl and flux residue is further widened. This also can be attributed to polarisation effects on the surface of electrodes, whereas the conductivity measurements with AC voltage exclude the polarisation factor.
It is important to remember that the cleanliness predictability of PCBAs and its effect on corrosion reliability is measured using an AC method avoiding electrode polarization (IPC-TM-650 method 2·3·25) method, while the surface insulation resistance uses a DC method that would result in electrode polarisation (IPC-TM-650 methods 2·6·3·3 and 2·6·3·7). The results reported above clearly demonstrate that the contamination level calculated in terms of NaCl equivalent from conductivity measurements need not necessarily match with the actual leakage current on PCBA surfaces, which can be purely a DC effect. Therefore, electrode polarisation becomes a dominating factor. Further, defining the cleanliness level in terms of NaCl equivalent indirectly assumes that all the ionic contamination types contribute to the leakage current at similar levels, but this is seldom true, instead it depends more on the nature of the ionic residue (such as strong or weak ionic residue, and its effects on metal dissolution).
The discrepancy between conductivity and leakage current measurement is further illustrated in Fig. 3, where the leakage current measured using the platinum electrode is compared with the leakage current calculated from the conductivity using Ohms law. Figure 3 shows higher current values calculated from the conductivity measurement for both electrolytes, however as expected the difference is much higher for flux residue. The main organic acid content in the present system is adipic acid, however the results are generally applicable to all organic acid based flux systems. Therefore, weak organic acids in solution usually adsorb on to the electrode surface, which can influence both the dissolution during corrosion of positively biased electrodes on a PCBA, and also influence metal deposition during electrochemical migration.10,19,20
Current density dependence on concentration of NaCl and solder flux residues (equivalent between g dm−3 and μg cm−2 is selected with ratio of 1∶100 as is followed in ECM test on single components)
Extrapolation of the leakage current for NaCl at a contamination level of 1·56 μg cm−2 to that of the flux residue shows that about 3-5 times more flux residue is needed to create similar levels of leakage current as for NaCl. This is valid when comparing leakage currents calculated using conductivity measurements; however, if the leakage current is directly measured using a DC method the difference between the two electrolytes is higher and it requires nearly 100 μg cm−2 of flux residue in order to get the same current density as for 1·56 μg cm−2 NaCl. Therefore, the corrosion reliability of PCBAs is a DC effect for which the type of contamination is an important factor. Here we show that very low levels of NaCl contamination can cause much higher leakage currents (Faraday current) than the equivalent levels of flux residue. Therefore, the correlation of contamination levels based on NaCl equivalent is not necessarily correct when the major contamination on a PCBA is organic acid based flux residue. In other words the magnitude of the leakage current on the board depends on the type of contamination.
Figure 4 shows the influence of temperature on conductivity of solutions with NaCl and organic acid flux residue. The temperature dependency of conductivity for solutions is related to the changes in properties of water and changes in dissociation rate of the electrolytes.18,21 The results show that the temperature dependence of conductivity, and therefore the expected leakage current, on PCBAs is determined by the type of contamination. The variation of temperature on the PCBA during use can reduce the reliability significantly if high humidity levels are present. It requires less contamination to cause the same reduction of surface insulation resistance as the temperature increases. As a result, increases the propensity of the leak currents, corrosion and premature failures in the circuits.
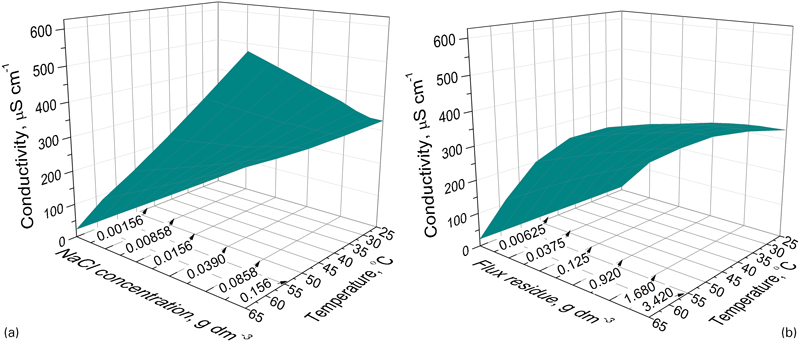
Conductivity dependence on temperature and concentration for a NaCl and b solder flux residue
Effect of sodium chloride and flux residue on electrochemical migration
The influence of contamination levels on electrochemical migration was investigated using a droplet test method by placing microdroplet of solution (equivalent to concentration in μg cm−2) on the single multilayer ceramic capacitor as described above. The leakage current between the terminals of the chip capacitor was measured at an applied 5 V DC voltage. A typical potentiostatic current–time curve from the experiment is shown in Fig. 5. The base line current is representative of the current leaking through the solution between the terminals of the capacitor, while the peaks correspond to ECM, intermittent dendrite shorting, and breakdown of dendrites.
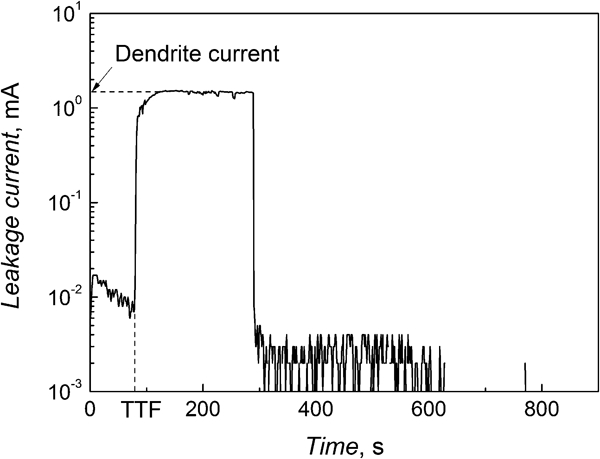
Typical potentiostatic current–time graph from ECM testing on 0805 multilayer ceramic capacitor
The current–time curves similar to the one shown in Fig. 5 from the experiments were analysed for three parameters namely:
the number of components that showed ECM out of 18 components tested
the time to first appearance of dendrites
the average level of current leaking through the dendrites after the electric short circuit.
Figure 6 shows the probability of ECM (i.e. the number of capacitors that showed migration out of 18 experiments in each category expressed as a percentage), and average dendrite current for NaCl and flux residue as a function of concentration. The average time to failure values corresponding to each set are shown on the bars.
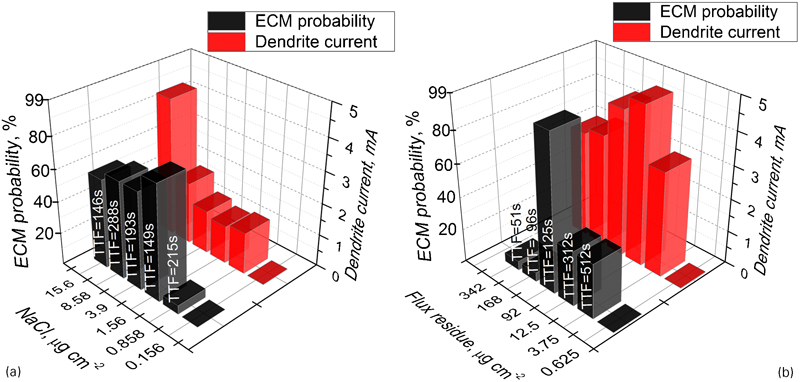
ECM probability and dendrite current as function of concentration
Figure 7 shows the morphology of the dendrite after the migration test for NaCl and the flux residue as a function of concentration. For NaCl, the probability of migration increases rapidly above a concentration of 0·858 μg cm−2. Below this level, the migration probability is low mainly due to the low dissolution rate of tin. Typical surface morphology of a component (Fig. 7) shows very little corrosion products with white appearance. However, as the concentration of chloride increases, dendrites start appearing, and at very high concentration levels a mixture of dendrite and white precipitated species can be seen. At high chloride levels the probability of migration also slightly reduces due to the large amounts of dissolved tin ions in the solution which leads to heavy precipitation reducing the migration rate as reported in literature.15,22 The precipitated species can be hydroxides of tin namely Sn(OH)4 and/or -Sn(OH)2, although intermediate hydroxyl chloride species are also possible. 23
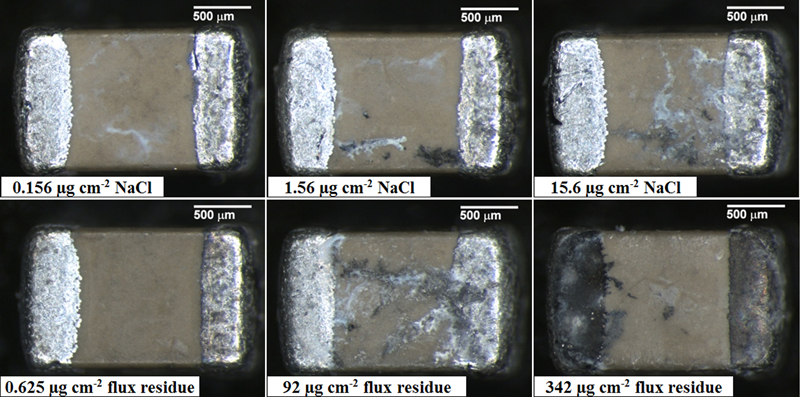
Size 0805 capacitors after ECM testing at 5 V DC [NaCl and solder flux residue concentrations are listed in images (anode: right terminal, cathode: left terminal)]
Optical micrographs of representative tested components with flux residue (Fig. 7) shows that the level of corrosion is negligible at lower concentrations, however at 92 μg cm−2, the surface of the component shows a clear dendrite mixed with some hydroxides. The probability of ECM and dendrite growth were highest at this concentration (Fig. 6). However, further increase in concentration caused only a low probability for migration, where the component showed few dendrite initiation points spread all over the cathode electrode surface and edges, resulting in a black appearance of the surface (Fig. 7). Also heavy corrosion on the anode resulted in dissolution of the whole tin upper layer revealing Ni and Cu layer beneath.
Optical microscope images at the highest concentrations of flux residue revealed heavy corrosion of anode terminal but no dendrites or precipitation of tin hydroxides as it was observed for NaCl. This appearance indicates that the pH level of solution was more acidic and thereby the precipitation of tin hydroxides was thermodynamically unfavourable. The appearance of the capacitors shows that all the metal dissolved on the anode migrated towards cathode and deposited there as an oxide or hydroxide, however the dissolution, migration and precipitation of copper ions is also likely. It is known that the precipitation of tin as an oxide can create a passive film (e.g. cassiterite SnO2), 24 which stability increases with dehydration of tin hydroxides. 25
This is further illustrated by the SEM picture shown in Fig. 8. The appearance of black deposits near the cathode is shown in Fig. 8c, while Fig. 8b shows heavy corrosion of the anodic terminal. The EDS analysis of composition of black deposits (Fig. 8c) showed high content of tin (65 wt-%) and oxygen (30 wt-%), and small amount of copper (5 wt-%).
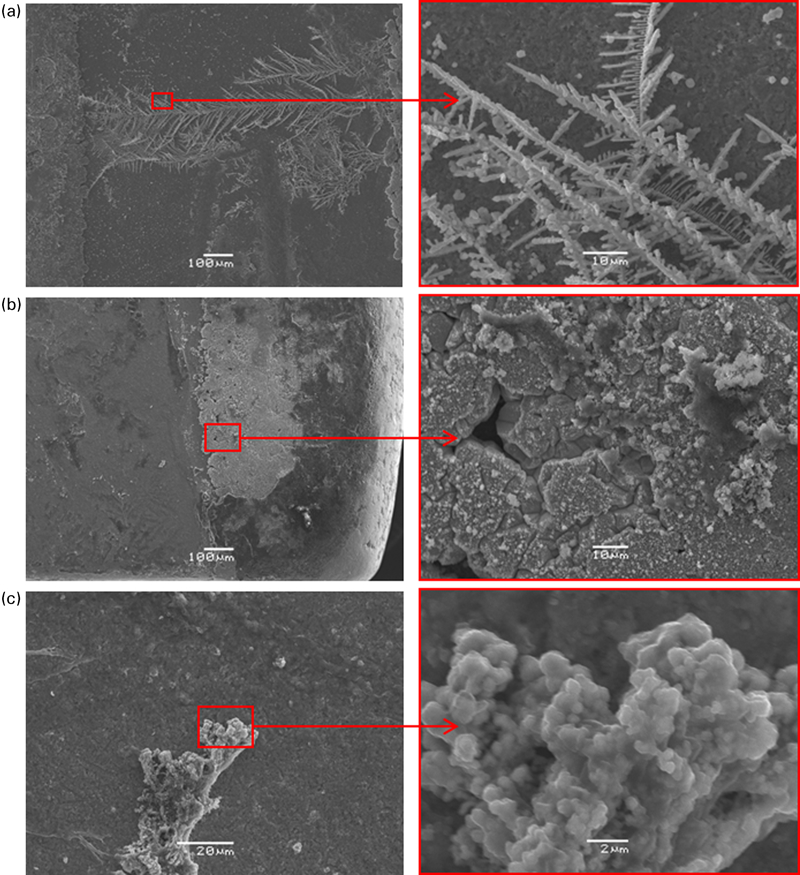
Typical SEM images of capacitor after ECM testing
The appearance of dendrite formation at flux residue concentrations between 3·75 and 92 μg cm−2 is similar to the appearance of dendrites observed with NaCl. Optical microscope images revealed the dendrites of dark grey colour bridging the terminals and the white deposits – tin hydroxides (Fig. 7).
The presence of copper indicates that the terminal is severely corroded. The electroplated layer of tin was heavily dissolved and the underlying layer of copper, which is the termination of multilayer ceramic capacitor, 26 was exposed to electrolyte solution and thereby corroded. The EDS analysis of the corrosion products on the anode terminal indicated mainly tin (85 wt-%), however some amount of copper (20 wt-%) and small amounts of chromium (less than 5 wt-%) were identified. Both elements are known to be used as termination materials for multilayer chip capacitors. 27 They were identified on the very edges of the anode terminal, where the dissolution rate of metal is expected to be the highest.
The results revealed that the remaining solder flux on the components can accelerate ECM considerably if present at certain concentrations. The presence of non-activated no-clean solder flux residues at concentrations around 92 μg cm−2 increases the migration probability on size 0805 ceramic capacitor to greater than 80% under water droplet conditions. However, the probability of migration is reduced at both low and high concentrations of flux residues. At low concentration the behaviour is assumed to be due to the low dissolution of metal ions, while at high concentration the effect is due to over production of metal ions thereby precipitation of tin hydroxide dominates. The SEM/EDS analysis of the capacitors with high contamination revealed heavy deterioration of anode terminal and corrosion products on the cathode terminal indicating severely corrosive conditions that are, however, unfavourable for ECM.
In connection with the IPC standard of defining contamination level as NaCl equivalent, the results once again stress the point that the effect on ECM very much depend on the type of contamination (especially the difference between strong and weak electrolytes). The quantities of equivalent levels of flux residue defined by the conductivity measurements is not the critical limit at which the highest levels of migration could be found, but the concentration is more moved towards the corresponding equivalent concentration derived from the leakage current. The information provided here is based on the single organic acid flux system used in this investigation, but the reasoning behind the hypothesis is based on the general difference between strong and weak electrolytes, and difference of reactivity of chloride and carboxylic acid ions to corrosion, which in general could be applied to all flux systems based on weak organic acids.
Effect of electric field on electrochemical migration
The effect of electric field in the range between 1 and 25 mV μm−1 on the probability of electrochemical migration and dendrite formation was investigated at 1·56 and 15·6 μg cm−2 concentrations of NaCl and on uncontaminated components (Fig. 9). It is seen that the probability of migration initially increases with voltage until intermediate potential levels are reached after which further increase in potential shows a decrease in probability for migration. The electric field at which maximum probability of migration occurs is a function of NaCl concentration, however, it was found to be around 10 and 15 mV μm−1, which respectively was achieved under 10 V DC and 15 V DC voltage. Also the probability of migration in general was low at lower potential bias values such as 1-2·5 V above which the probability increased drastically in solutions containing NaCl, while the probability of migration in the pure water remained low irrespective of the potential bias.
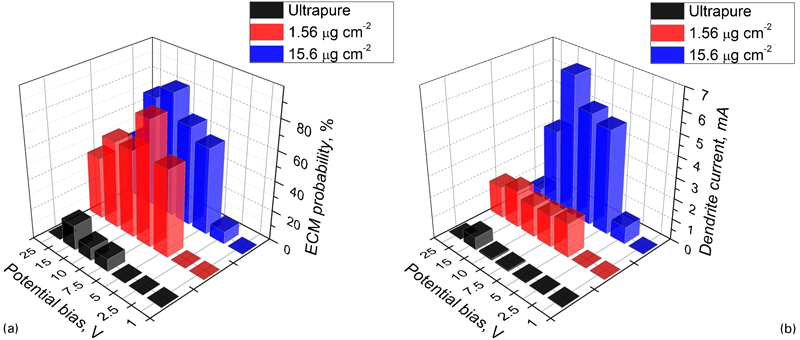
Effect of potential bias on a probability of ECM and b dendrite current
In general the probability of migration showed a bell curve with an increasing trend initially followed by a decreasing trend above the maximum – similar to the trend found for increase in concentrations of contaminants. However, Fig. 9a shows, the effect of contamination is more pronounced especially from pure water to 1·56 μg cm−2 NaCl solution. The dendrite current also shows a similar behaviour except that a large increase occurs at a contamination level of 15·6 μg cm−2 indicating the formation of thick dendrites unlike in other cases. It shows that increased contamination level increases the dissolution rate of the metal and consequently forms thicker and more branched dendrites containing more metal and hydroxide precipitation. As a result, the high amount of metal in the dendrites increases the current leaking through. However, as the potential increases, the probability of migration decreases, which also correlates with a decrease in the dendrite current. This is due to the fact that rate of dissolution of tin increases with increase in potential bias similar to increase in contamination. This leads to precipitation of the hydroxide species, while the heavy gas evolution at the anode and cathode also inhibit the formation of dendrite. Minzari et al.15,16 have reported similar phenomenon with increase in potential bias or contamination level.
Typical optical micrographs from the potential bias experiments are shown in Fig. 10. A lack of observed dendrites on the components shown in Fig. 10 does not mean that there is no migration at the corresponding potential level, instead the micrographs shown in Fig. 10 shows some of the typical features observed in general at various potential levels. Micrograph for 1 V potential bias shows no dendrites, only a precipitated layer at the middle of the component indicating the transition between the acidic to alkaline side during the experiments where tin hydroxide is precipitated at the intermediate pH areas. The diffusion of the dissolved metal ions is mainly dependent on the effective electrical field strength. 28 It can be assumed that the electric field strength was insufficient enough for tin hydroxides to reach cathode terminal of the capacitor. It has also been reported that the threshold electric field under which the ECM will not occur is below 1 mV μm−1. 4
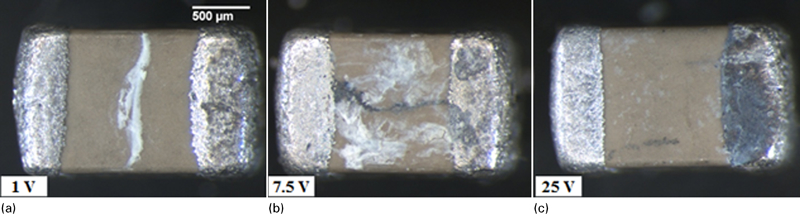
Appearance of chip capacitors after ECM testing at 1·56 μg cm−2 of NaCl [applied voltages are listed in images (anode: right terminal, cathode: left terminal)]
An increase in electric field widens the precipitation of tin hydroxide, and also promotes the formation of dendrites (Fig. 10b). The increase in anode terminal corrosion and hydroxide precipitation is observed with increase of applied voltage in the range between 5-10 V. At very high voltages (Fig. 10c), the anode terminal severely corrodes, but some fragile dendrite formation together with precipitation of hydroxide can be observed. Although the heavily corroded anode is indicating high rate of tin dissolution, the precipitation of hydroxide is overtaking the dendrite formation. This can be attributed to the insufficient alkaline conditions near the cathode to sustain the hexahydroxostannate ions (Sn(OH)6)2−, which are then reduced at the cathode to form dendrites. As the potential bias increases due to the dissolution of large amounts of tin ions, the alkaline boundary for the formation of (Sn(OH)6)2− becomes unsustainable as reported by Minzari et al. 15 It is known that tin can be oxidized to state +2 or +4 and form stannic compounds or be passivated if the appropriate conditions are established. 25 If the stannous or stannic ions are formed, they will be rapidly hydrolysed as various tin hydroxides through intermediate species, where Sn(OH)4 is dominant.15,25,29 The tin hydroxides will move towards the cathode and will experience the pH change from acidic at the anode to alkaline at the cathode. 15 The pH change to neutral area would tend to precipitate the hydroxides and this would initially reduce the migration unless the hydroxides are converted to ionic species that can be driven further towards cathode. The tin hydroxides close to cathode will experience alkaline environment and this will enable the formation of (Sn(OH)6)2−. The latter will be reduced and the tin ions will be deposited at the cathode. 15
Probability analysis of electrochemical migration results
The level and the type of ionic contamination are affecting the probability of electrochemical migration events and also the time to initiation. Figure 11 shows the cumulative per cent of migration versus time graphs for NaCl and solder flux residues.
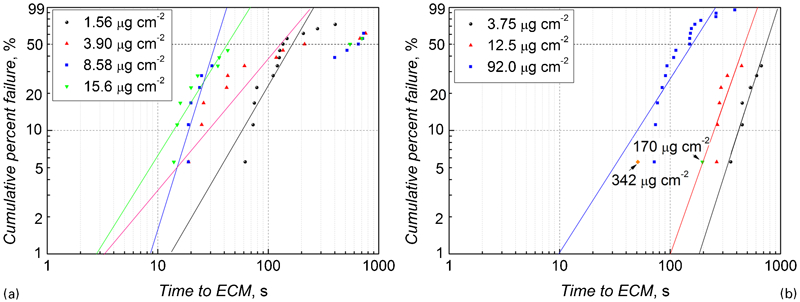
Cumulative failure dependence on time calculated from results of ECM: a NaCl and b solder flux residues
The increasing concentration in general shortens the time to a migration event (Fig. 11). This can be seen from a comparison of the time needed for 50% of capacitors to show ECM as well as from the time to the first failure. In the case of NaCl, increase in concentration from 1·56 to 15·6 μg cm−2 reduces the time to first failure accordingly: 62, 25, 19 and 14 s. The presence of flux residues reduces the time to first ECM from 354 to 72 s with increase of concentration from 3·75 to 92 μg cm−2.
Overall, a decrease in time to failure and to some extent an increase in cumulative per cent failure with increasing level of contamination can be observed. However, there is a certain contamination limit below which the migration event probability is very low. This empirically ascertained limit for NaCl lies in the range 0·858-1·56 μg cm−2, whereas for no-clean solder flux residues investigated in this work, the limit is broader where it starts with 3·75 μg cm−2 with significantly low probability until it peaks around 92 μg cm−2. The main difference between these two contaminants is the ECM behaviour at high concentrations, where for the flux residues it reduces drastically and no dendrites are formed, however in case of NaCl the 20-40% probability for migration remains.
Conclusions
Results show that the solvent extract test used for indexing contamination on PCBs needs to be carefully interpreted as it does not represents the actual leakage current on the board due to expected polarisation effects under DC bias. Current values obtained from solution conductivity measurement are higher compared to leakage currents measured through the solution using DC bias.
The level of organic acid flux residue equivalent to the IPC standard level of 1·56 μg cm−2 NaCl depends on whether the measurement is based on conductivity or leakage current through the solution. Quantitatively the equivalent conductivity is about 3-5 times higher than 1·56 μg cm−2, while for leakage current equivalent it is approximately 50 times higher than for NaCl. The difference is due to electrode polarization effects during leakage current measurements.
The electrochemical migration probability distributions for NaCl and flux residue electrolytes have peak values corresponding to 72 and 94% showing migration. For NaCl, the migration probability tends to decrease with increase in concentration above the peak value; however, some level of migration probability remains. For solder flux residues an abrupt decrease of migration probability was observed above the peak value.
The influence of electric field on migration probability shows a similar type of dependency as for concentration (Gaussian character distribution). The peak values of migration probability at 1·56 and 15·6 μg cm−2 of NaCl were observed at electric fields of 7·5 and 10 mV μm−1. The dendrite current shows a tendency to increase with increasing concentration of NaCl.