
Abstract
Zinc ribbon has been widely used for alternating current (ac) mitigation of pipeline. However, little is known about corrosion of zinc under ac. In this work, the corrosions of zinc under various ac in two scenarios, i.e. with or without direct current (dc) decoupler, were investigated in 4 g L− 1 Na2SO4 simulated backfill solution by weight loss tests, low angle X-ray diffraction measurements and electrochemical measurements. It was found that ac accelerated corrosion of zinc dramatically in both scenarios, and it is worth noting that dc density between zinc and pipeline steel increased with ac in the scenario without dc decoupler. Consequently, corrosion rate of zinc was much larger than that in the scenario in which dc decoupler was used. Besides, the charge transfer resistance of zinc decreased considerably due to ac in both scenarios, which would largely increase corrosion rate.
Introduction
The concept of utility corridors have increased the number of buried pipelines parallel to or sharing the corridor with high voltage ac transmission lines and ac electrified railways. This combination deteriorates ac interference on pipelines from high voltage transmission lines and/or from electric supplying systems.1–4 Alternating current interference can be dangerous to people touching the pipelines or structures electrically connected to the interfered pipeline and can accelerate ac corrosion of pipelines.5–8 As a consequence, more and more attentions have been focused on ac mitigation of pipelines.
Lots of work have been carried out to investigate ac mitigation of buried pipelines in recent years, and several ac mitigation methods have been proposed. Southey et al. studied the effects of the length of parallelism, separation distance and soil resistivity on ac mitigation and adopted mitigation wire (zinc ribbon) to reduce ac interference.9,10 Dabkowski mitigated ac interference on a gas pipeline by optimising the route of pipeline. 11 Floyd reduced such ac interference by installing zinc grounding cells at selected locations. However, the most effective ac mitigation method is installing mitigation wire (zinc ribbon) along the interfered pipeline. 12 Zinc ribbon can be installed in two ways. The first way is electrically connected to pipeline directly, and the second one is to install a dc decoupler between zinc ribbon and pipeline. A dc decoupler has a very high dc impedance and a very low ac impedance. Therefore, it allows the flow of ac but rejects that of dc.
The reported works carried out to investigate the effect of ac on corrosion of pipeline steel have concluded that pipelines corrode at an accelerated corrosion rate under ac interference.13–19 The present studies on corrosion of zinc are mainly concentrated on the pitting corrosion of zinc20,21 and the effects of aggressive anions (Cl− , Br− , I− ,  ,
,  and S2 − ),22,23 cations (Mg2+, Ca2+ and Na+),
24
acid gas (CO2 and SO2)
25
and the passive film26–29 on corrosion of zinc. Several works30–32 were conducted to investigate the coupling corrosion of zinc and carbon steel. However, all of them are focused on the corrosion of zinc without ac. Effects of ac on corrosion of zinc ribbon is still not well understood, which brings difficulty to the reasonable design of zinc mitigation wire. Therefore, it is a necessity to study corrosion of zinc under ac. To achieve this, weight loss tests on zinc samples under various ac in two scenarios, i.e. with or without dc decoupler, were conducted in a simulated backfill solution. Electrochemical measurements were applied to study the mechanism of ac affecting corrosion of zinc.
and S2 − ),22,23 cations (Mg2+, Ca2+ and Na+),
24
acid gas (CO2 and SO2)
25
and the passive film26–29 on corrosion of zinc. Several works30–32 were conducted to investigate the coupling corrosion of zinc and carbon steel. However, all of them are focused on the corrosion of zinc without ac. Effects of ac on corrosion of zinc ribbon is still not well understood, which brings difficulty to the reasonable design of zinc mitigation wire. Therefore, it is a necessity to study corrosion of zinc under ac. To achieve this, weight loss tests on zinc samples under various ac in two scenarios, i.e. with or without dc decoupler, were conducted in a simulated backfill solution. Electrochemical measurements were applied to study the mechanism of ac affecting corrosion of zinc.
Experimental
Electrodes and solution
The zinc employed in this work was fabricated from a zinc ribbon anode, which was used for ac mitigation of pipelines in North China. The chemical composition of zinc is as follow (wt-%): 1·39Al, 0·013Cd, ≤ 0·01Fe, ≤ 0·01Cu, ≤ 0·01Pb and zinc balanced. Q235 steel was adopted for simulating pipeline. It was fabricated from a sheet of Q235 pipeline steel with the following chemical composition (wt-%): Fe–0·42Mn–0·16C–0·1Si–0·39S–0·24P. All specimens were manufactured into 10 × 10 × 7 mm cubes and were welded with Cu wire for electric connection. After that, they were embedded in epoxy resin, leaving a working area of 10 × 10 mm. The working surfaces of specimens were subsequently ground with 360, 600 and 800 grit emery papers and cleaned in deionised water and acetone.
A solution of 4 g L− 1 Na2SO4 was adopted as the test solution to simulate the backfill around zinc ribbon. The solution was made from analytic grade reagents and deionised water (18 MΩ cm in resistivity), with pH 7·1 and resistivity of 1·98 Ω m. All the tests were conducted at the temperature of 20°C and open to air.
Weight loss tests
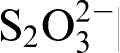
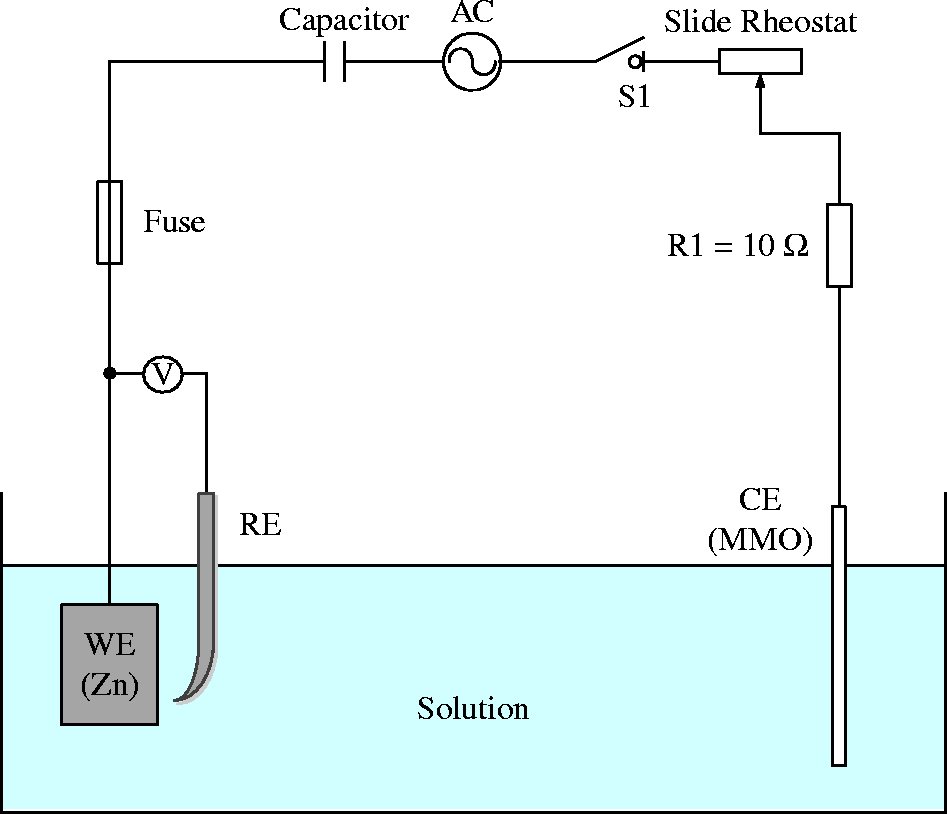
Two scenarios, i.e. with or without dc decoupler, were considered. In scenario 1, with dc decoupler, the experimental set-up in Fig. 1 is adopted to conduct weight loss tests with zinc as the working electrode (WE), mixed metal oxide as the counter electrode (CE). In scenario 2, without dc decoupler, the experimental set-up in Fig. 2 is adopted to conduct weight loss tests, in which zinc was adopted as the WE and Q235 steel was used as the CE. Weight loss tests were carried out for 7 days in both scenarios, with the various ac densities applied between WE and CE. The adopted ac is sine wave shaped, with a standard frequency of 50 Hz in China. Alternating current density was calculated by dividing the root mean square value of ac voltage of resistor R1 (10 Ω, 25 W) with its resistance and the working area of WE. A slide rheostat (10 kΩ, 2 W) was applied to adjust ac density to the preset value. The capacitor (50 V, 1000 μF) in scenario 1 was used to simulate the dc decoupler, while the capacitor (50 V, 1000 μF) in scenario 2 was adopted to protect ac resource from dc interference.
Schematic diagram of experiment set-up in scenario 1: with dc decoupler
Schematic diagram of experiment set-up in scenario 2: without dc decoupler
After the test, the corrosion products deposited on zinc surface were removed by a 10 min bath in a descaling solution of 500 mL deionised water+500 mL HCl+3·5 g hexamethylene tetramine.
33
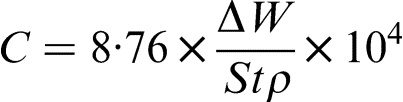
The cleaning process was repeated several times to make sure that the corrosion products have been removed thoroughly. Subsequently, weight losses of zinc were determined by an electronic balance with an accuracy of 0·1 mg. Corrosion rate C was calculated by expression (1)
33
Electrochemical impedance spectroscopy (EIS) measurements
Electrochemical impedance spectroscopy measurements of zinc electrodes after being exposed to various ac, i.e. 0, 50, 100, 200 and 300 A m− 2, for 7 days were conducted in both scenarios. Electrochemical impedance spectroscopy measurements were performed at open circuit potential (OCP), and the variations of zinc potential were < 5 mV in each test. A traditional three-electrode system was adopted, with zinc as the WE, Pt sheet as the CE and saturated calomel electrode (SCE) as the reference electrode (RE). The testing frequency was 0·01 Hz to 100 kHz. Amplitude of the sinusoidal potential signal was 10 mV with respect to OCP.
Potentiodynamic polarisation measurements
A three-electrode system was adopted to conduct the potentiodynamic polarisation measurements of zinc and Q235 steel in 4 g L− 1 Na2SO4 simulated backfill solution, with zinc (or Q235) steel as the WE, Pt sheet as the CE and SCE as the RE. The scan rate was 0·5 mV s− 1.
Direct current potential and dc density measurements
Direct current potential of zinc under various ac in scenario 1 was measured, while dc potentials of zinc and Q235 steel and dc density between zinc and Q235 steel in scenario 2 were measured. The experimental set-up for dc potential and dc density measurements was identical to that used in weight loss tests. Direct current potential measurement was conducted using a FLUCK 289C true root mean square voltmeter with SCE as the RE. To minimise the IR drop, RE was located at < 1 mm away from the surface of metal. The dc density between zinc and Q235 steel was calculated by dividing dc voltage of R2 with its resistance and the working area of zinc. The applied ac density was the same as that in weight loss tests. Direct current potential and dc density measurements lasted for 7 days.
Results and discussion
Weight loss tests
Figure 3 reported the corrosion rate determined by weight loss tests of zinc after being exposed to various ac for 7 days in both scenarios. It is obvious that ac significantly accelerated corrosion of zinc. For scenario 1, a dc decoupler was installed between zinc ribbon and pipeline; corrosion rate of zinc was relatively low, i.e. 0·14 mm/year, in the absence of ac. However, it increased to 0·58 mm/year at ac density of 50 A m− 2. When the applied ac density increased to 100 A m− 2, corrosion rate went up to 0·73 mm/year, four times higher than that without ac. Upon ac density of 300 A m− 2, it arrived at 0·83 mm/year. Similarly, corrosion rate of zinc in scenario 2 increased from 0·77 to 6·75 mm/year when the applied ac density increased from 0 to 300 A m− 2.
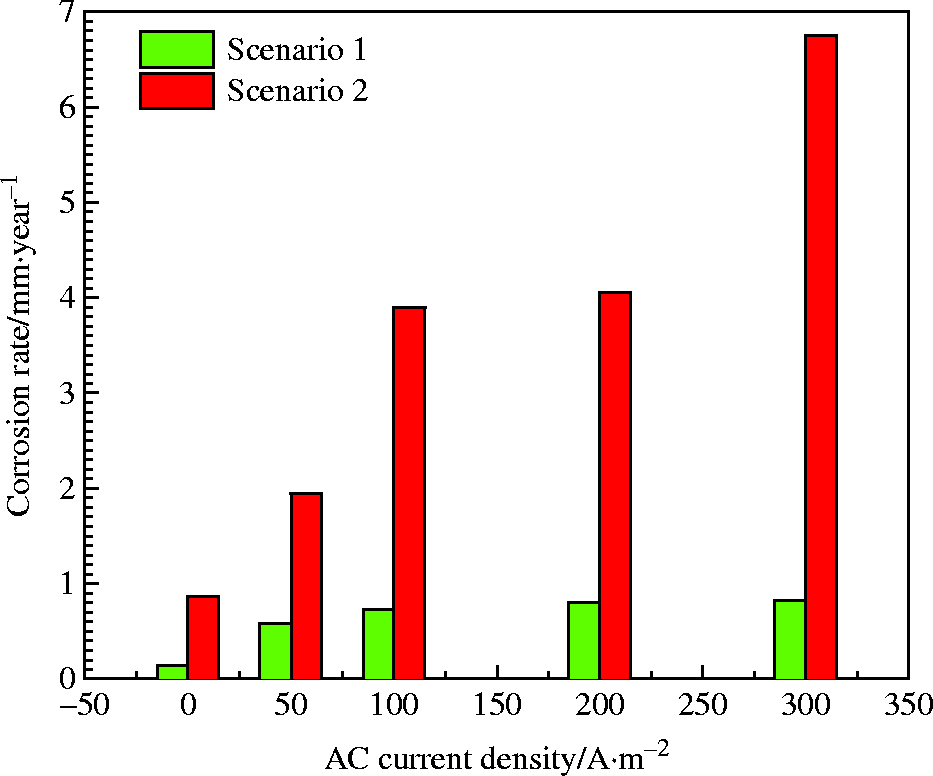
Corrosion rate determined by weight loss tests of zinc after being exposed to various ac for 7 days in both scenarios
Moreover, it is worth noting that corrosion rate of zinc in scenario 2 was much higher than that in scenario 1 under different ac. When no ac was applied, corrosion rate was 0·77 mm/year in scenario 2, which was five times of that in scenario 1. Under ac density of 50 A m− 2, corrosion rate in scenario 2 increased to 1·95 mm/year, which was much larger than that in scenario 1, i.e. 0·58 mm/year. Upon ac density of 200 A m− 2, corrosion rate in scenario 2 arrived at 4·05 mm/year, while the corrosion rate in scenario 1 was much lower, i.e. 0·80 mm/year. When the applied ac density reached 300 A m− 2, the corrosion rate in scenario 2 was six times higher than that in scenario 1.
The results above indicated that ac accelerated corrosion of zinc mitigation wire considerably no matter whether dc decoupler was adopted or not. What is noteworthy is that more attentions should be paid when there is no dc decoupler installed between zinc mitigation wire and pipeline.
Electrochemical impedance spectroscopy measurements
Researches on ac corrosion of carbon steel indicated that the surface condition of carbon steel was very important to ac corrosion.14,34–36 Therefore, EIS measurements of zinc after being exposed to various ac for 7 days in both scenarios were performed. Figure 4 provides the EIS measurements results in scenario 1. Nyquist diagram of zinc without ac was characteristic of a capacitive loop in high frequency range, caused by the film effect, and a capacitive loop in low frequency range, induced by the charge transfer reaction. When ac was applied to system, the capacitive loop in the low frequency range was replaced by a straight line and only one capacitive loop, caused by charge transfer reaction, appeared in the high frequency range, as shown in Fig. 7b, indicating that no corrosion products film deposited on zinc surface in the presence of ac and the corrosion was controlled by the mass transfer step. Figure 5 shows the related result in scenario 2, which was similar to that in scenario 1.
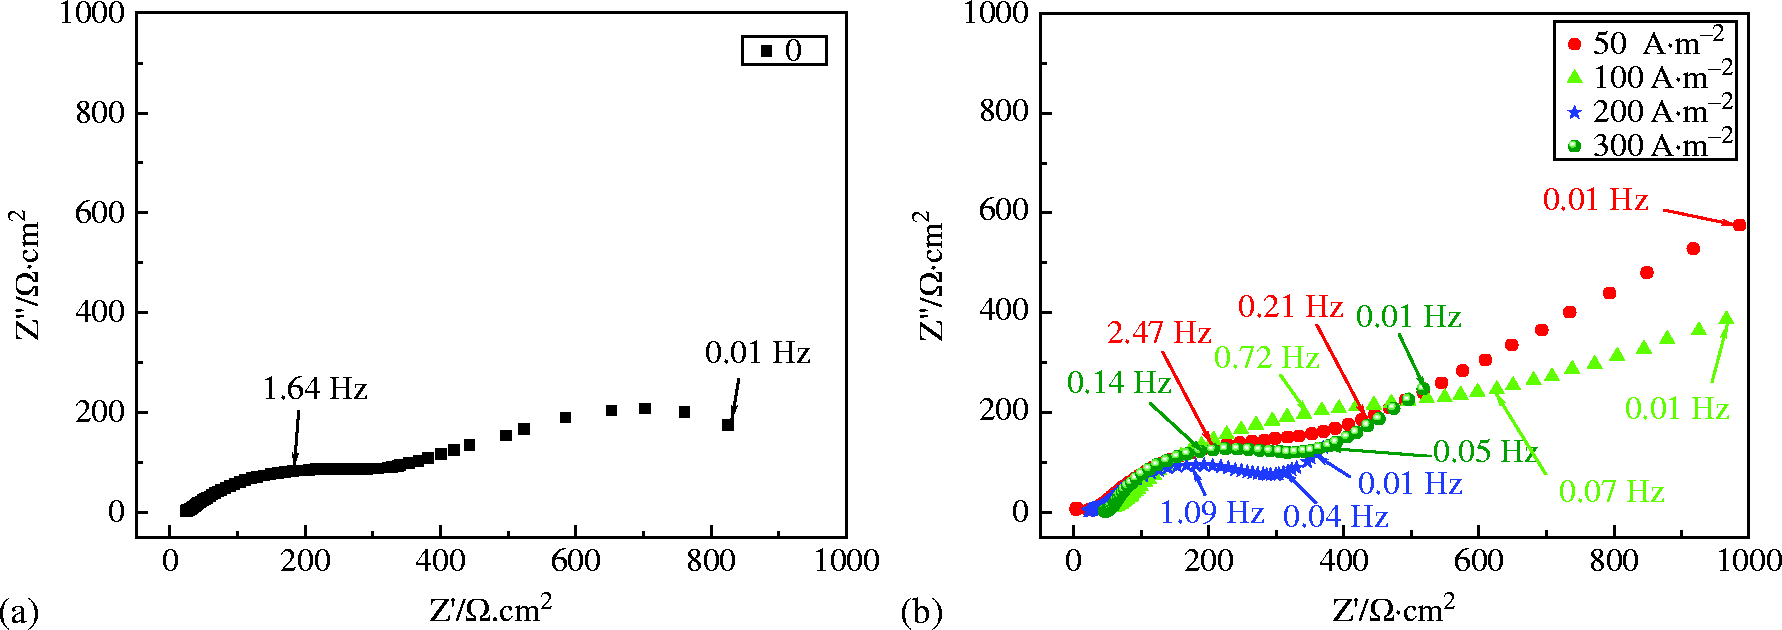
a i ac = 0; b i ac = 50-300 A m− 2
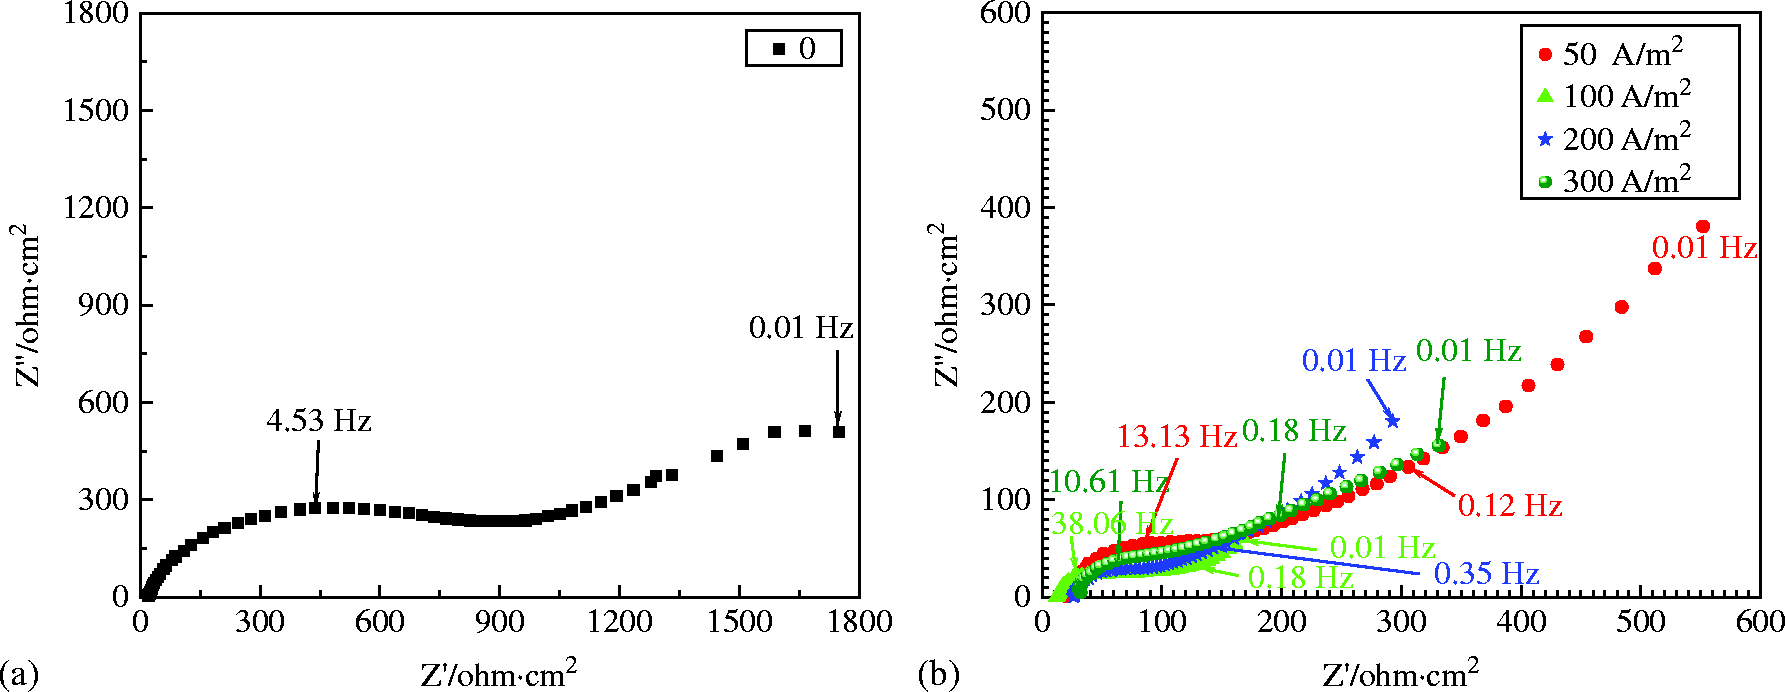
a i ac = 0; b i ac = 50-300 A m− 2
It is worth noting that the capacitive loops in the high frequency range with ac degenerated obviously compared to that in the low frequency range without ac in both scenarios. In other words, ac would decrease the charge transfer resistance of zinc. As a consequence, the Faraday process of zinc in expression (2) was accelerated, resulting in the increase in zinc dissolution, given in Fig. 3
Potentiodynamic polarisation measurements
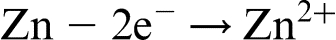
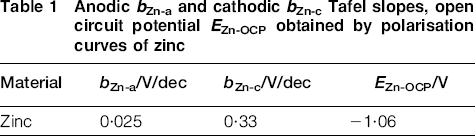
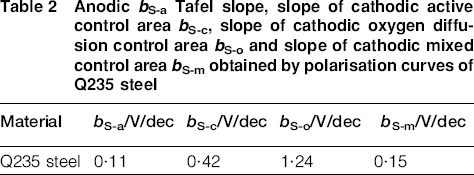
Figure 6 presented potentiodynamic polarisation curves of zinc and Q235 steel in 4 g L− 1 Na2SO4 simulated backfill solution. It was obvious from Fig. 6a that no passivation was observed in the anodic polarisation of zinc. Table 1 showed the calculated anodic b Zn-a and cathodic b Zn-c Tafel slopes and OCP E Zn-OCP of zinc. Cathodic Tafel slope of zinc was much higher than the anodic Tafel slope. Cathodic polarisation of Q235 steel could be divided into three areas: cathodic active control area, cathodic oxygen diffusion control area and cathodic mixed control area, as shown in Fig. 6b. The slopes of these three areas were different from each other. It could be informed from Table 2 that anodic b S-a Tafel slope of Q235 steel was 0·11 V/dec, which was much lower than the slope of active control area (b S-c = 0·42 V/dec), the slope of cathodic oxygen diffusion control area (b S-o = 1·24 V/dec), as well as the slope of mixed control area (b S-m = 0·15 V/dec).
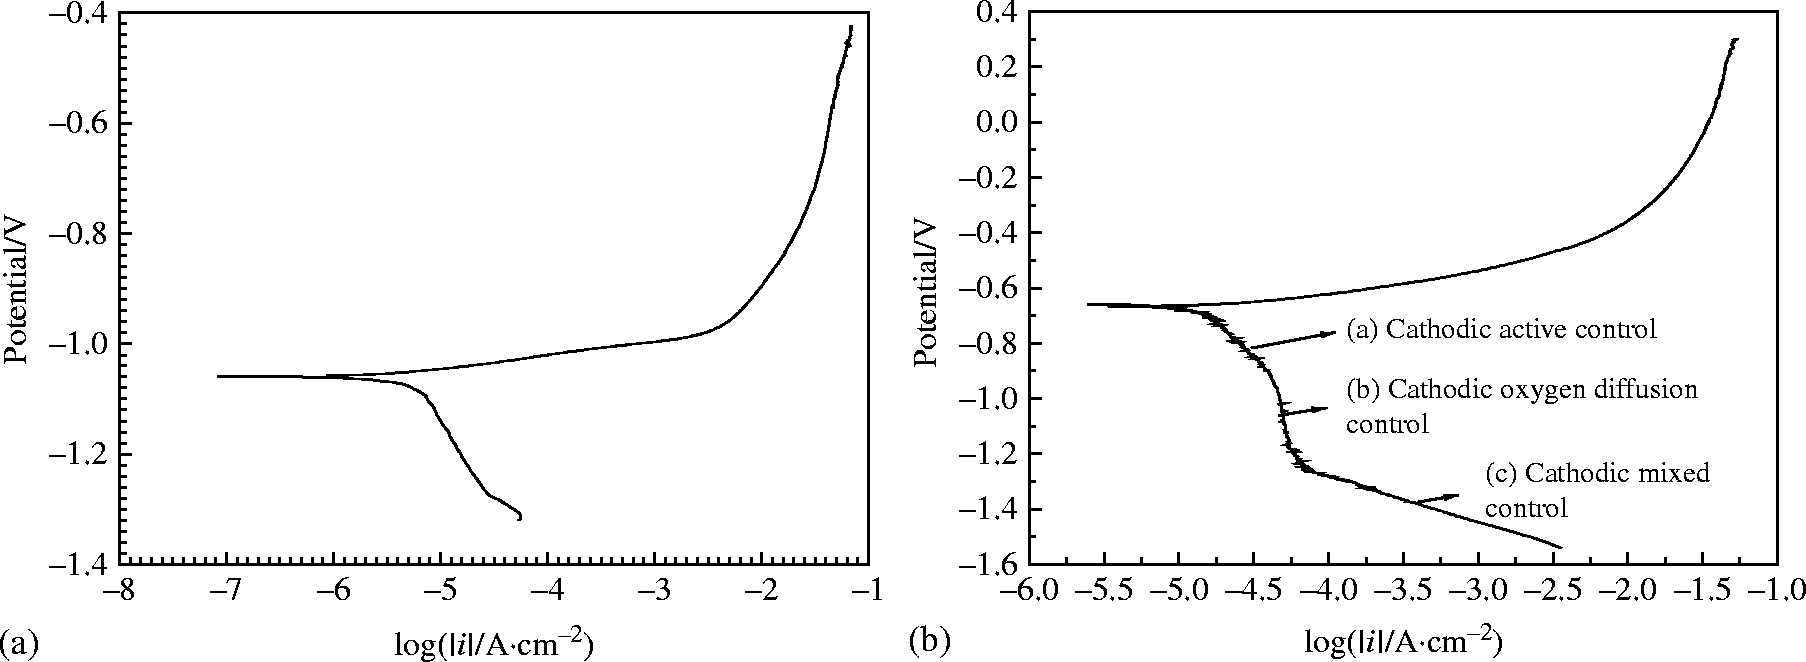
a zinc; b Q235 steel
Anodic b Zn-a and cathodic b Zn-c Tafel slopes, open circuit potential E Zn-OCP obtained by polarisation curves of zinc
Anodic b S-a Tafel slope, slope of cathodic active control area b S-c, slope of cathodic oxygen diffusion control area b S-o and slope of cathodic mixed control area b S-m obtained by polarisation curves of Q235 steel
Direct current potential and dc density measurements
Figure 7 shows dc potential of zinc under various ac in scenario 1. Direct current potential of zinc was − 1·06 V before ac. Direct current potential shifted negatively when ac was applied to the system. It was − 1·14 V at ac density of 50 A m− 2. When ac density increased to 100 A m− 2, dc potential declined to 1·16 V. Direct current potential of zinc reached − 1·19 and − 1·21 V respectively when ac density increased to 200 and 300 A m− 2. After that, dc potential of zinc shift positively to a steady state value. Reported works37–40 on ac corrosion of carbon steel indicated that ac could cause the shift of dc potential of carbon steel away from the value before ac, and the shift direction was decided by the ratio (k = b c/b a) of cathodic b c and anodic b a Tafel slope of carbon steel: if k>1, dc potential shifted negatively; if k < 1, dc potential shifted positively; and if k = 1, dc potential remained unchanged. It can be informed from Table 1 that the cathodic (b Zn-c = 0·33 V/dec) Tafel slope of zinc was much larger the anodic Tafel slope (b Zn-a = 0. 025 V/dec), k = 13·20>1. Therefore, dc potential of zinc shifted negatively in the presence of ac.
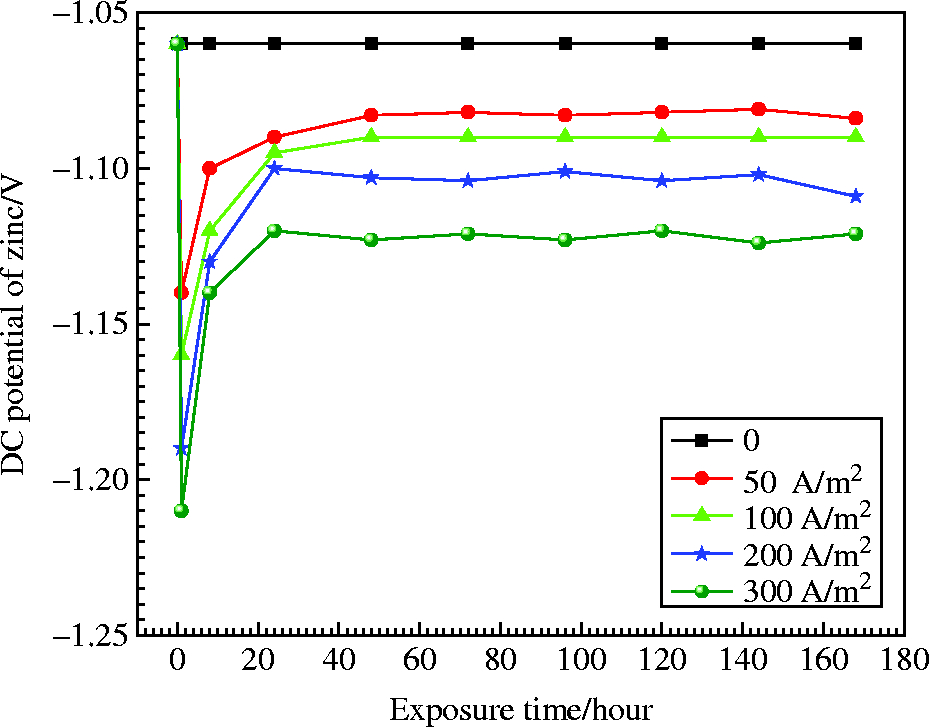
Records on dc potential of zinc under various ac in scenario 1
Weight loss tests results showed that corrosion rate of zinc in scenario 2 is much higher than that in scenario 1. To better understand its mechanism, dc potentials of zinc and Q235 steel and dc density between zinc and Q235 steel in scenario 2 were measured. Figure 8 shows records on dc potential of zinc under various ac in scenario 2. Before ac was imposed, dc potential of zinc was about − 1·05 V when it was electrically connected to Q235 steel. When ac was imposed to the system, dc potential shifted negatively, and the offset increased with ac density. It shifted to − 1·073 V at ac density of 50 A m− 2. Upon ac density of 100 A m− 2, dc potential reached − 1·096 V. When the applied ac density increased to 200 and 300 A m− 2, dc potential dropped to − 1·105 and − 1·108 V respectively. After 24 h of exposure, dc potential shifted positively to reach a steady state value, and the steady state value reduced as ac density increased. It was about − 1·058 V at ac density of 50 A m− 2. When the applied ac density increased to 100, 200 and 300 A m− 2, the steady state values were − 1·063, − 1·066 and − 1·076 V respectively.
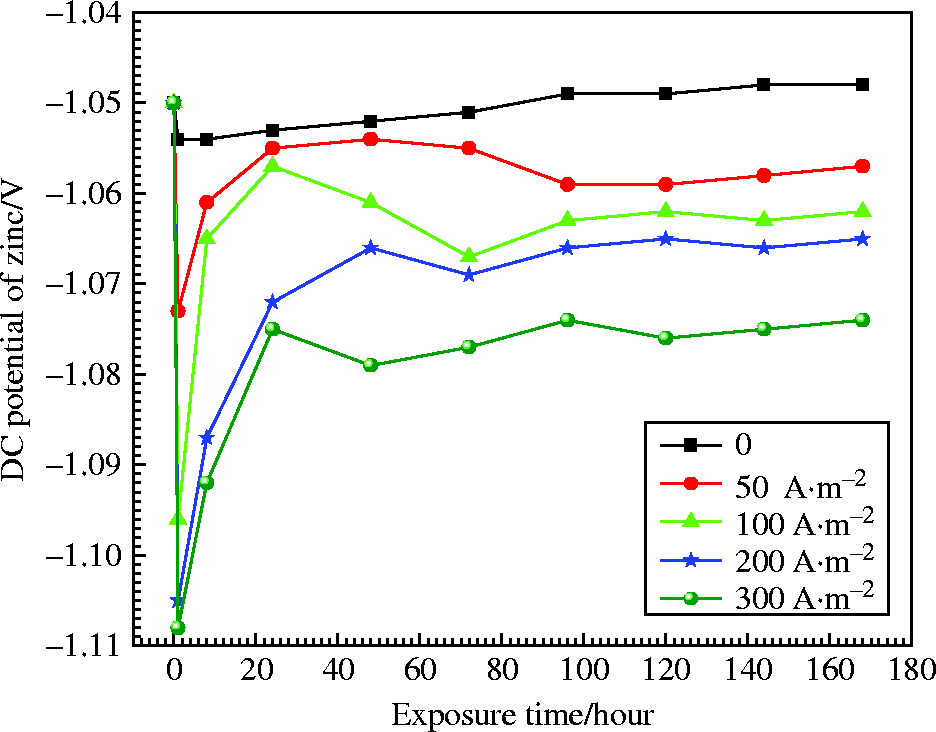
Records on dc potential of zinc under various ac in scenario 2
Records on dc potential of Q235 steel under various ac are given in Fig. 9. Before ac was imposed, the dc potential of Q235 steel was about − 1·04 V when it was electrically connected to zinc. When ac was applied at 1 h, the dc potential of Q235 steel, however, shifted positively, and the offset increased with ac density. After 72 h of exposure, the dc potential of Q235 steel shifted gradually to a steady state value, and the steady state value increased with ac density. It was − 1·033 V at ac density of 50 A m− 2. When ac density increased to 100 A m− 2, the dc potential of Q235 steel climbed to − 1·016 V. When ac density increased to 200 and 300 A m− 2, it reached − 0·985 and − 0·916 V respectively.
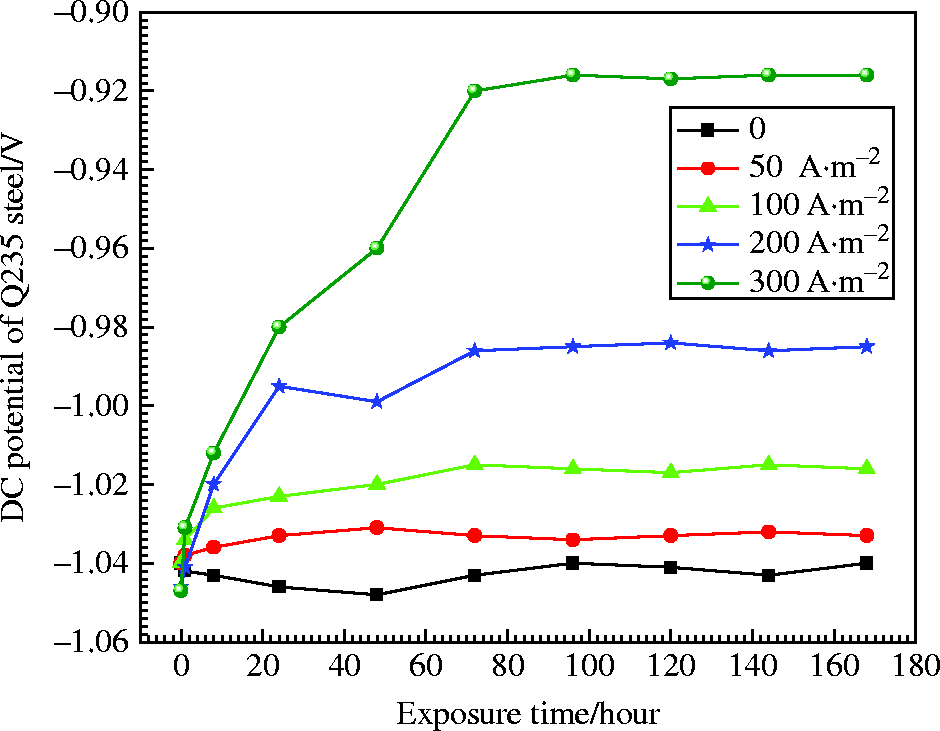
Records on dc potential of Q235 steel under various ac in scenario 2
As have been mentioned above, effect of ac on dc potential of carbon steel has attracted much attention, and a mechanism had been proposed. However, it was worth noting that the mechanism was only effective in the case of no coupling. In scenario 2, zinc was coupling with Q235 steel. Effect of ac on the dc potential of zinc coupling with carbon steel, i.e. Q235 steel, remained uninvestigated.
It is well known that zinc experienced an anodic polarisation, while Q235 steel experienced a cathodic polarisation when zinc was coupling with Q235 steel in the case of no ac. The dc potential of zinc was E Zn-0 and that of Q235 steel was E S-0 before ac, as shown by the dotted black line in Figs. 10 and 11 respectively. The dc density between zinc and Q235 steel was 0·47 A m− 2, as shown in Fig. 12. When ac was imposed to the system, zinc periodically experienced anodic and cathodic polarisation. As a consequence, dc potential of zinc fluctuated around E Zn-0, as shown by the solid red line in Fig. 10. Since E Zn-0( = − 1·05 V) was so close to the OCP of zinc (E Zn-OCP = − 1·06 V), dc potential of zinc fluctuated between anodic and cathodic Tafel areas of zinc. Owing to the much higher cathodic Tafel slope, compared to the anodic Tafel slope, the negative shift of dc potential of zinc in the cathodic ac cycle was much larger than the positive shift in the anodic ac cycle. Consequently, the dc potential of zinc shift negatively to E Zn-f, as shown by the dotted red line in Fig. 10.
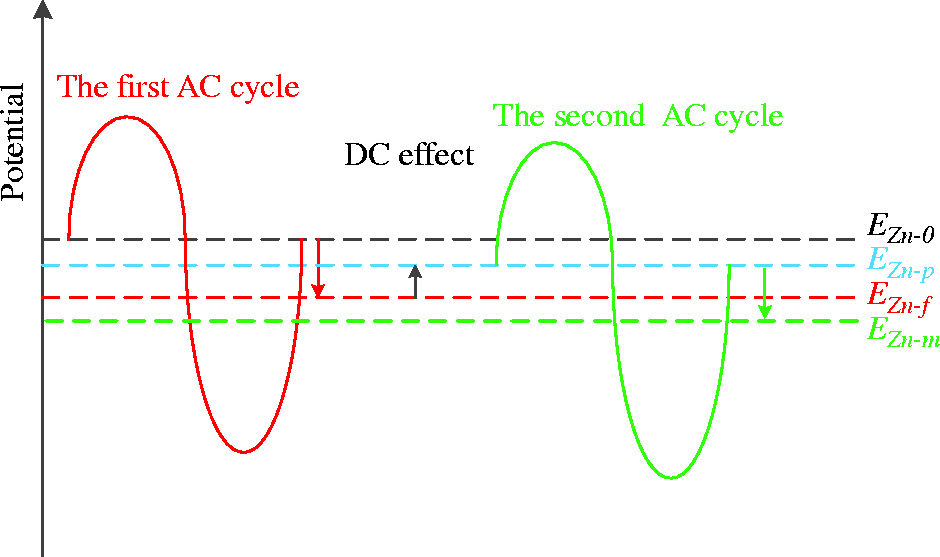
Effect of ac on dc potential of zinc in scenario 2: E Zn-0 was dc potential of zinc before ac; E Zn-f was dc potential of zinc after first ac cycle; E Zn-p was dc potential of zinc after anodic polarisation caused by increased dc current; E Zn-m was dc potential of zinc after second ac cycle
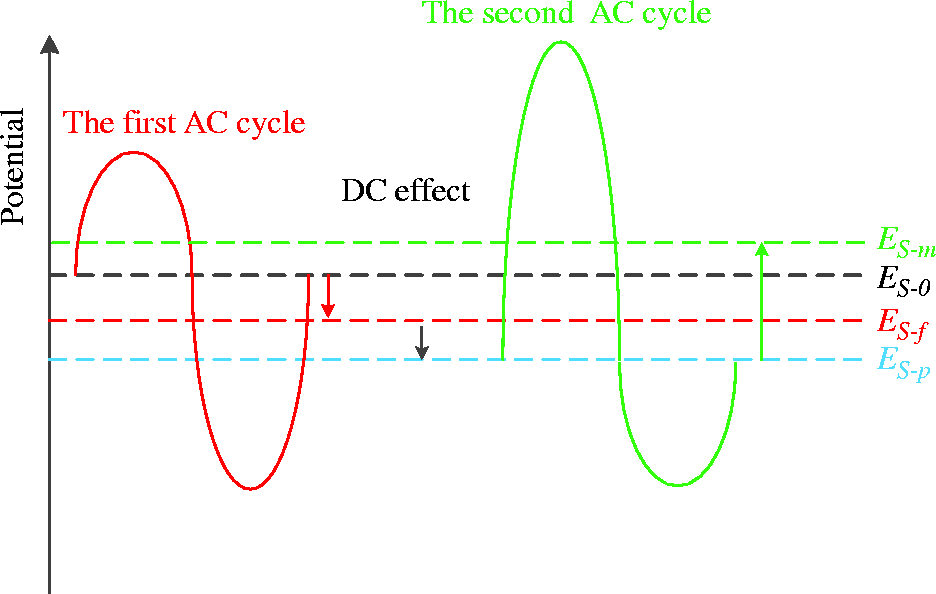
Effect of ac on dc potential of Q235 steel in scenario 2: E S-0 was dc potential of Q235 steel before ac; E S-f was dc potential of zinc after first ac cycle; E S-p was dc potential of zinc after cathodic polarisation caused by increased dc current; E S-m was dc potential of zinc after second ac cycle
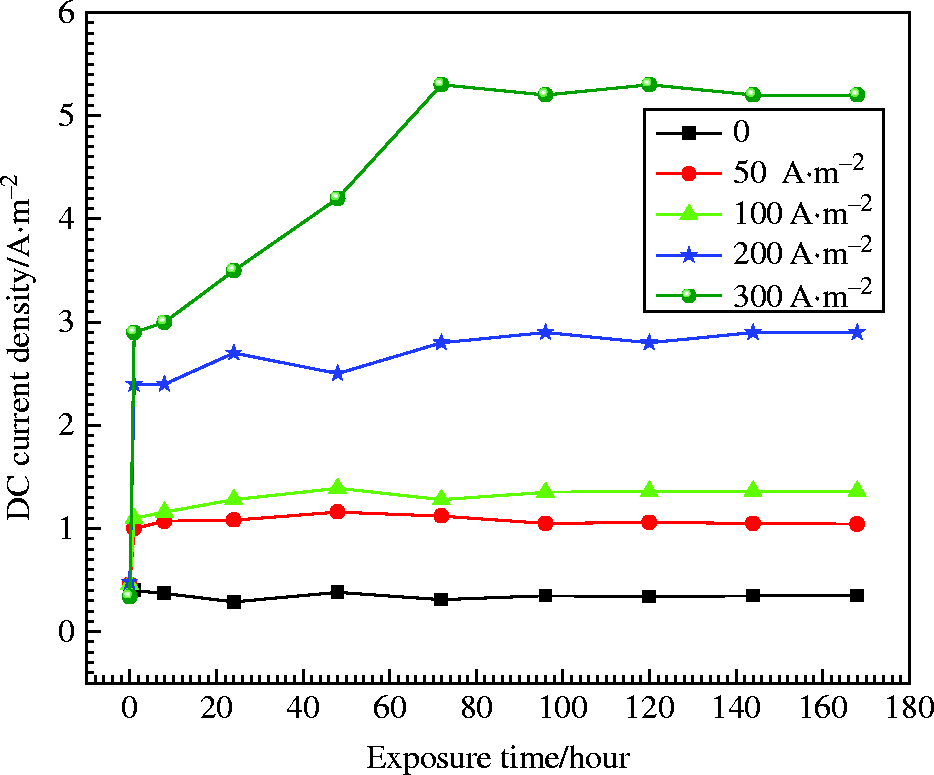
Records on dc density between zinc and Q235 steel under various ac in scenario 2
At the same time, dc potential of Q235 steel fluctuated around E S-0, as shown by the solid red line in Fig. 11. Since E S-0( = − 1·04 V) was located between the cathodic active control area and cathodic oxygen diffusion control area of the polarisation of Q235 steel, the dc potential of Q235 steel fluctuated between the cathodic active control area and cathodic oxygen diffusion control area. It could be informed from Table 2 that the slope (b S-o = 1·24 V/dec) of the cathodic oxygen diffusion control was larger than that (b S-c = 0·42 V/dec) of the active control area. Therefore, the negative shift of the dc potential of Q235 steel in the cathodic ac cycle was larger than the positive shift in the anodic ac cycle. The dc potential of Q235 steel shifted negatively to E S-f, as shown by the solid red line in Fig. 11.
However, it should be mentioned that the ratio (k Zn = b Zn-c/b Zn-a = 13·20) of cathodic b Zn-c and anodic b Zn-a Tafel slope of zinc was much larger than the ratio (k S-oc = b S-o/b S-c = 2·95) of Q235 steel; hence, the negative shift of dc potential of zinc was much larger than that of the Q235 steel. As a result, the dc potential difference (ΔE = E Q235 − E Zn) between zinc and Q235 steel increased, as shown by Fig. 13. The increased dc potential difference led to the increased dc density between zinc and Q235 steel, resulting in an anodic polarisation to zinc while a cathodic polarisation to Q235 steel. Therefore, dc potential of zinc shifted positive to E Zn-p, as shown by the dotted blue line in Fig. 10. The dc potential of Q235 steel shifted negatively to E S-p, as shown by the dotted blue line in Fig. 11.
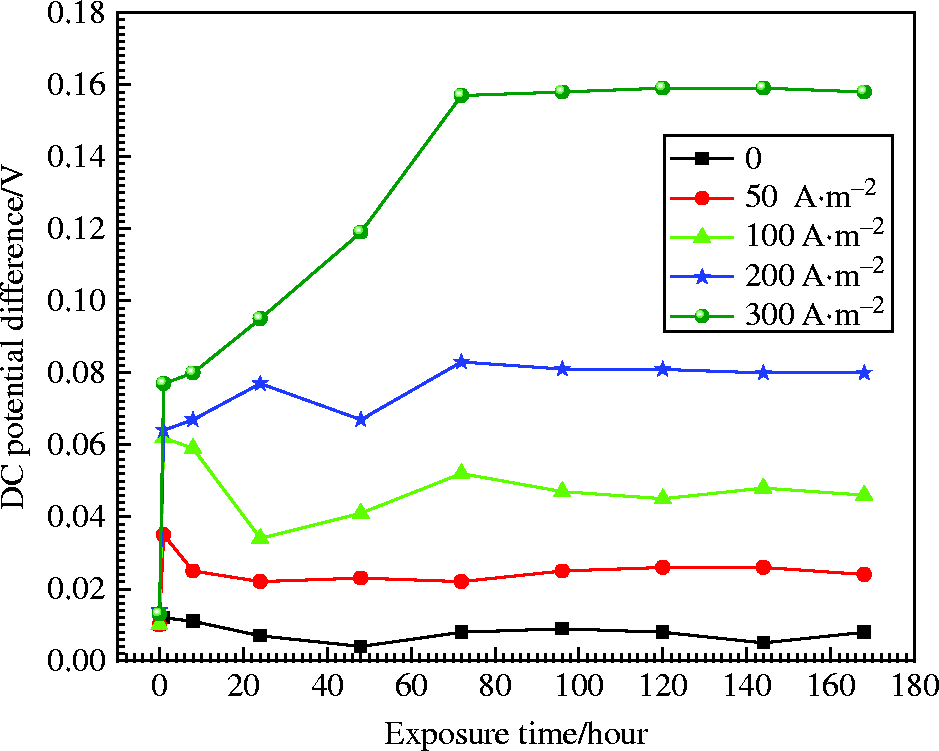
Direct current potential difference between zinc and Q235 steel under various ac in scenario 2
During the next ac cycle, dc potential of zinc fluctuated between anodic and cathodic Tafel slope, which resulted in a further negative shift of dc potential of zinc to E Zn-m. Therefore, the measured dc potential of zinc shifted positively when ac was applied in scenario 2. Similarly, since E S-p was located between the cathodic oxygen diffusion control area and cathodic mixed control area, the dc potential of Q235 steel fluctuated between the cathodic oxygen diffusion control area and cathodic mixed control area during the next ac cycle. Slope (b S-o = 1·24 V/dec) of the cathodic oxygen diffusion control area was much larger than that (b S-m = 0·15 V/dec) of the cathodic mixed control area; the dc potential of Q235 steel shifted positive to E S-m, as shown by Fig. 11. The ratio (k S-om = b S-o/b S-m = 8·27) of the slope of cathodic oxygen diffusion control area and that of cathodic mixed control area was much larger than k S-oc ( = b S-o/b S-c = 2·95). Hence, the positive shift caused by the second ac cycle was much larger than the negative shift caused by the first ac cycle and by the increased dc. The measured dc potential of Q235 (E S-m) shifted positively.
It is obvious from Fig. 13 that dc potential difference between zinc and Q235 steel increased with ac. As a consequence, the dc density between zinc and Q235 steel increased with ac as well, as shown in Fig. 12. It should be noted that the dc density between zinc and Q235 steel was positive throughout the experiments, indicating that dc leave away from the surface of zinc in the solution, which would result in the dissolution of zinc through the Faraday process. Owing to increased dc density caused by ac, an extra weight loss of zinc would occur compared to that in scenario 1, and it increased with ac density. As a consequence, corrosion rate of zinc in scenario 2 was much higher than that in scenario 1.
Conclusions
Based on researches above, the following conclusions were obtained.
Alternating current would accelerate corrosion of zinc ribbon in the scenarios with or without dc decoupler, and corrosion rate increased considerably with ac density. Owing to the effect of ac on the dc potential of zinc and pipeline steel, the dc density between zinc and pipeline steel without dc decoupler increased with ac. As a consequence, corrosion rate of zinc ribbon was much higher. Therefore, more attentions should be paid to the corrosion of zinc ribbon if no dc decoupler was applied. Alternating current would change the double charge layer of zinc/solution interface in both scenarios, which was very important in accelerating corrosion of zinc. To study its mechanism, much work needs to be carried out to investigate the effect of ac on the structure of the double electric layer in the future.
Acknowledgements
This work was supported by the National Natural Science Foundation of China (grant no. 51101015) and Fundamental Research Funds for the Central Universities (grant no. FRF-TP-14-096A2).