
Abstract
Solidification cracking is a weld defect common to certain susceptible alloys rendering many of them unweldable. It forms and grows continuously behind a moving weld pool within the two phase mushy zone and involves a complex interaction between thermal, metallurgical and mechanical factors. Despite decades long efforts to investigate weld solidification cracking, there remains a significant lack of understanding regarding its underlying mechanisms. Criteria developed to evaluate alloy weldability will be examined in terms of proposed solidification cracking models. Crack initiation is discussed in terms of different criteria: critical stress to fracture the interdendritic liquid, critical strain to exceed the mushy zone ductility and critical hydrogen content to nucleate and grow a pore. Crack growth has been characterised in terms of a critical stress to fracture the liquid film surrounding a grain and critical strain rate interdependent with liquid feeding of the mushy zone opening. Experimental data to form a weld solidification crack are compiled, revealing the considerable amount of information available in the literature on this topic.
Introduction
The topic of solidification cracking as it applies to weldability has for many years been a highly contentious subject, particularly with regard to identifying its cause. Although significant effort has been devoted to characterise the relative weldability of different alloys, welding research has usually concentrated on specific aspects of this subject such as weldability testing (e.g. alloy ranking in terms of crack length measurement) or determining a critical temperature range, while ignoring the underlying cause of crack initiation and growth. Many models and criteria estimate a tendency for cracking, but do not predict whether a crack will occur. No comprehensive models for solidification cracking exist that explain all of the multifaceted aspects of this defect, thus leaving many deficiencies in our understanding. Further complicating the issue, the mechanisms involved may vary with alloy and solidification conditions.
Solidification cracking is complex in nature and involves interplay between thermal, mechanical and metallurgical components. 1 A crack originates and grows in the two phase mushy zone behind a moving weld pool in a condition of quasi-steady state. Fractographic studies conducted on weld solidification cracks in stainless steel 2–9 and aluminium alloy 10,11 welds reveal a lack of matching of the opposing crack surfaces and a smooth dendrite appearance. This suggests that cracking forms in the liquid phase that covers completely the grain boundaries. Based upon these observations, cracking is generally believed to result from the tensile fracture of liquid films at grain boundaries within the two phase mushy zone. 1
During the last century, a number of fundamental theories and criteria have been advanced to describe and characterise solidification crack formation, but none of these criteria is today universally accepted by the entire scientific community. Solidification cracking models are often developed first for casting and then applied to welding by adapting the models to the different boundary conditions during solidification. Such boundary conditions may include thermal gradients (100 K mm−1 for castings and 101 K mm−1 for welds), cooling rates (100–101 K s−1 for castings and 101–102 K s−1 for welds), solidification duration (101–102 s for castings and 100–101 s for welds) and primary dendrite arm spacing (102 μm for castings and 101 μm for welds). These orders of magnitudes given for cast and welded alloys illustrate the difference in scales between the two processes. Nevertheless, it is generally assumed that an alloy’s cracking susceptibility in a casting will follow the same behaviour in a weld, even though there are large differences in scale and boundary conditions. 12 It has generally been observed that alloys with longer feeding lengths across the mushy zone, larger temperature range of solidification and greater solidification shrinkage will have a greater cracking susceptibility.
Solidification cracking should be examined in terms of initiation and growth. Such a distinction is of importance since the mechanisms involved and conditions required to initiate a crack can differ from the ones to grow a crack. The initiation is associated to the formation of an initiation site, such as a defect, from which a crack may grow under specific conditions. The nature of the initiation site and the path of the growth are part of the interrogations that solidification cracking models must answer.
Important to solidification cracking models is the concept of coherency, which corresponds to the interconnection of dendrite arms, either mechanically (entanglement) or through atomic bonding, 13 and is accompanied by an increase in strength when undergoing solidification below the coherency temperature, 14 a unique property of the alloy and solidification conditions. This allows for the transmission of transverse stress, needed for the initiation and growth of a crack. Likewise the solid fraction interval over which coherency exists will determine the amount of solidification shrinkage experienced.
The presence of foreign material in the liquid such as oxide bifilms was proposed as necessary to initiate a solidification crack. 1 These bifilms will open as a pore under hydrostatic stresses and develop into a crack under uniaxial stress. It is clear that hydrostatic stress gives rise to a spherical shape, whereas a planar shape requires application of a non-symmetrical stress. Stresses and strains induced during welding can be related to the thermal expansion–contraction induced from the welding heat input and the weld metal solidification shrinkage. Measuring these strains and stresses behind the weld metal in the mushy zone is challenging, in particular because of the dynamic high temperature gradients involved. Nevertheless, such measurements are desirable to experimentally validate or reject hypothesised solidification cracking models.
Despite the large amount of literature on solidification cracking as indicated in recent reviews on the subject, 15–19 only limited work has been devoted to understanding the mechanisms for crack initiation and growth. The goal of this review is to provide a perspective on evaluating the weld metal cracking behaviour. As it is beyond the scope of this article to address weldability testing devices, only solidification cracking models will be reviewed. This review is presented in four sections: crack initiation; liquid fracture; crack growth; and stress and strain around moving weld pool.
Crack initiation models
Critical stress
Stress based models assume solidification cracking to form in a semisolid material when the local tensile stress exceeds the material strength (e.g. bonding between cojoined dendrites). One of the first solidification cracking models was proposed in the 1920s and related the cracking sensitivity of a semisolid material to its fracture strength: 20,21 the faster the rise in strength (dendrite bonding) with falling temperature, the lower the susceptibility to cracking. Later, experimental observations 22,23 and numerical simulations 4 of the stress cells surrounding the mushy zone during welding suggest that tensile stresses at the trailing edge of the weld pool promote weld solidification cracking, while the development of a compressive cell surrounding the mushy zone precludes crack formation.
One proposed cracking susceptibility index is defined simply as the ratio σ/σ
max, where σ is local stress and σ
max is fracture stress.
24
Other approaches
25–27
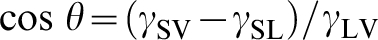
estimate the fracture stress of liquids trapped between grains. Assuming total wetting of a liquid trapped between parallel plates, uniform distribution of the liquid and negligible viscosity, the stress required to cause fracture σ
fr is given by
25,26
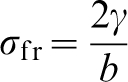
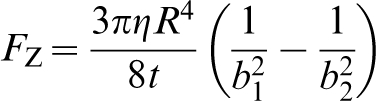
Calculated fracture stress from a equation (1) and b equation (2) of liquid Al–Cu binary alloy at 660°C separating two parallel plates 26
In weld metal, the primary dendrite arm spacing is on the order of 10 μm, thus the interdendritic liquid film thickness drops from slightly below 10 μm, near the liquidus temperature, to 0 μm at the solidus temperature. Figure 1 suggests that the initiation of solidification cracking through rupture of the interdendritic liquid film is rendered difficult as solidification progresses, with a sharp increase in the liquid film strength below 1 μm film thickness. Assuming solidification cracking to initiate by liquid film rupture, its initiation will preferentially occur in weak liquid films, i.e. in liquid films thicker than 1 μm. Considering a primary dendrite arm spacing of 10 μm in the weld mushy zone, a 1 μm thick interdendritic liquid film corresponds to a liquid fraction of 0·10, hence it may be suggested that solidification crack initiation will more likely occur at liquid fractions above 0·10.
Critical strain
While stress based models consider the maximum stress a liquid film can sustain in a semi-solid material, most cracking models assume that fracture in the mushy zone is strain limited. The assumption that the mushy zone, and its associated liquid films at grain boundaries, can withstand a limited strain before failure follows from early casting work of Pellini. 28 When straining a semisolid alloy, strain is assumed to be concentrated in the most vulnerable region within the mushy zone, that is at grain boundary liquid films. Strain accumulated in the mushy zone as a result of solidification shrinkage and thermal contraction serves to pull weld metal grains apart, resulting in the separation of grain boundary liquid films.
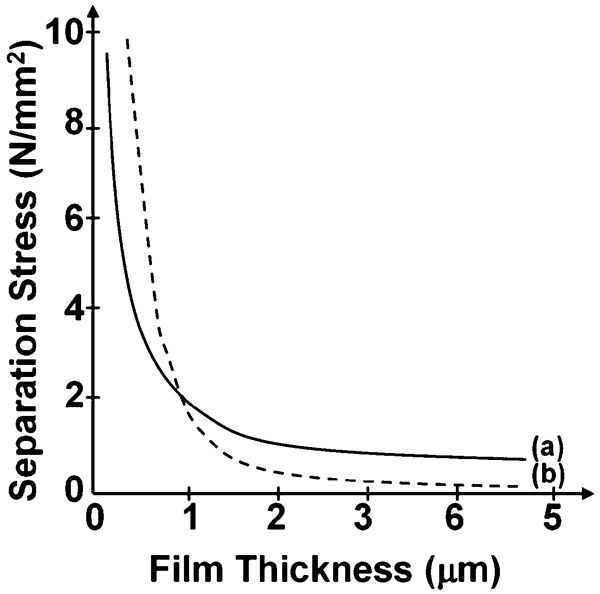
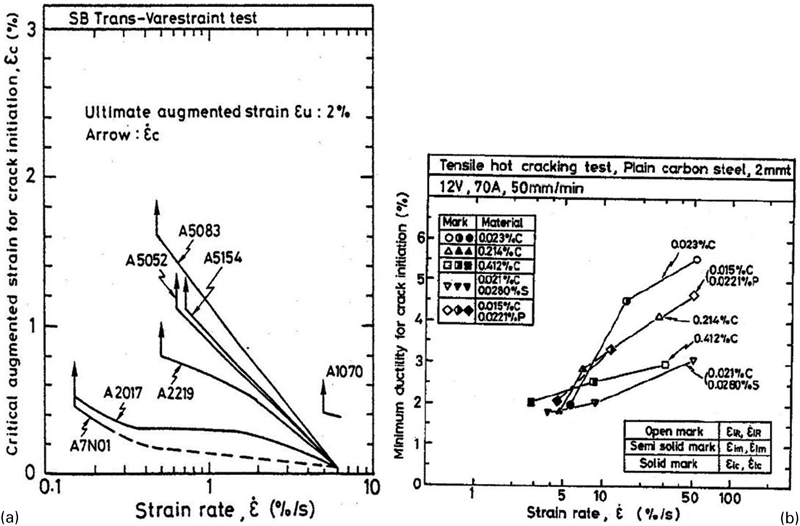
High tensile strain at the trailing edge of the weld pool has been associated with the formation of weld solidification cracking. 29–33 It is argued that a large solidification range permits a large build-up of strain and thus a greater likelihood to crack. 34–36 While alloys with a large solidification range are often found more susceptible to cracking, 1 there are exceptions where it clearly does not apply; for example aluminium–magnesium binary alloys have both a large solidification range and good weldablility. 37 Extensive testing has been conducted to establish characteristic ductility curves for specific alloys, 2,6,33,38–45 with some of these ductility curves for aluminium and steel alloys shown in Fig. 2. The ductility curves were generated using weldability tests such as the transvarestraint test 39 and the tensile hot cracking test. 38 The transvarestraint test subjugates the solidifying weld pool during welding to controlled amounts of strain by bending the specimen around a curved mandrel whose axis is parallel to the welding direction. The tensile hot cracking test applies a uniaxial displacement transverse to the welding direction and away from the weld. The crack initiation site was identified by monitoring the mushy zone during welding using high speed cameras and was then associated with a temperature (based on thermal field measurements) and strain to fracture (using the MISO technique detailed in the section on ‘Stress and strain around moving weld pool’). From the curves in Fig. 2, it is observed that there is a pronounced drop in ductility at an elevated temperature defined near the alloy’s liquidus, and ductility is regained somewhere near the alloy’s solidus. Based upon these results, one proposed solidification cracking susceptibility index is simply proportional to ϵ θθ/ϵ fr, where ϵ θθ is the accumulated plastic strain when reaching the solidus temperature and ϵ fr is the strain to fracture near the solidus temperature. 46
Solidification cracking occurs in the mushy zone of the weld metal, that is within a specific temperature range bounded by the solidus and liquidus temperatures and referred to as the brittle temperature range (BTR). This temperature range is represented by the breadth of the ductility curves in Fig. 2. The word ‘brittle’ is not meant in the conventional sense as applied to solid fracture, but does imply a loss of ductility. The BTR has long been considered for evaluating the solidification cracking susceptibility of an alloy, where a greater BTR is believed to represent lower weldability. The BTR has been experimentally observed and measured, and has been used extensively in the literature. Some BTR values are listed in Table 1. While the BTR concept was developed to be representative of the material itself, a large variation is observed for a same material welded under different conditions (such as the austenitic stainless steels), with up to a factor five variation. Hence uncertainty remains as to what the BTR actually represents.
Brittle temperature range of aluminium, steel and Inconel weld metals
*TVT = transvarestraint test, THCT = tensile hot cracking test.
All of the weldability data summarised in this paper (e.g. Table 1) have been compiled from numerous different sources in the literature and were generated using a variety of different tests. As such, these tables are not necessarily meant to reveal a weldability ranking of the different alloys, as too many inconsistencies exist in the testing procedures used, but rather to demonstrate the considerable amount of information available in the literature on this topic.
Shrinkage–brittleness theories propose that the BTR represents the coherent temperature range (CTR) bounded by the coherency and solidus temperatures, as first suggested in the late 1940s. 14,34,47,48 These theories have been extended by Medovar 49 who stated that the variation of hot cracking with alloy additions is determined by the length of the freezing range for added elements forming continuous solid solutions. The CTR was further defined (Fig. 3) by the generalised 36 (stage 2) and modified generalised 45 theories [stages 3(h) and 3(l)]. The initial high amount of liquid present in the interstices of the solid network (stage 2) is reduced to a thin continuous liquid film [stage 3(h)] and finally to isolated liquid pockets [stage 3(l)]. Solidification cracking should occur over a temperature range for which the semisolid alloy combines both very low permeability (inducing difficulty of liquid feeding), low strength (related to non-extensive intergrain solid bridging) and low ductility. 38 Therefore, the initiation of solidification cracking is unlikely during stage 2 because of the high permeability of the mushy zone (high liquid feeding) and during stage 3(l) because of the extensive intergrain solid bridging (high strength). Solidification cracking is likely to initiate during stage 3(h), where the alloy possesses both low permeability, low strength and low ductility within the BTR. 38 Because of the importance of the weld metal solidification path, DuPont et al. 50 developed a model to calculate the variation in fraction liquid with distance in the mushy zone as an aid to determining the effect of alloy additions on solidification cracking susceptibility. This model combined the general liquidus equation of a multicomponent system, solute redistribution relations and temperature gradient information.
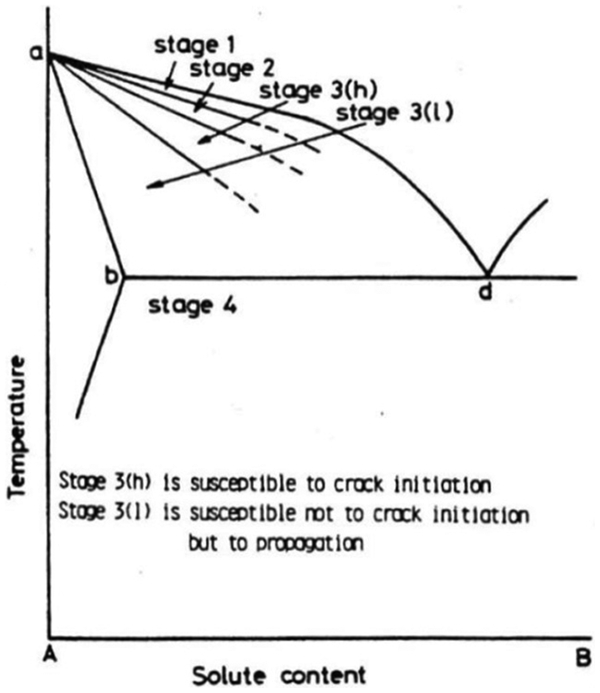
Correlation between solidification cracking and solidification path according to modified generalised theory 45
The likelihood to crack is believed dependent not only upon the quantity but also the distribution of liquid at the grain boundaries,
45,51
as initially mentioned by the generalised theory.
36
The liquid distribution is determined by the liquid wettability τ on solid grains (Fig. 4), accordingly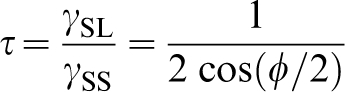
Relative interface energy τ versus dihedral angle φ and corresponding distribution of liquid at grain surface 36
Another approach
54,55
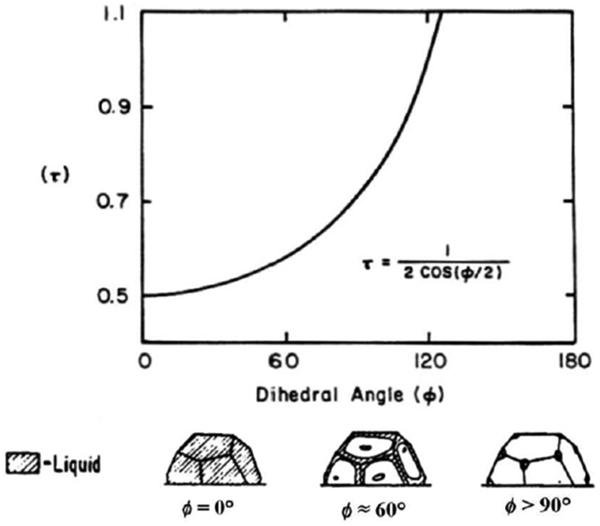
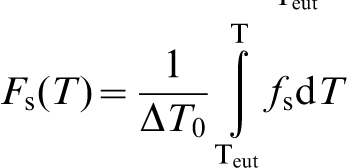
quantifies the ductility in the BTR by introducing the concept of ‘reserve of plasticity’ p
r to represent the accumulated strain that a semisolid can sustain. The term p
r equals the ratio between the interval of solidification ΔT
br and the darkened area S in Fig. 5. S represents the area separating the ductility curve ϵ
p from the solidification shrinkage curve ϵ
sh over the brittle temperature range ΔT
br. The term p
r is calculated as the averaged integrated difference between the elongation to failure ϵ
p and the shrinkage/contraction ϵ
sh in the brittle temperature range ΔT
br, hence between coherency T
coh and solidus T
sol temperatures 
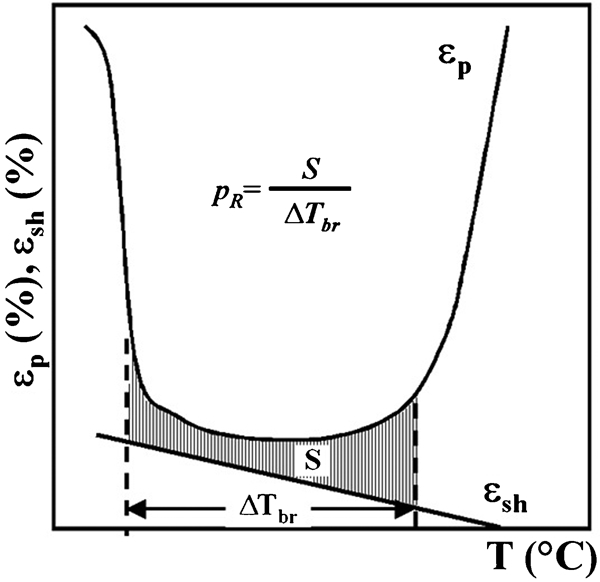
Shrinkage dependence for calculation of reserve of plasticity p r using ductility curves 55
Crack length parametric criteria are commonly used to quantify weldability. More extensive cracking, measured in terms of crack length, is normally associated with higher cracking susceptibility.
34,47,56–67
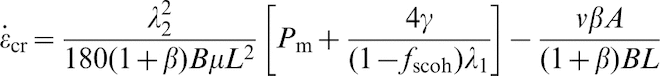
One theoretical approach
7,68
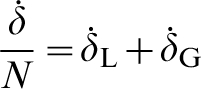
relates crack length to the ductility of the mushy zone. Assuming that the weld metal is strained at a constant strain rate 
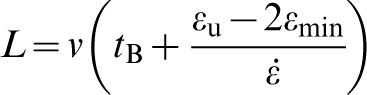
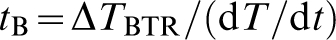
How crack length per se relates to weldability is not well understood. Therefore several quantitative analyses have been proposed. The maximum crack distance (MCD) has been defined as the length of the crack zone measured parallel to the heat flow. The MCD is basically similar to the maximum crack length index when the crack is parallel to the heat flow direction. Lippold 70 related the MCD in a transvarestraint test to a solidification cracking temperature range, believed to represent a characteristic material specific property reflecting relative weldability. The solidification cracking temperature range is more likely bound by the CTR and may therefore be the same as the BTR, although this remains to be confirmed. This relationship between crack length and temperature range assumes no crack growth during the application of instantaneous bending during weldability testing, where the maximum length of each crack is bound in extreme by the size of the mushy zone assuming no solid state rupture. Nevertheless, experimental devices do not apply the bending strain instantaneously, but rather over a finite duration, during which the crack should grow according to equation (5). This was later confirmed by in situ weld observations revealing crack growth even at the high applied strain rates encountered when using the varestraint test. 69 Therefore, a direct conversion of crack length to temperature range may lead to considerable error, in particular with slow bending tests.
While popular and widely used, strain based models have some drawbacks. The ductility curves and the minimum ductility vary with the applied strain rate, 38,39,71 which suggests that strain is not the only driving force for solidification crack formation. Moreover these ductility based models are not based upon any stated liquid fracture mechanism. Those two facts bring their validity into question.
Critical rate for strain accumulation
Some ductility based models recognise that strain rate is also an important factor, but only in so far as it serves to determine how much strain can be accumulated during the time of solidification. This concept was first suggested by Prokhorov
42
and later referred to as the critical strain rate for temperature drop (CST).
43
Using this strain build-up concept, the critical rate of strain accumulation, that is the boundary between crack and no crack conditions, is defined by where the deformation curve becomes tangent to the ductility curve (dashed line (ii) in Fig. 6a
) and is illustrated for three aluminium alloys in Fig. 6b
. The CST criterion was applied to evaluate the solidification cracking sensitivity of various weld metals such as aluminium alloys, steels and Inconels (Table 2). The rate of strain accumulation with temperature drop dϵ/dT is related to the cooling rate dT/dt and strain rate dϵ/dt, accordingly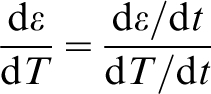
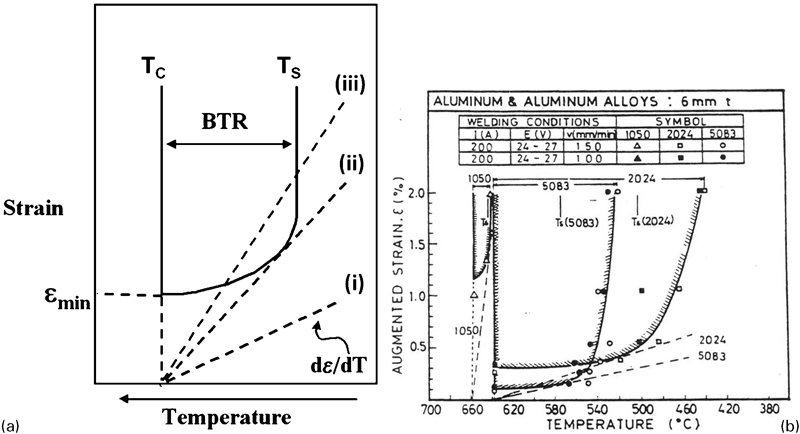
Strain rate dependence of solidification crack ductility a shown in general schematic and b illustrated for three aluminium alloys: 43 dashed line (ii) represents critical rate of strain accumulation for cracking
Critical strain rate for temperature drop required for weld solidification crack formation
*TVT = transvarestraint test; THCT = tensile hot cracking test.
Shrinkage–feeding concept
The majority of shrinkage–feeding theories presented in this section has been developed for castings. Shrinkage–feeding theories assume that the tendency to form solidification cracking hinges directly upon the ability to feed solidification shrinkage. When undergoing solidification, the liquid flowing through the mushy zone (liquid feeding) is hindered by the developing dendritic solid network. Solidification cracking is assumed to occur when liquid feeding becomes insufficient to compensate for the solidification shrinkage. Particularly important to their application to welding, the weld pool and interdendritic liquid serve the role of liquid supply, with feeding becoming increasingly difficult with distance from the fusion line (i.e. closer to the solidus).
Initially, a minimum amount of eutectic liquid, for example 12% by volume in cast aluminium alloys,
48
has been proposed as required to attain a feeding ability sufficient to avoid solidification cracking. Building on this point of view, Feurer
72
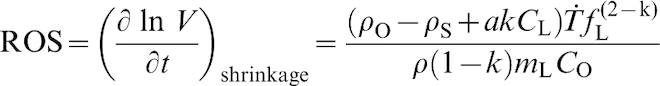
introduced the concept of rate of shrinkage (ROS) versus rate of feeding (ROF). Solidification cracking is likely to form when the ROS value exceeds the ROF value, as illustrated for Al–5 wt-%Si in Fig. 7. The ROF value, directly proportional to the effective feeding pressure, decreases with falling temperature because of the increasing tortuosity of the dendrite network with developing dendritic solid network. The tortuosity of the dendritic network is a relative quantification of how severe a twisted path is that the liquid must travel to fill gaps, a quantity which is then used to define resistance to liquid flow through the dendrite network. The ROS value is directly proportional to the cooling rate and amount of solidification shrinkage. These terms are calculated by assembling the variables of importance into the following dimensionless forms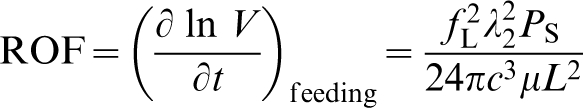

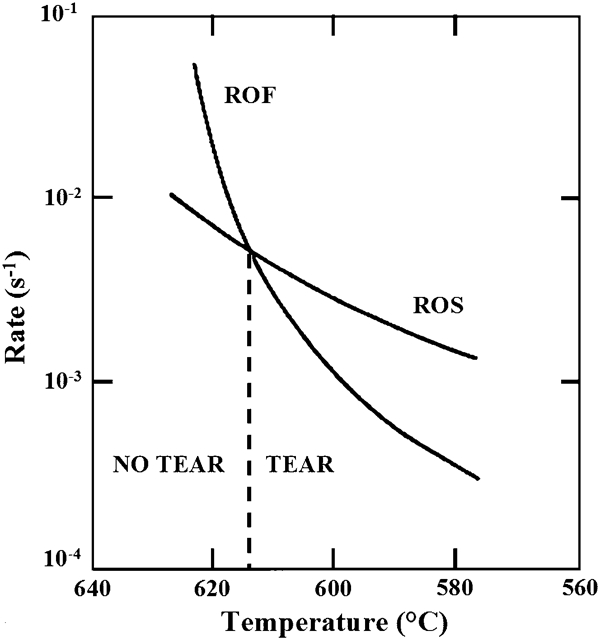
Calculated ROF and ROS for Al–5 wt-%Si casting 72
Considering arguments of the generalised theory
36
combined with the theory of Feurer
72
at the last stage of solidification, Clyne and Davies
51
proposed a crack susceptibility coefficient (CSC) to be the ratio between the time spent in the vulnerable zone t
v to the time spent in a recovery zone t
r by an alloy undergoing solidification (Fig. 8). The cracking susceptibility coefficient (CSC) was proposed as follows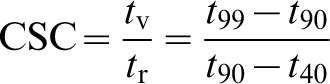
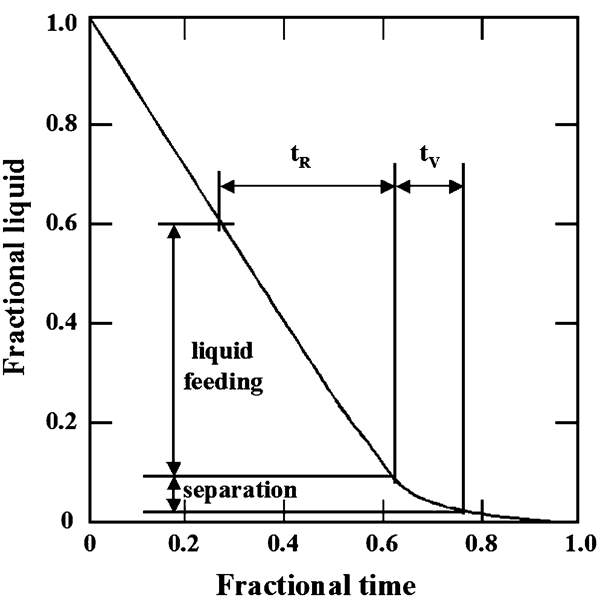
Relationship between liquid fraction, recovery duration t R and vulnerability duration t V 51
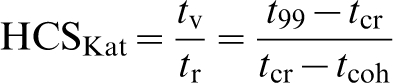
Hatami et al.
75
recently assumed that liquid feeding is directly related to the mean cooling rate during solidification after the coherency. The hot cracking susceptibility HCSHat index is given, accordingly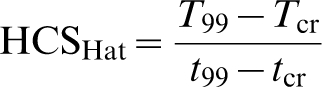
Critical strain rate
Over a long period of time (1940s–present), weld solidification cracking has primarily been viewed as a ductility limited phenomena, with numerous published ductility curves taken to define the boundary between crack and no crack. However, more recent developments suggest that strain is not the controlling mechanism for cracking. Strain rate, before just considered a secondary effect needed to achieve a critical strain, may actually play a more direct role in the liquid fracture mechanism, for example by controlling the interdendritic liquid pressure drop.
Measured critical strain rates and deformation rates required for weld metal solidification crack formation are listed in Table 3 for specific alloys and welding conditions, obtained by measuring local conditions at the crack initiation site using techniques described in the section on ‘Stress and strain around moving weld pool’. The critical strain rates for cracking are higher for commercially pure aluminium and smaller for steels than that for aluminium alloys, in agreement with the practical knowledge on the weldability of these metals. Another interesting observation is the occurrence of cracking at negative strain rates for alloy 6060, an alloy known to be very sensitive to solidification cracking when welded autogenously. In this case, the strain was measured with an extensometer spanned across the weld, a negative strain rate showing an inward movement of material to feed shrinkage. At first hand this appears counterintuitive, but may actually reflect upon the material’s very poor weldability. Even with the inward movement of base material, the low compressive local strain rate (–0·06% s−1) does not entirely compensate for solidification shrinkage, still permitting tensile strains in the mushy zone. Critical strain rate for cracking appears therefore to be a more fundamental quantitative measure of an alloy’s weldability, with faster critical strain rates for cracking associated to less crack sensitive weld metals.
Critical strain and deformation rates required for weld solidification crack formation
*TVT = transvarestraint test; SB-TVT = slow bending transvarestraint test; THCT = tensile hot cracking test; CTW = controlled tensile weldability test; VTST = variable tensile strain test; VDRT = variable deformation rate test.
Most solidification cracking models suffer from one common shortfall in that they fail to address how the liquid is fractured. One notable exception to this is the model of Rappaz, Drezet and Gremaud (RDG),
79
where liquid fracture is specifically related to an interdendritic pressure drop and cavitation. The RDG model for solidification cracking has put into mathematical form the shrinkage–feeding concepts of Feurer
72
and Campbell,
1
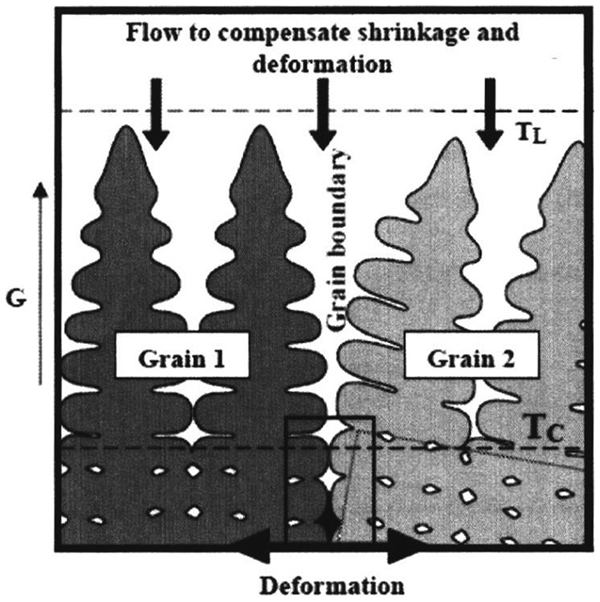
while additionally accounting for transverse deformation within the mushy zone incorporating a strain rate term (Fig. 9). The RDG model estimates the interdendritic liquid pressure drop at the dendrite root ΔP
max due to insufficient liquid feeding to compensate solidification shrinkage and thermal contraction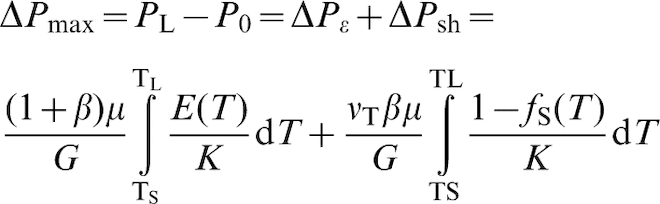


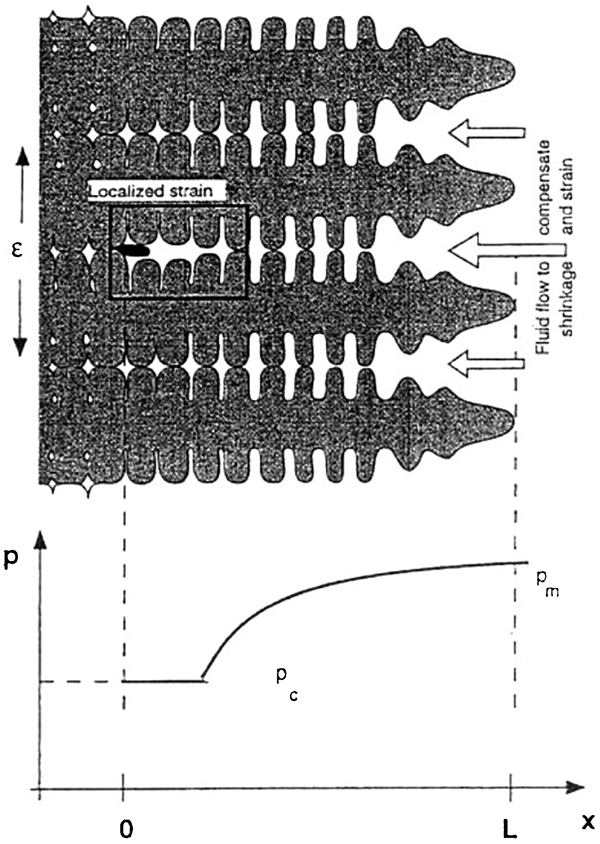
Schematics of solidification crack formation in between columnar dendrites resulting from localised strains: pressure profile in interdendritic liquid is indicated 79
The lower bound in equation (12) is ill defined, as K tends towards 0 when f
s tends towards unity. To overcome this problem, the lower bound has been taken at an arbitrary fixed solid fraction of 0·98
79
or at the zero ductility temperature,
84
assuming that the strain resistance due to interdendritic bridging is sufficient to resist cracking beyond these points. Recently, it was argued that the lower boundary should represent the temperature for grain coalescence, since cracking most often occurs along a single grain boundary. Indeed, the coherency at grain boundaries is expected always to be less than within the grain, because of the longer liquid film life for greater misorientation of the adjacent grains (Fig. 10). A theoretical approach for pure substances calculates the undercooling ΔT
b for coalescence at grain boundaries as given by
85
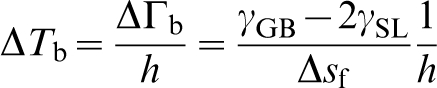
Schematics of solidification crack formation at boundary of disorientated grains 85
The RDG criterion was later coupled with a more rigorous rheological behaviour to include thermally and mechanically induced deformations of the solid phase.
86–88
These models assumed equal pressures within the grain and at the grain boundary, that is the stress within the solid equals the liquid pressure drop originating from the strain rate as calculated using the RDG calculation (recall equation (12)). The calculated pressure drop near the dendrite root has low sensitivity to variations in solid fraction at the coherency temperature since the negative liquid pressure builds up near the very end of solidification.
88
Based upon the simplified geometries shown in Fig. 11, which considers the liquid film between two grains as a simple liquid slab embedded between two slabs of solid with properties assumed to be those of the mush, the critical strain rates to initiate a crack in a columnar 


Schematic of a columnar and b equiaxed grain structure as considered by pressure drop cracking model in equations (14) and (15) 87
Further developments take account of plasticity of the solid phase 89 and existence of gas porosities, 90 which are assumed to form in the liquid phase for dissolved hydrogen amounts greater than the saturation value given by Sieverts’ law. Gas pores may affect feeding to compensate for solidification shrinkage and thermal contraction, and thus reduce the liquid pressure drop. 90 One index associated the solidification cracking susceptibility to the amount of porosity, 91 although such a direct correlation has not necessary been observed in castings. 92 Nevertheless that gas pores should be associated with weld solidification cracking is not a new concept, 1,93 and it is not surprising considering that both porosity and solidification cracking involve the formation of a liquid/vapour interface. Real time radiographic observations 9 and investigations of pore surfaces in titanium welds 94 have provided evidence that weld solidification cracking in steel can be connected to porosity.
Liquid fracture mechanisms
From the nature of solidification cracks, crack nucleation may involve liquid film fracture that occurs when the liquid pressure drop arising from insufficient liquid feeding falls below some critical value. The calculated pressure drops with equation (12) in aluminium alloys is in the range 10−3–10−2 MPa when a solidification crack is observed. 79–83 Therefore, numerous liquid fracture modes are detailed below to determine the most likely mode of fracture initiating solidification cracking. This knowledge should help to orientate the development of weldable alloys in the future through novel research paths.
Homogeneous vapour pore nucleation
Liquids become metastable when placed in tension (negative pressure), with a desire for vapour pores to form as governed by classical nucleation theory. Classical nucleation theory applied to vapour pore nucleation
95
defines cavitation to occur when the liquid pressure becomes sufficiently negative (hydrostatic tension) to overcome the barriers to homogeneous nucleation, involving the creation of a vapour/liquid interface. Homogeneous vapour pore nucleation involves spontaneous nucleation of vapour pores (cavitation) in the interior of a liquid. The work W associated with the reversible homogeneous nucleation of a vapour bubble is taken as the sum of the work required to form the volume V and area A of a spherical pore of radius r
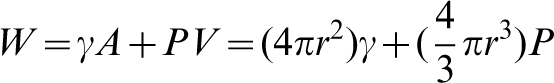
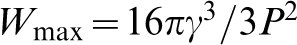
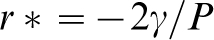
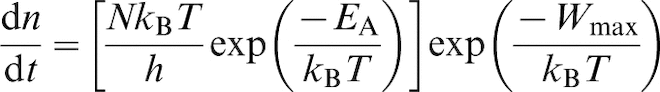
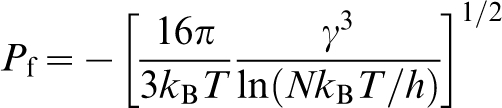
Liquid fracture pressure P f predicted by homogeneous nucleation theory (equation (18)) 95
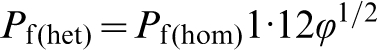
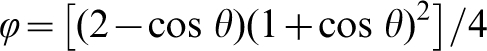
Heterogeneous vapour pore nucleation
The frequent occurrence of premature failure despite difficult homogenous pore nucleation has been associated with heterogeneous pore nucleation at the rough and irregular container surfaces,
1
non-wettable foreign substrates (such as oxides and inclusions)
96–99
and the growing solid/liquid interfaces.
100
The theoretical pressure for heterogeneous vapour pore nucleation at a liquid/solid interface P
f(het) in relation to the liquid–solid wetting angle θ and the fracture pressure required for homogeneous vapour pore nucleation P
f(hom) is given by
95
Gas pore nucleation
Of interest here is the possible effect of dissolved gas contributing to the internal pressure needed for liquid fracture. From Campbell,
101
the liquid fracture pressure P
f is taken to be the condition when the partial gas pressure P
g sufficiently exceeds all external pressures P
e to allow pore nucleation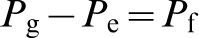
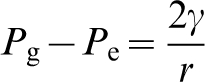
Pore formation from pre-existing nucleus
The fact that pores in castings and welds are the norm rather than the exception suggests that the discrepancy between theoretical and experimental values of liquid fracture strength cannot be explained in terms of dissolved gas, but must presumably be sought in the pre-existence of pore nuclei in the liquid. The stability criterion of a tiny bubble in the interior of liquid, that is the expansion/collapse boundary, is dictated by
1
Porosity based crack initiation
As pointed out earlier, cavitation, i.e. vapour pore nucleation, has been cited as a possible mechanism to initiate solidification cracking. 79,86,89 Although several mechanisms for vapour pore nucleation have been postulated, the pressure drop originating from thermal contraction strains (10−2–101 atm) 79–81,86–90,102,105,106 is several orders of magnitude lower than the pressure drop required to fracture a liquid metal (103–104 atm) 1 and too small to contribute significantly to pore formation. Since it does not appear that transverse strain alone can nucleate a vapour pore in weld metal, this suggests the possible involvement of another mechanism, such as the contribution of dissolved gas to the internal pressure needed for liquid fracture. 1,96,101,102,107 Alternatively, it has been proposed that crack initiation may be related to the formation of a stable gas micropore within the coherent dendritic region, providing a liquid/vapour interface from which a crack can grow.
The possibility that dissolved hydrogen and interdendritic gas pore formation may contribute to crack initiation was evaluated for 6060 aluminium alloy weld metal.
102
Liquid aluminium is predicted to withstand negative pressures of considerable magnitude (30 500 atm), which may be reduced to 1760 atm if nucleation occurs on a non-wettable foreign substrate.
1
Because of the high diffusivity of hydrogen in aluminium, the Lever law can be used to calculate the hydrogen content in the interdendritic liquid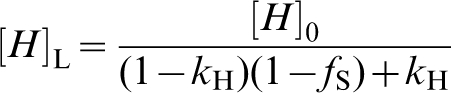

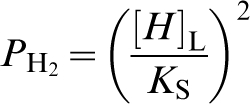
One possible explanation for this behaviour is that metastable pore nuclei may already exist in the liquid. Liquid metals are believed to contain micrometer-sized pores that cannot escape during processing because of their limited buoyancy. 1 Synchrotron microtomography has revealed that as cast aluminium alloys contain a high density of spherical pores (101–102 mm−3) that are only a few micrometres in size. 109 It has been proposed that such micropores may originate from high energy α-particle radiation, causing small atom clusters in the liquid to vapourise. 101 Metastable pore nuclei may also take the form of double sided oxide films 111 or gas trapped at the apex of oxides. 96 Should these micropores exist in the coherent region of the mushy zone (i.e. region of tensile as opposed to hydrostatic stress), this avoids the need to nucleate pores.
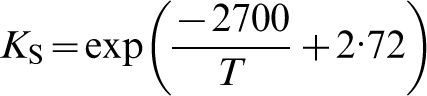
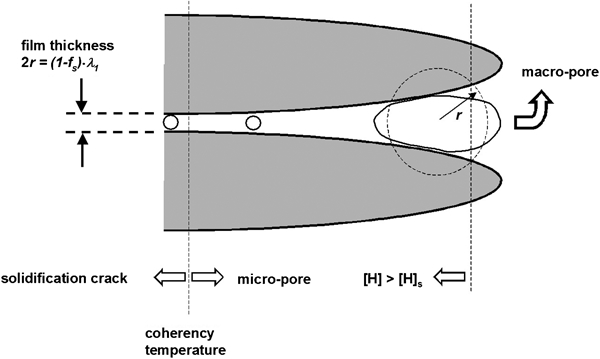
The concept for a porosity based crack initiation model 102 is illustrated in Fig. 12. Three possibilities exist assuming that the hydrogen concentration exceeds its solubility limit and that pre-existing nuclei are present. When formed ahead of the coherency region, that a stable pore can either be expelled in front of the advancing dendrites as a macropore, or become entrapped between the dendrites as a micropore. This distinction is determined by whether or not the stable pore diameter exceeds the interdendritic spacing at the point of formation. However, if a stable micropore forms within the coherency region, it then becomes a potential crack initiation site. The surface tension pressure Pγ must be counterbalanced by high hydrogen content, if a stable micropore is to form at the dendrite base.
Schematic representation of porosity based crack initiation model illustrating three different possibilities for formation of macropore, micropore and solidification crack 102
Conditions needed to activate and grow a pre-existing pore nuclei are assumed as follows: hydrogen content in the liquid must exceed its solubility
1,104
and pores must satisfy a stability criterion. Grandfield et al.
112
combined the stability criterion of Campbell
1
with the RDG pressure drop calculation,
79
where internal pressures that contribute to expansion (gas partial pressure P
g, solidification shrinkage ΔP
sh and thermal contraction ΔPϵ
) must exceed external pressures that act to collapse the pore (atmospheric pressure P
a and surface tension pressure Pγ
):
The hydrogen gas pressure (

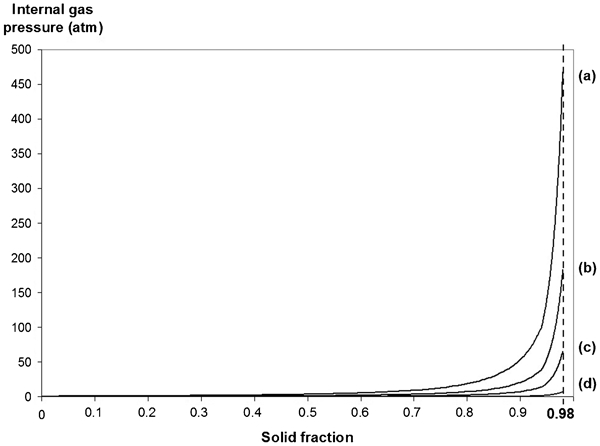
Hydrogen dissolved gas pressure versus solid fraction for initial hydrogen contents in weld pool of a 0·8, b 0·5, c 0·3 and d 0·1 mL/100 g: calculation based upon Lever law (equation (22)) 113
Crack growth models
Mechanisms for solidification crack growth have received only limited attention in the literature. It has long been assumed that conditions appropriate for crack initiation will result in crack growth. Nevertheless, specific conditions are needed to maintain the tip of the crack growing in the weld mushy zone, as shown by in situ weld observation. 69
Critical stress
Stress based models have been used to characterise crack growth by applying solid state fracture mechanisms to liquid film rupture. One approach involves breaking bonds between the two sides of the opening crack to take into account surface energy effects.
114
Another approach estimates the stress required for the propagation of a liquid filled crack
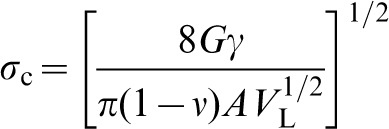
115
based upon a modified Griffith criterion. Modifying this criterion to consider the liquid film surrounding a grain as a stress concentrator, the critical stress σ
c to propagate a crack at a constant temperature and solid fraction is given by
115
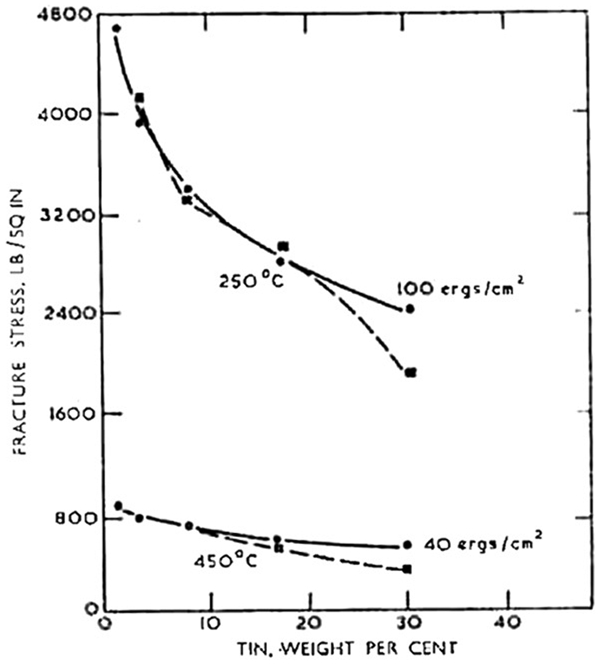
Comparison of experimental (dashed lines) and calculated (solid lines) values of fracture stress for Al–Sn alloys at 250 and 450°C and from 0 to 30 wt-%Sn 115
Critical strain rate
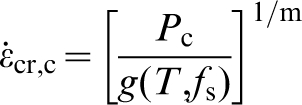
Strain rate based models correlate the crack growth rate to the rate of liquid feeding and the rate of mushy zone opening. Suyitno et al.
116
assumed a pore to form when liquid feeding cannot compensate the opening of the mush, providing a crack initiation source. A pore of diameter d will grow into a crack when the stress exceeds a critical value σ
m given by a modified Griffith criterion, accordingly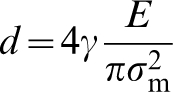
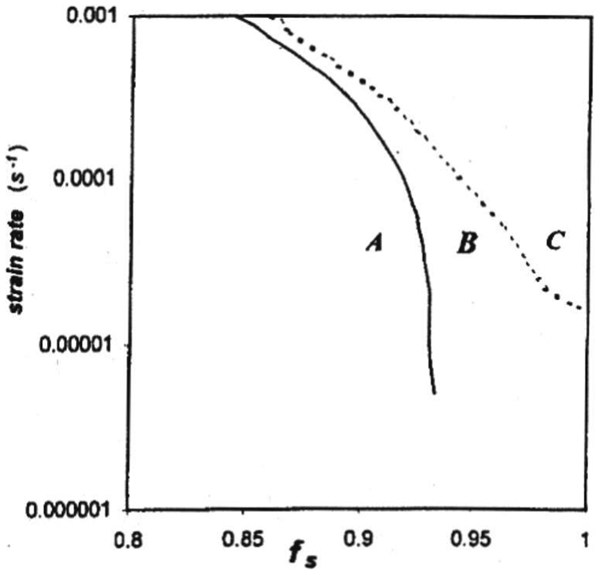
Strain rate–solid fraction conditions for (A) no microporosity and no cracking, (B) microporosity and no cracking and (C) crack growth 116
A pressure based model (Fig. 16) assumes a gas pore to grow as a crack if the sum of pressures contributing to its growth (liquid pressure drop due to solidification shrinkage ΔP
sh, applied strain ΔPϵ
and dissolved gas pressure P
g) exceeds the pressures contributing to its shrinkage (metallostatic pressure P
m, surface tension pressure Pγ
and atmospheric pressure P
a)
112


Schematic considered by pressure balance crack growth model in equations (29) and (30) showing directions towards which pressures push pore interface 112
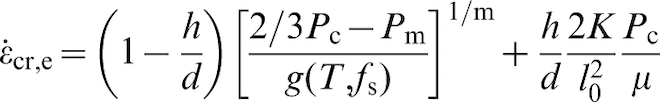
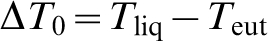
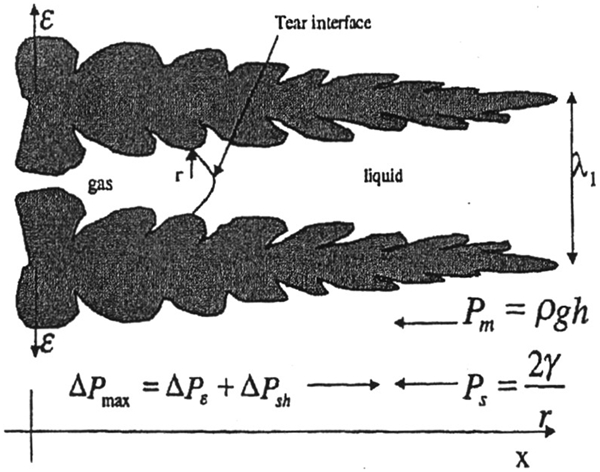
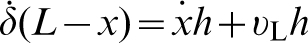
Another approach considers growth in terms of a simplified mass balance,
86,87
where crack opening due to transverse deformation is compensated by advancement of the crack and feeding of the liquid. Considering grains in the mushy zone separated by a liquid film of thickness h as depicted in Fig. 17, (L−x) is taken as the length of liquid film exposed to transverse strain. This model relates the transverse deformation rate 

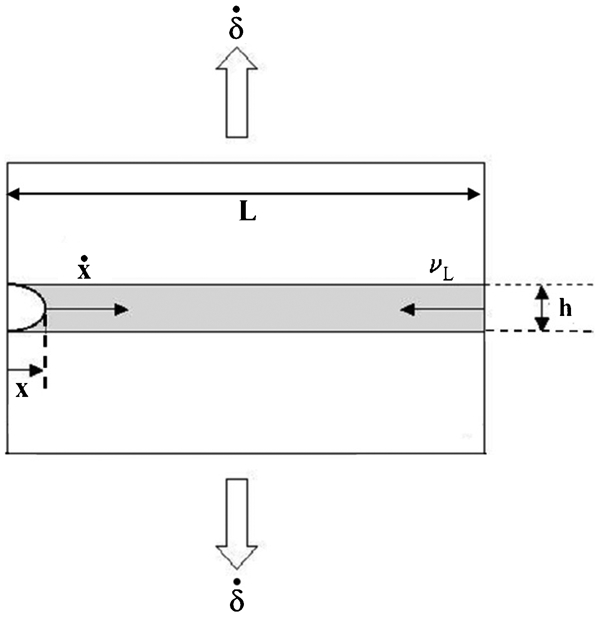
Schematic of liquid film at boundary between two grains, demonstrating mass balance controlled crack growth 86
Both pressure balance and mass balance based models (equations (30) and (31) respectively) were initially developed for casting. When applied to crack growth in aluminium welds,
102
the pressure balance model was deemed inapplicable, since the term ΔPϵ
(≈10−1 atm) is negligible compared to 
The mass balance based model for crack growth was adapted for welding by relating the transverse deformation rate 

Combining the porosity based crack initiation model (equation (25)) with the mass balance based crack growth model (equation (31)) shows that dissolved gas and strain rate control respectively crack initiation and growth. A hypothetical dissolved gas–strain rate map is presented in Fig. 18, defining conceptually the combined conditions needed for porosity (regions I and II) and cracking (region III) for a 6060+16% 4043 aluminium weld metal. At high enough levels of gas (e.g. region IV), cavitation may support crack growth. The predicted critical local strain rate needed to grow a crack is +0·41% s−1 for the aluminium alloy examined in Fig. 18. Compared with the experimental value (+0·35% s−1), 78 the predicted critical strain rate for the 6060/4043 weld was within 17%. This suggests that crack growth, and not crack initiation, is the critical factor defining weldability. The hypothetical hydrogen–strain rate map defines conceptually the conditions for cracking, suggesting better weldability at low weld metal hydrogen content. The crack free regions at low dissolved gas content have not been experimentally verified, and will require getting the ‘total’ hydrogen, that is diffusible hydrogen plus diatomic hydrogen trapped into micro- and macropores. Nevertheless, experience with cast aluminium alloys suggests that cracking is not possible below 0·10 mL/100 g H2, 118,119 and a similar minimum weld metal hydrogen content might be required to initiate weld solidification cracking.
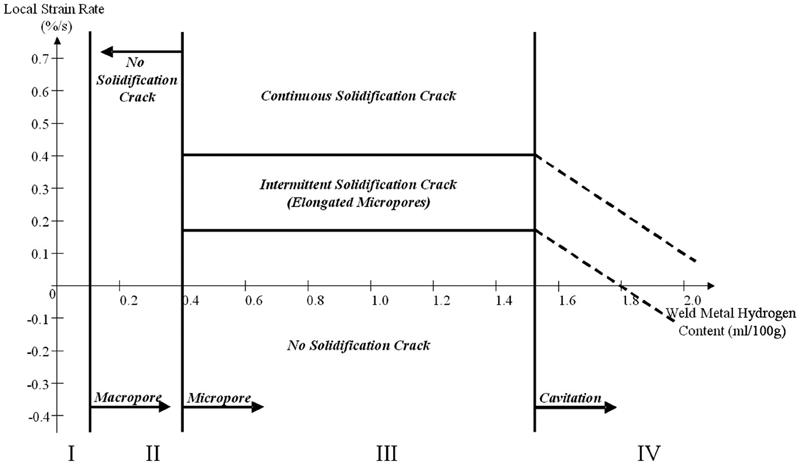
Critical strain rate–hydrogen map (hypothetical) demarking regions for cracking versus porosity as applied to 6060+16% 4043 weld metal showing four hydrogen concentration regions of interest 102
Stress and strain around moving weld pool
The numerous solidification cracking models assume that either stress, strain, or strain rate drives solidification crack initiation and growth. If all thermometallurgical conditions are held constant (for example fixed alloy composition and welding parameters), it is useful to concentrate on experimentally measuring what conditions are required to initiate and propagate cracking from a purely thermomechanical aspect. These measurements help to narrow the credible solidification cracking models among the numerous proposed in the literature.
Effect of welding parameters and degree of restraint
Tensile stresses and strains normally form behind a moving weld pool as a result of solidification shrinkage and thermal contraction and are influenced by the welding parameters and the degree of restraint. 4,22,23,29,120 Using the Moiré fringe analysis technique, Chihoski 22,23 observed along alloy 2014 gas tungsten arc (GTA) welds localised tensile and compressive regions (or cells), whose size and nature depended upon the experimental conditions, most notably weld travel speed. These cells are illustrated in Fig. 19a in the case of bead on plate GTA welds made at a welding speed of 8·5 mm s−1. The compressive cell C1 immediately in front of the weld pool is formed as a result of thermal expansion from preheat ahead of the welding torch. The tensile cell TS immediately behind the weld pool results from solidification shrinkage. The compressive cell C2, behind TS, is caused by the thermal contraction. Tensile cells T1 and T2 form in reaction to the compressive cells C1 and C2.
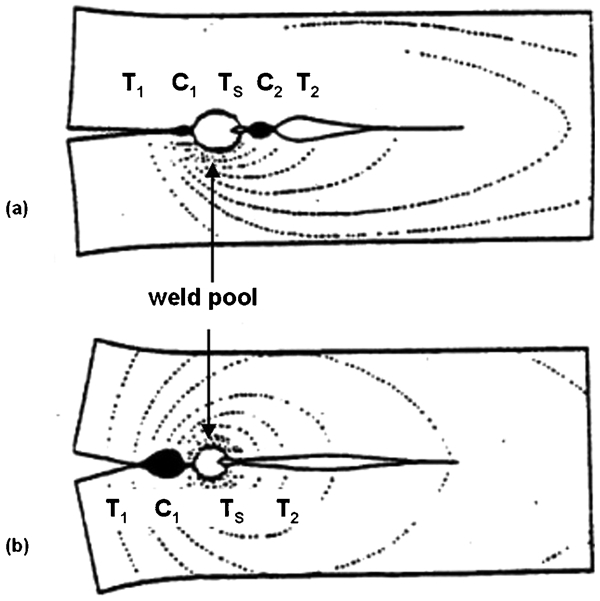
Transverse compressive (C) and tensile (T) cells around weld pool measured when welding at torch travel speed of a 8·5 and b 2·5 mm s−1: dashed lines are isotherms; note disappearance of compressive cell C2 at lower travel speed 22
Increasing the welding speed from 2·5 (Fig. 19b ) to 8·5 mm s−1 (Fig. 19a ) was experimentally observed to decrease the solidification cracking susceptibility. From a standpoint of thermally induced mechanical strain, this improvement in weldability can be associated with an increase in size of the compressive cell C2 at faster welding speeds, possibly related to a smaller weld size and greater temperature gradients. These thermal conditions may favour domination of the thermal contraction induced compression cell C2 over the solidification shrinkage induced tension cell TS. The prevention of crack formation by the development of a compressive cell surrounding the mushy zone was later demonstrated by Zacharia. 4
In more recent analyses, numerical simulations have been used to model cracking behaviour based upon strain in the mushy zone, building upon the limited ductility concept. Feng simulated weld centreline strain for welds made on plates of aluminium alloy 2024 with a solidification range of 638–502°C (911–775 K) as shown in Fig. 20. 29 Here it is observed that welds started at the plate edge (x = 0 mm) accumulate significantly more strain than welds started 12·5 mm from the edge (one-quarter of plate length). Such behaviour is commonly observed in practice, particularly for low restraint conditions. 120 Strain values are around 2% at the coherent temperature of 592°C (865 K) for the edge started weld. Simulations of weld metal strain for aluminium alloys predicted that cracking will occur when grain boundary deformation exceeds 15 μm. 31,121
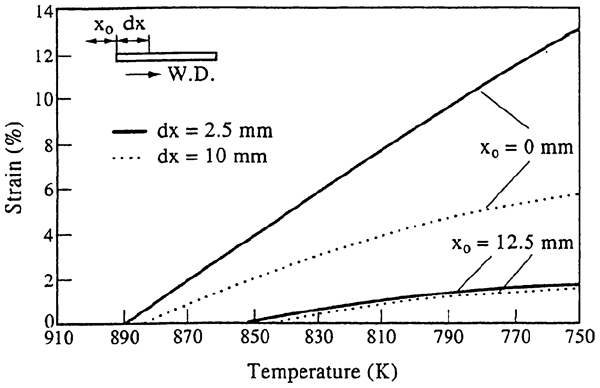
Predicted strain along centreline of alloy 2024 weld for two different weld starting positions: at plate edge and 12·5 mm from plate edge 29
Local strain measurements
Strains and stresses at the trailing edge of the weld pool can be either compressive or tensile, and arise from an interaction between the weld thermal experience (heating and cooling cycles), restraining forces and solidification shrinkage. 4,22,23,29 Measuring local strain in the vicinity of the mushy zone behind a moving weld pool is one key to the establishment of critical cracking conditions, verification of numerical simulations and eventual prediction of cracking behaviour. The disadvantage of strain analysis is that it adds to test complexity and is time consuming. Nevertheless, expressing cracking susceptibility in terms of a critical parameter directly related to a cracking mechanism has the advantage of providing a more meaningful representation of weldability. Of particular importance is the possibility to use these data in the modelling of cracking mechanisms, allowing for future prediction of cracking.
Local strain measurements pose some unique challenges primarily associated with the high temperatures and temperature gradients encountered in welding. Optical methods consist of real time observations of a pattern located at the surface of the specimen, as microVickers indentation marks, 30 scribe marks, 22 moiré-fringe analysis of grid patterns, 122,123 digital image correlation 113,124,125 and by means of in situ observation (MISO). 38–41 Images of the same pattern at two different instants are correlated to calculate the strain distribution over the analysed area. Optical techniques have the advantage of being non-contacting and insensitive to temperature changes, but require flat surfaces and optical access to the specimen. Strain can also be measured using extensometers 78,126,127 or an LVDT 128 spanned across the weld and mechanically connected by small diameter pins to opposite sides of the joint, either above or below the plate surface. Strain is measured as the welding torch passes between the affixed pins.
The MISO method has been specially developed to measure strain across a few grains within the weld mushy zone making use of small oxide particles present on the weld surface. The relative movement of these particles is tracked using high speed photography, typically providing an effective gage length between 0·9 and 1·7 mm. Using this technique in slow bending transvarestraint tests, a critical strain rate for crack formation has been determined when welding aluminium and steel alloys (Fig. 21), higher critical strain rate values representing greater resistance to cracking. This method has allowed determination of the cracking boundary in a strain–strain rate map at gage lengths of only several grains. However, since the strain rate is not uniform through the specimen thickness during varestraint bending, it is difficult to associate with certainty the measured strain at the surface to critical values needed to generate a crack.
Another approach was used to investigate the conditions for cracking using the controlled tensile weldability (CTW) test. 78 The CTW test consists of a horizontal tensile machine, with tensile strain applied transverse to the weld direction at a fixed crosshead speed during welding. This avoids the non-uniform straining problem associated with bending in a varestraint type test. An extensometer is attached underneath the weld coupon, in the path of the weld at midlength, to measure the local transverse strain across the mushy zone as it passes directly over the extensometer. Welding parameters are selected to obtain a full penetration weld in order to assume, as a first approximation, plane strain conditions, i.e. the applied transverse strain measured at the surface is constant through the specimen thickness. Results from CTW testing are summarised in a strain rate–composition map (Fig. 22), where cracking conditions are plotted in terms of local strain rate and 4043 filler dilution when welding alloy 6060. Strain rate is, by convention, negative when material in the adjoining base metal is moving towards the weld centre and positive when it is moving away. A boundary can be established (dashed line in Fig. 22) indicating critical cracking conditions. The position and slope of the border reflect the influence of thermomechanical factors, where alloys with poor weldability have low critical strain rates. This approach to weld development using in situ strain rate measurements and composition–strain rate maps helps define the boundary between crack and no crack conditions and can be used to characterise boundary variations for changes in welding parameters, weld pool contaminants and grain refiner additions. 126
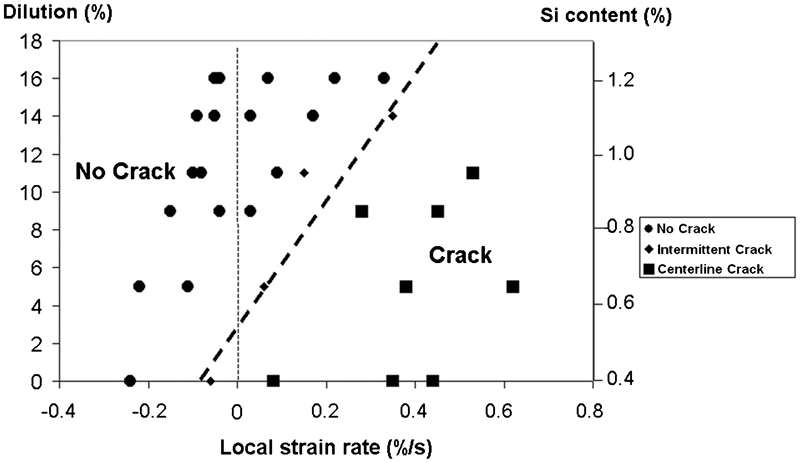
Cracking susceptibility of alloy 6060 for variable 4043 filler dilution shown as function of local strain rate 78
Strain distribution in mushy zone
Crack growth occurs most often along a single grain boundary located near the weld centreline. However, most experimental local strain rate measurements made in the vicinity of the mushy zone 22,30,113,122–125 and even in the mushy zone itself (MISO technique 38–41 ) have been made across several grain boundaries. In order to relate local measurements across several grain boundaries to actual strain conditions across a single grain boundary, for ideal application of theory, it is important to know how strain (and strain rate) is partitioned within the mushy zone. Despite its importance to relate experimental weld metal measurements and theoretical grain boundary critical driving force, strain partitioning has received little attention.
This issue was first addressed by Pellini in 1952. 28 When considering the two phase (liquid–solid) zone, he assumed that strain is localised in the most vulnerable region within the mushy zone, considered to be the grain boundary liquid films, for temperatures below the coherency temperature (Fig. 23). His approach was the first qualitative formulation of the strain partitioning.
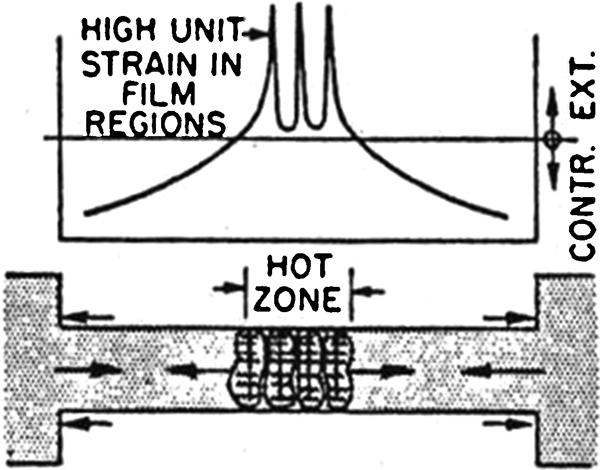
Strain distribution (extension and contraction) at temperatures within solidus–coherency range 28
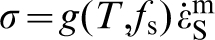
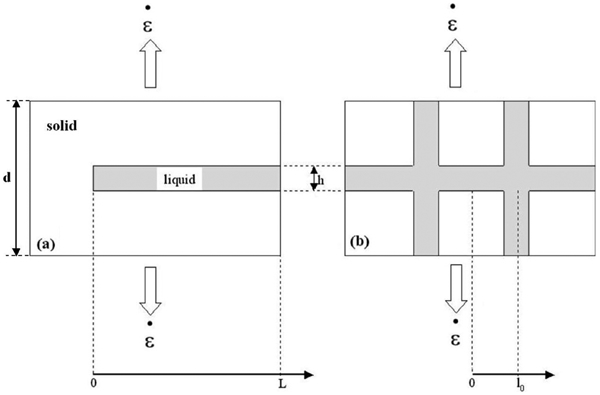
Fifty years later, the issue with the strain distribution within a mushy zone was again addressed. For this purpose, it becomes convenient to treat the mushy zone as a composite material consisting of parallel strips of liquid and solid phases (Fig. 24). The liquid film between two grains is considered as a simple liquid slab embedded between two slabs of solid with properties assumed to be those of the mush.
86,87
Considering a material composed of parallel strips of liquid and solid phases, the global strain rate 


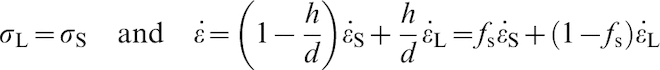

Schematic showing deformation rate across mushy zone


Another approach assumes the same geometry, and again considers the mushy zone as a composite material of solid and liquid strips.
102
Because experimental measurements often consist of local displacement measurements made across the mushy zone, the measured local displacement rate 


In both strain partitioning models (recall equations (32) and (33)), the solid deformation is estimated from an expression relating the rheological behaviour of semisolids to stress σ. A relationship for 

Practical implications
Numerous solidification cracking models reveal that the occurrence of solidification cracking is not inevitable. Welding engineers can mitigate cracking by adjusting the weld metal composition, joint design and welding parameters. The following discussion addresses some factors that may be controlled by the welding engineer to improve weldability, plus it serves to demonstrate the multifaceted nature of this problem.
Solidification cracking theories suggest that the weld metal solidification path plays an important role in the likelihood of solidification cracking formation. This metallurgical characteristic depends upon the composition of the weld pool that is determined by the amount of filler dilution, because the filler and base metal are often different alloys. While some alloys are highly susceptible to solidification cracking when welded autogenously, the addition of filler metals can shift the weld pool composition to a hybrid alloy mixture that is less crack sensitive, such as the addition of AA 4043 or AA 5356 filler metals to Al–Mg–Si base metal, 132–135 with weldability dependent upon filler dilution. 78 For example, the small increase in silicon content resulting from an AA 4043 filler addition has a major effect on the solidification path of AA 6060 welds, increasing the quantity of interdendritic eutectic while leaving the solidification range unaffected. 136,137 This improves the weldability by enhancing liquid feeding to compensate for solidification shrinkage and thermal contraction. 78 For example, when considering the welding of an AA 6060 structure, if the local strain rates can be either measured or predicted for a given set of welding conditions (i.e. welding parameters and joint constraint), the data in Fig. 22 can be used by welding engineers to maintain weld dilution above a threshold value to avoid crack formation.
Perceptions spanning 50 years have held that tensile strain and limited ductility at the trailing end of the weld pool are responsible for solidification cracking. 4,28,29,42,43,72,127 Strain cells around the weld pool have been experimentally observed and simulated, 22,23,76,138–140 originating from a reaction between thermally induced welding stress and the restraining forces imposed at the joint. Assuming that strain has a controlling effect on cracking, higher levels of joint restraint (e.g. more rigid construction) may limit deformation during welding and hence reduce solidification cracking. Such behaviour has been reported for aluminium alloys 30–32,65,120 and austenitic stainless steels. 65 However, as has been pointed out in this paper, mechanisms for cracking involve factors other than tensile strain, bringing into question any simple conclusion regarding the effect of restraint.
Welding parameters can also influence an alloy’s weldability. Welding parameters can be used to control the conditions (temperature gradient, cooling rate and growth rate) under which the weld pool solidifies. High welding heat inputs and corresponding slower cooling rates reduce the contraction rates resulting from solidification shrinkage and thermal contraction, thereby reducing the solidification cracking susceptibility. In another approach, the molten weld pool can be made to oscillate by means of pulsed current or mechanical vibration during welding in order to promote grain refinement. 141 Low frequency arc oscillations 142 and temporal pulse shaping 143 have been observed to reduce solidification crack formation in aluminium GTA and laser welds respectively, because of reduced grain size.
Another important welding parameter, torch travel speed, is known to influence solidification cracking. This parameter has been extensively studied, but with contradictory results. 22,23,76,138–140 On the one hand, some studies have observed an improvement in weldability when increasing torch travel speed up to 13 mm s−1, 22,23,138 in agreement with the prediction that a compressive cell forms behind the mushy zone (Fig. 19). On the other hand, some simulations 139 and experimental observations 140 show an increase in cracking susceptibility with increasing travel speeds in the range between 16 and 100 mm s−1. These discrepancies may arise in part from the variation with the torch speed of the weld pool shape which has a strong effect on weldability. 144 Increasing weld travel speed modifies the weld pool shape from round to teardrop, favouring stray grain formation along the weld centreline with long continuous grain boundaries. The orientation of long grain boundaries perpendicular to the thermomechanical strains leads to a high cracking susceptibility. This dual effect, stress cell versus weld pool shape, is exemplified in the AA 6060–AA 4043 aluminium alloy system. 126 Faster travel speeds improve weldability at high filler dilutions where no stray grains form, but at low dilution the weldability of AA 6060 is diminished because of the formation of stray centreline grains at high travel speeds.
Summary
During the last 50 years, strain was believed to control solidification crack formation in welding, without any physical basis in cracking mechanism. With advancing ideas regarding cracking mechanisms and improved testing methods, welding science is moving towards a point where the likelihood of cracking may someday be predicted for a given alloy and welding application. Mechanisms proposed today are summarised in Table 5. Recent developments have suggested that both dissolved gas and strain rate play a direct role in controlling weld solidification crack formation. Crack initiation has been linked to the formation of a micropore within the coherent interdendritic region. Since the fracture of grain boundary liquid film requires supersaturation in dissolved gas or very high strain rates, cavitation is unlikely the process initiating cracking. Hence, pores are assumed to form from pre-existing pore nuclei, controlled primarily by dissolved gas content and surface tension. Following crack initiation, crack growth has been defined by solid fracture mechanics, pressure balance and mass balance based models. The direct application of solid state mechanics to the liquid state is of questionable appropriateness. Pressure balance based models appear inapplicable in the case of welding. Whereas the mass balance based model has been successfully applied to welds and gives the critical transverse strain rate needed to sustain growth at welding speeds in agreement with experimental measurements.
Overview of solidification cracking models proposed to date
From a practical standpoint, local strain rates are difficult to measure and control, and are related to specific thermal, material and restraining conditions. Critical strain rate, however, represents a unique measure of a material’s weldability. Combining experiment with mechanistic models has allowed the quantification of grain boundary conditions needed for cracking to occur. The accurate prediction of critical strain rate through modeling will permit the useful assessment of weldability, but this will require a more detailed understanding of strain rate partitioning and grain boundary segregation.
With the aid of a strain partition model, the critical local strain rate measured experimentally can be related to the critical grain boundary strain rate needed for crack growth as established by modeling. Partitioning of thermal strain in the mushy zone, for example, must involve a complex interaction between grain morphology, coherency between grains and grain boundary orientation relative to strain. Grains located along the weld centreline, where cracking is most often observed, are typically the only grains oriented normal to transverse strain, and should experience a proportionately higher strain rate. By its simplified nature, however, the strain rate partitioning models do not account for differences in grain structure involving curvature and grain boundary orientation. This becomes further complicated if it is considered that the strain partitioned to grain boundaries is different from the strain partitioned interdendritically.
Also needed is the modelling of grain boundary segregation and coherency, where currently the concentration of segregates at weld metal grain boundaries and the coherency build-up are not well understood or quantified. Models for cracking so far have considered idealistic interdendritic conditions occurring at the grain boundaries. Grain boundary coherency is believed to develop at lower temperatures than interdendritic coherency due to grain misorientations. However it is not well understood how the coherency builds up at the grain boundary during solidification. Microsegregation of alloying elements due to partitioning between dendrites during solidification has been extensively modeled using the Scheil equation and its various different forms to account for back diffusion. However, the concentration of segregates at weld metal grain boundaries is not well understood or quantified. It has been well documented that segregates (such as sulphur and phosphorous in steel 145,146 ) migrate to the weld centreline and that this behaviour contributes significantly to weld cracking, particularly for tear drop shaped weld pools. 98 While models for cracking so far have considered idealistic interdendritic conditions for reasons of simplicity, it is clear that intergranular conditions are more appropriate.
However, the most important future investigations regard the relationship between dissolved gas content and solidification cracking. According to the proposed solidification cracking models, eliminating dissolved gas in weld metal should avoid the formation of a micropore, seen as crack initiation source, regardless of the mechanism for gas pore formation. Further research should also be initiated on two major themes: defining a threshold gas content for manufacturers, and developing ‘getters’ of gas to reduce its content in the weld pool. The idea that a solidification crack cannot initiate without dissolved gases should be extended to other manufacturing processes.
Footnotes
Acknowledgements
The authors are grateful to the Federal Institute for Materials and Research Testing (BAM), Berlin, for supporting research on this topic leading to the earned doctorate of one of the authors (Coniglio) from which this work was compiled. The reviewers are gratefully acknowledged for their useful comments.