
Abstract
Single phase (liquid steel) and two-phase (liquid steel and argon bubbles) three-dimensional computational fluid dynamic and heat transfer models were developed for the continuous casting machines of ArcelorMittal. The computational domains include tundishes, slide gates, submerged entry nozzles and moulds. The effects of buoyancy, tundish design, tundish practices, nozzle design and caster practices on flow structure were investigated. Mathematical modelling is discussed in detail. In addition, submeniscus velocity measurements in the slab caster mould are performed with the method of torque measurement. A consumable probe is inserted into the liquid steel meniscus from the top of the mould through mould powder and slag layer. The liquid steel flow applies a drag force to the probe, which then generates a torque. This torque value is measured and then converted back to velocity. The concept and challenges of the technique are discussed, and the effects of casting parameters on mould flow structure are investigated. Product quality in relation to real time meniscus velocity measurements is also discussed.
Introduction
Over the years, due to stringent customer requirements, steel producers have had to continuously improve castability and product quality in order to reduce reject rates (internal and/or external). Extensive research has been conducted to fundamentally understand the problems and to propose effective solutions. It has been shown that the castability and the product quality primarily depend on the flow in the continuous casting machine, which has effects on many phenomena, such as heat transfer, transport of inclusions, meniscus freezing, shell thinning from the jet impinging upon the solidifying shell, transient waves and fluctuations of the meniscus, thermal stress and crack formation.1 – 9 Flow structure ultimately determines the castability of a particular steel product and the total quantity and final location of defects in the product. Therefore, understanding and controlling liquid steel flow in continuous casting machine, tundish and mould have been of considerable interest in recent years.
The flow in tundish and mould is usually very complex, turbulent and therefore unsteady by its nature. Most of the time, it involves three different materials at three different phases that are temperature and pressure dependent (liquid steel, solid inclusions and argon gas). In addition, it is quite challenging to perform any type of real time flow measurement in a casting environment. Therefore, comprehensive understanding is required to model and/or measure the flow structure in a continuous casting machine. Currently, only a few techniques are possible to perform an actual flow measurement in the mould, particularly in the meniscus region, while modelling using both experimental and computational techniques is a common approach to characterise the flow.
This paper aims to provide an overview of liquid steel flow in continuous casting machines while discussing the challenges and applicability of computational modelling and real time measurements. An attempt is made to address numerous casting issues via computational fluid dynamics (CFD) and real time flow measurements. The computational modelling study addresses the effects of temperature and/or buoyancy, unbalanced (uneven) throughput extraction from strands and tundish design on tundish flow. It also aims to investigate the effects of submerged entry nozzle design, nozzle bottom and argon injection on mould flow. The flow measurement study primarily demonstrates the effects of casting practices and nozzle designs on meniscus flow and product quality.
Modelling
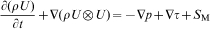
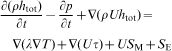
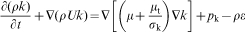
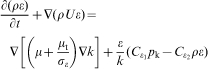
Single phase (liquid steel) and two-phase (liquid steel and argon bubbles) CFD and heat transfer models were developed for continuous casting machines using ANSYS CFX. The models were applied to tundishes and slab casters of various ArcelorMittal steel shops in order to solve specific problems for each operation. Figure 1 demonstrates some of the simulation domains that were used in the present study. Table 1 is constructed to list the specific information regarding tundish designs, nozzle designs and simulation parameters used in the present study. For the mould simulations, Unsteady Reynolds averaged Navier–Stokes (URANS) k–ϵ models were used, and time averaged patterns were demonstrated for 200 s of liquid steel flow. For the tundish simulations, RANS k–ϵ models were used. For the computational models, the governing equations (conservation of continuity, conservation of momentum and conservation of energy) along with the transport equations of turbulent kinetic energy k and turbulent eddy dissipation ϵ are solved. The equations are as follows10
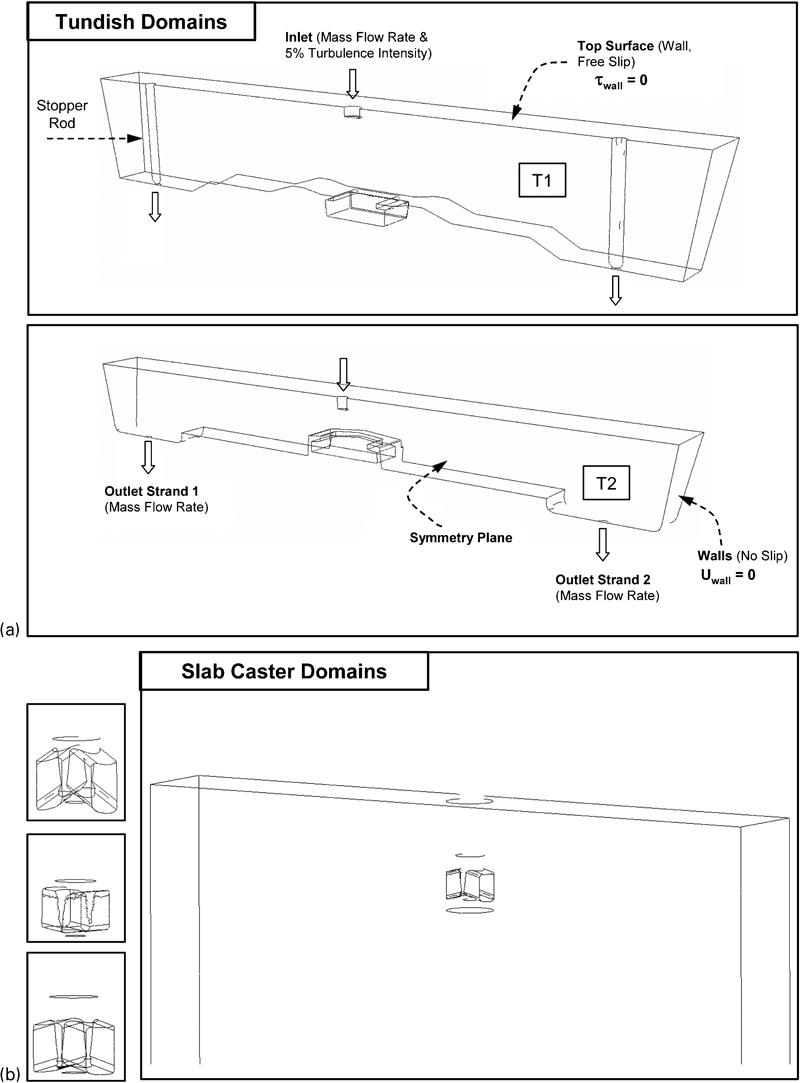
a simulation domains for tundishes used in CFD modelling and b typical simulation domains for slab casters used in CFD modelling
List of tundish internal design, SEN (submerged entry nozzle) design and simulation parameters
Conservation of mass


For the single phase flow, the relative importance of buoyancy due to temperature variations in a convective flow can be estimated using the ratio of Grashof number and square of Reynolds number
For the buoyancy calculations, the Boussinesq model is implemented. This uses a constant density fluid model but applies a local gravitational body force throughout the fluid, which is a linear function of fluid thermal expansivity β and the local temperature difference with reference to a datum called the buoyancy reference temperature.10
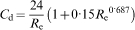
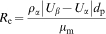
For the two-phase flow modelling, as also documented in Ref. 11, an Eulerian–Eulerian approach is used for the coupling of two phases (liquid steel and argon bubbles). Conservation of continuity, momentum and energy equations for the argon phase are also added to the equations and interrelated with the interphase momentum transfer rate. During the solution of the equations, since the volume of one phase cannot occupy another, the sum of the volume fraction of the phases is equal to one. Spherical bubbles with a constant diameter are used for the argon phase.12 For the interphase drag, the Ishii–Zuber drag model is used, and the interphase coefficient and the drag coefficient are set as follows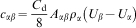
Extensive validation is performed for the CFD models that were developed. Similar strategies for mesh generation, case set-up and solver set-up are used for each application. Reference 13 was primarily dedicated to the extensive validation of CFD models both qualitatively and quantitatively. Because the focus of the present report is not the validation, it is not shown here. The RANS and unsteady RANS k–ϵ models are quite powerful in predicting the average velocity field in tundishes and mould within reasonable deviation, even though they have relatively simple formulation. Owing to this simplicity, the stability of calculations is superior.
Tundish modelling
This part of the study aims to investigate the effect of tundish design, thermal effects and unbalanced (uneven) throughput extraction on the tundish flow. The tundish domains that were used in the CFD models, including the boundary conditions, are shown in Fig. 1a . The specifications of each design are shown in Table 1. Two different tundishes have been analysed, both with two strand outlets, i.e. outlets 1 and 2. There are characteristic differences between the two designs, as specified in Table 1. The following four different cases have been investigated for both tundishes: A, isothermal, even (balanced) throughput extraction; B, non-isothermal (thermal), even (balanced) throughput extraction; C, isothermal, uneven (unbalanced) throughput extraction; and D non-isothermal (thermal), uneven (unbalanced) throughput extraction.
Figures 2 and 3 represent the velocity vectors on the centre/symmetry plane for the cases A, B, C and D for tundish 1 (T1) and tundish 2 (T2) designs respectively. The velocity vectors are grey scaled and normalised with their length. Thus, the length of a vector does not represent any quantitative information whereas the grey scale represents the velocity magnitude. The same strategy to demonstrate the velocity field in the domain is used for Figures 5 and 6.
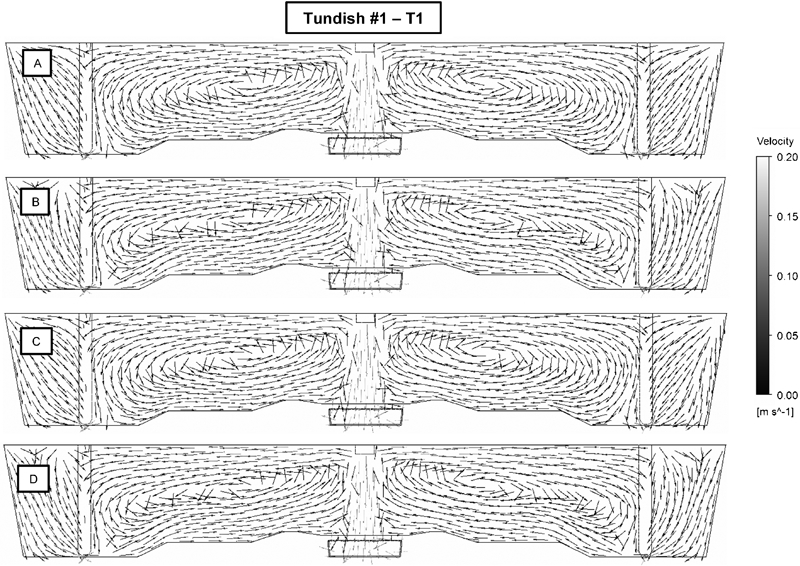
Velocity vectors at centre/symmetry plane for tundish 1 (A: balanced isothermal; B: balanced thermal; C: unbalanced isothermal; D: unbalanced thermal)
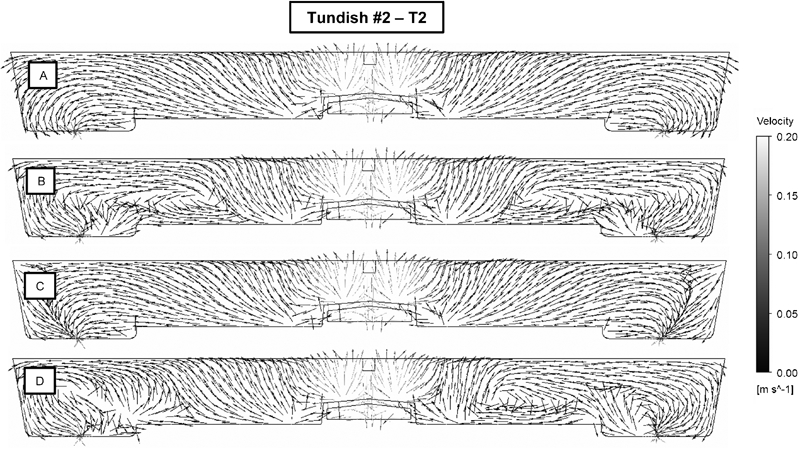
Velocity vectors at centre /symmetry plane for tundish 2 (A: balanced isothermal; B: balanced thermal; C: unbalanced isothermal; D: unbalanced thermal)
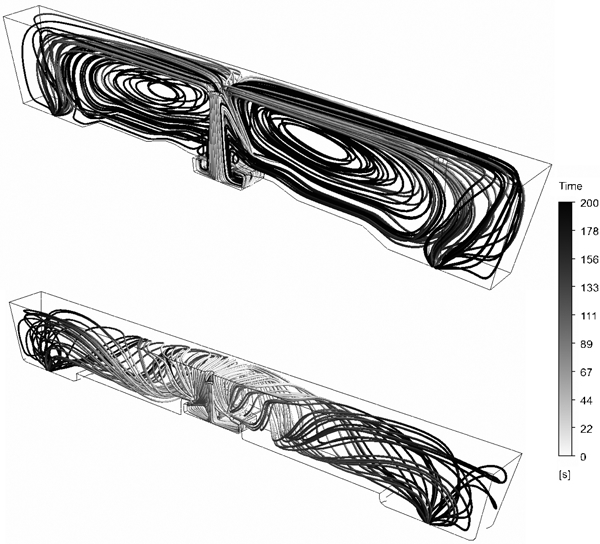
Three-dimensional streamlines scaled with time (s) for isothermal balanced throughput extraction cases for tundishes 1 and 2
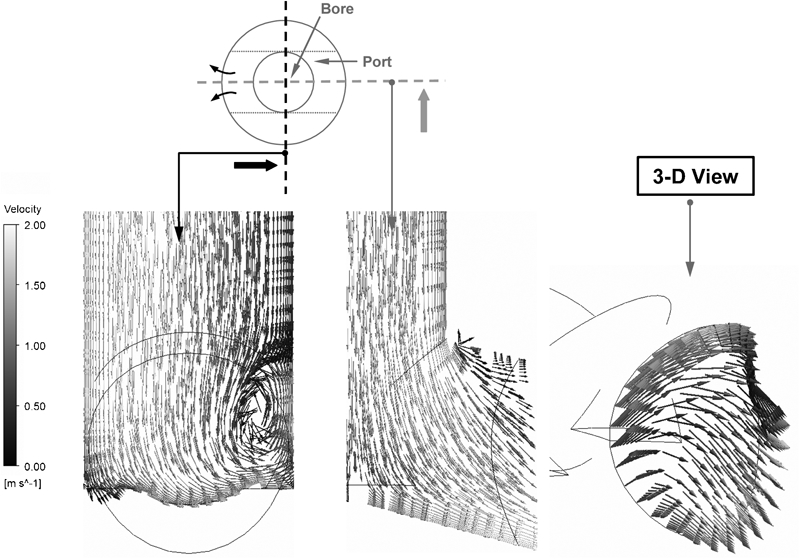
Velocity vectors in nozzle at different views for roof bottom circular port design
When considering the T1 design shown in Fig. 2, the overall flow structure in the tundish does not show a noticeable variation when including thermal effects (case B) and/or the difference in throughput extractions from the strands (case C). A large scale circulation dominates the flow in the tundish for all cases, although a slight difference is detected on the flow structure near the sidewalls. However, for the T2 design shown in Fig. 3, thermal effects and unbalanced throughput extraction have significant impact on the overall tundish flow structure. There are two easily noticeable differences. The first is the large scale circulation region seen on both sides of the tundish when thermal effects are included. Buoyancy effects cause this kind of circulation. Owing to this large scale circulation, there are regions where the flow is directed towards the centre of the tundish. The scales of circulation regions are different on both sides of the tundish when unbalanced throughput is applied, as opposed to T1 shown in Fig. 2. The side that has a lower throughput extraction has a larger circulation region. The second difference is the overall flow activity at the top surface. For the thermal model, the flow at the top surface is more active, and the velocity magnitudes are quite high compared to the isothermal model.
To clearly visualise the overall flow structure in the tundish, three-dimensional streamlines are also constructed. Figure 4 represents three-dimensional streamlines for the isothermal balanced throughput extraction case for both tundishes 1 and 2. The streamlines are grey scaled with time. These images are more representative in demonstrating how liquid steel flows in a tundish. As shown in Fig. 4, the general flow characteristics are different in T1 and T2. In T1, the liquid steel jet coming from ladle shroud creates a very strong, large scale circulation (almost covering the whole tundish), whereas in T2 design, most of the jet coming from ladle shroud bounces back from the impact pad, reaches the top surface and does not create a large scale circulation; instead, follows its own path and curls from the wall by creating a spiral-like flow. This is an indication of a high plug volume. It can be inferred from the field that the flow structure in T1 is more stable compared to T2. The well defined large scale circulation pattern supports this idea. Having more stable flow should cause less sensitivity to the disturbance in the inputs and/or boundary conditions and in turn would result in less flow variability. This is also confirmed by the results shown in Figs. 2 and 3, which illustrate less change in the overall flow pattern for T1 when thermal effects are included, and/or unbalanced throughput extraction is applied in contrast to the T2 design.
Both tundishes include a single furniture, impact pad. Nevertheless, the overall flow characteristics are quite different. The T1 design seems to be less sensitive to thermal effects and uneven throughput extraction.
Slab caster modelling
This part of the study aims to address the effects of nozzle bottom design, nozzle port angle and argon injection on mould flow. The flow structures induced by different nozzles, which have different port angles and nozzle bottom, were investigated. The specifications of each design are listed in Table 1. Figure 5 demonstrates the grey scaled velocity vectors in the nozzle at different views for roof bottom design. This nozzle design has circular ports. In the images, the effect of sliding gate on the flow structure is clearly seen. The circulation at the bottom of the nozzle is quite strong. Circular jet exits the port. Port efficiency is quite high, which would potentially reduce port clogging.
Figure 6 shows the mould flow structure for the corresponding nozzle and the same nozzle design with cup bottom. The velocity vectors on the centre plane parallel to the broad face and the vorticity contours at the meniscus are shown. Both nozzles generate a double roll flow pattern in the mould. Detailed visualisation reveals that the flow characteristics are quite different. Jet expansion in the mould (shown with grey arrow) is significantly wider with the roof bottom nozzle. This is primarily due to the fact that strong jet circulation at the bottom of the nozzle expands into the mould domain and spreads three-dimensionally. In addition, it could be the indication of high fluctuation of port jet in the casting direction (up and down), which creates an expanded jet in the mould in time averaged patterns. This is also supported in water model test results.14 As explained in Ref. 14 for this design, high mould flow fluctuations are evident, which in turn cause switching of mould flow from single roll to double roll flow pattern.
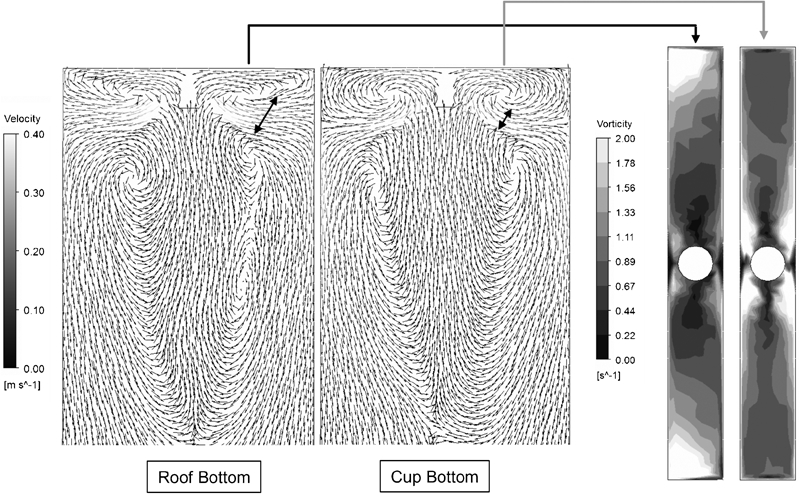
Velocity vectors on centre plane parallel to broad face and vorticity contours at meniscus for roof bottom and cup bottom nozzle designs
When considering the vorticity levels at the meniscus, quite different patterns are witnessed. For the cup bottom design, traditional vorticity patterns having high levels of vorticity near the nozzle are obtained. These patterns are quite typical and potentially cause traditionally known ‘vortex formation’ and slag entrainment. Intermediate levels of vorticity are also evident with roof bottom design at the same locations. However, the highest levels of vorticity for the roof bottom design are obtained in a very unusual place at meniscus, which is close to narrow faces. This is most likely due to the jet behaviour coming out from the nozzle ports. The nozzle bottom (roof), the port shape (circular) and having biased flow inside the nozzle due to the sliding gate are all contributing factors to this behaviour.
Another study regarding the application of CFD on mould flow addresses the effects of port design and argon injection through the nozzle on mould flow structure. Figure 7 shows the greyscaled velocity vectors on the centre plane parallel to the broad face of the mould for two different nozzle designs, i.e. port up SEN 1 and port down SEN 2, with and without argon injection. The images are cropped to be shown in the same figure and do not demonstrate the whole domain length used in the simulations. This portion of the study was also documented in Ref. 11. As shown at the top row of Fig. 7, when no argon is injected, the standard double roll flow is evident in the mould. Although the port orientations are different, the liquid steel jet at the port seems to have a similar angle for each SEN design. The meniscus velocities with port down SEN 2 are significantly higher than the ones obtained with port up SEN 1. For port down SEN 2, the liquid jet is very predominant at the bottom section of the port, which in turn creates a back flow region on the top portion of the port. However, for port up SEN 1, in addition to the jet at the bottom portion of the ports, jet expansion is evident. That expansion results in having no back flow region on the top portion of the port. This causes significantly low velocity magnitudes at the meniscus.
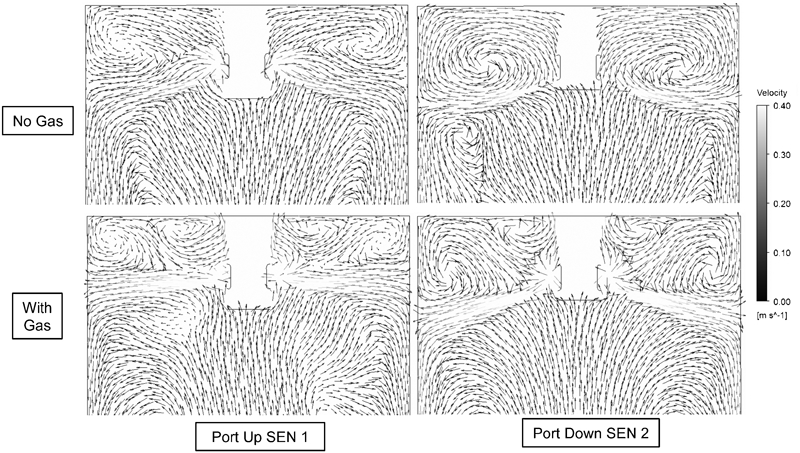
Velocity vectors on centre plane parallel to broad face of mould for port up SEN 1 and port down SEN 2 with and without gas injection11
When argon is injected, the mould flow structures transform to different patterns compared to the ones obtained under the absence of argon. Particularly, the meniscus region clearly indicates significant variations and contains two counter rotating circulations for both designs. Argon bubbles affect the liquid phase in similar ways for both SENs. The argon dampens the upper loop. The upper circulation gets smaller in scale and deteriorates according to its strength in single phase flow. Thus, for port down SEN 2, since the meniscus velocities in single phase flow are relatively higher compared to port up SEN 1, the deterioration of the upper loop is less when argon is introduced. Unlike the no argon cases, a significant difference is noticed regarding the liquid jet stream angle and the impingement points on the narrow face when gas is injected. However, the velocity magnitudes at the meniscus do not show significant variations.
This part of the present study shows how critical it is to choose what nozzle to use in a slab caster. Small variations in both port angle and bottom design could induce significant changes on the mould flow pattern. In addition, argon flow is another parameter that has a significant effect on mould flow; thus, the flowrate has to be adjusted cautiously.
Mould flow measurement
Concept of measurement
Obtaining continuous, real time flow measurements at meniscus could help achieve many fundamental objectives in the area of continuous casting. These include, but are not limited to, understanding the effects of casting parameters on meniscus velocity, evaluating and validating CFD and water models, obtaining correlation between meniscus velocity and defects and updating the theory on how to optimise the mould flow. Direct velocity measurement in a mould is not possible due to the extreme temperatures in the measurement domain. Therefore, indirect measurement techniques need to be implemented. These techniques are usually simple in nature but require a deep fundamental knowledge in order to be properly applied. In this part of the paper, one of the indirect flow measurement techniques along with its challenges and implementation has been introduced.
Submeniscus velocity measurements were performed with the torque measurement technique. The concept of measurement is shown in Fig. 8. The idea is to measure the torque generated by the drag force due to liquid steel flow. Special probes were dipped into the liquid steel through the mould slag layers. The liquid steel flow applies a drag force to the probe with a well known concept, i.e. ‘force on a solid body due to drag’. The following equation shows the relationship between drag force and velocity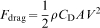
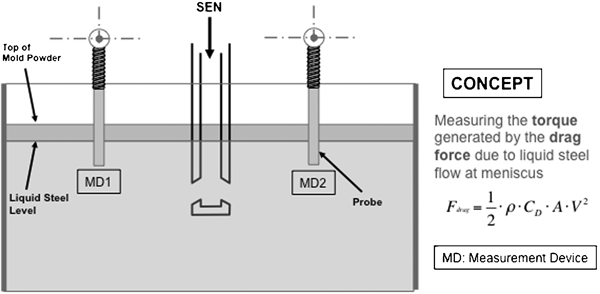
Sketch summarising measurement principle
The drag force, as described above, generates a torque, which is equal to the following

Since the slag/liquid steel interface creates a significant amount of wear on the probe, the submerged portion of the probe into the liquid steel could easily be detected after the trials when the probes are removed from the mould. This helps to recalculate the velocity values with the actual probe submergence values after the trial in order to obtain more accurate results.
Measurement challenges
The measurement concept is fairly simple; however, the difficulty comes with its application. Figure 9 shows the measurement chain and the list of challenges in performing the measurement. The measurement chain follows the sequence shown in the figure. The signal coming from the sensor is conditioned first before it is sent to the data acquisition board. In addition, digital filtering is applied before the real time conversion of torque to velocity is performed. The real time velocity measurements from both sensors are displayed during the measurements. The sensor and the signal conditioning units were designed and developed by ArcelorMittal Global R&D Maizieres.15 – 17
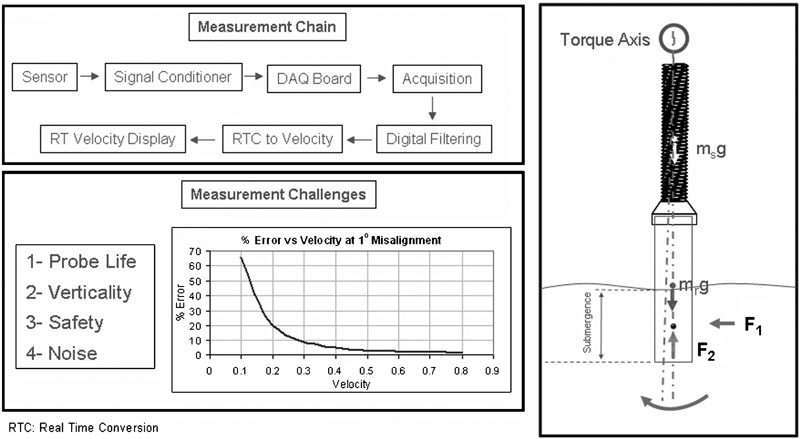
Measurement chain and measurement challenges
There are four main challenges that are encountered during the measurements. These are probe life, verticality, safety and noise. Probe life is an important parameter since the measurement time depends on it. The longer the probe life, the longer the measurement time without interruption would be. There is a time required to replace the probes. In addition, each probe change causes disturbance in both process and meniscus flow. Thus, it is desired to keep the probe life as long as possible. However, there is a cost associated with this. The life of the probe primarily depends on the slag wear rate at the slag/liquid steel interface. Selecting the appropriate material for the probe is one of the most crucial steps. In addition, the bigger the probe diameter, the longer the probe life would be. However, since the thickness of a standard slab caster varies between 8 and 10 in, there is a limit in selecting the diameter of the probe. This limit depends on many things, but the most important ones are the blockage effect and the disturbance generation.
Another challenge of the measurement is the concept of verticality. The measurement is performed to measure the torque generation by the drag force due to liquid steel flow. The force and torque values are small, particularly at low flow velocities. If the probe could be located perfectly straight (perpendicular to the mould level), the only contributor to the torque generation would be the liquid steel flow. Thus, there would not be any measurement error. However, practically, this is not possible. When there is any angular misalignment, gravitational and buoyancy forces start generating ‘artificial’ torque on the measurement axis that could bias the measurement significantly. This generation depends on the misalignment value, density of the probe and submerged volume. The percentage error depends on this generated torque relative to the torque generated by the liquid steel. Sample calculations have been performed to quantify this error. As shown in Fig. 9, the per cent error at different liquid steel velocities is calculated when 1° misalignment is present. At low flow velocities, even a 1° misalignment contributes to a significant error, which can be up to 65% in the measurement. Thus, proper countermeasures need to be taken to make sure that the alignment is as good as possible. In addition, under any circumstances, velocities <0·05 m s−1 are questionable. It is also important to mention that angular deflection of the torque sensor (due to the sensor’s working principle) is a contributor to the error associated with non-verticality. Thus, it needs to be measured and accounted in the calibration process as well.
The challenges regarding safety and noise are very typical in any steel plant measurement and are not discussed here due to space limitation.
Results of measurements
Different casting conditions, including casting speed, argon flowrate, nozzle design and nozzle submergence, were tested. It was aimed to investigate the effects of casting parameters on mould flow structure and product quality. The measurements were performed at the quarter mould width location for both sides of the nozzle.
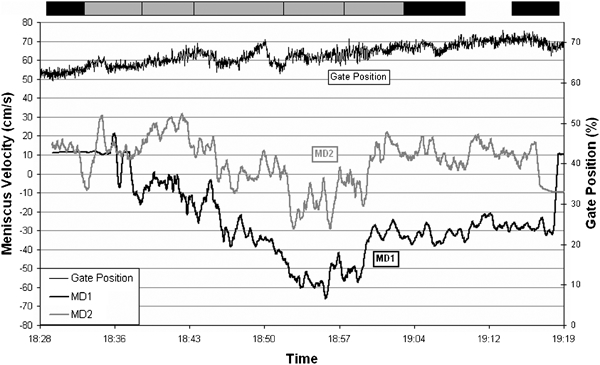
Figures 10– Figure 11 Figure 12 13 were constructed with the following approach. The positive sign for measurement device 1 (MD1) shows that the flow goes towards the SEN, whereas the negative sign for MD2 represents the same behaviour. The velocity data shown here correspond to the values of 25 s moving average. The x axis is specified as time. The primary y axis is for the meniscus velocity values for both measurement devices. The secondary y axis represents the indexes of casting parameters, which are submergence and cast speed in Fig. 10, gate position in Fig. 11, argon flowrate in Fig. 12 and argon flowrate and cast speed in Fig. 13. The boxes (slabs), when shown on the top of the figures, represent the quality feedback for the corresponding slabs that are in the mould at the time specified in the chart. A certain threshold decides whether a slab is black or grey. Grey is considered ‘ok’, and black is considered ‘not ok’. The measurements were performed for sliver sensitive grade. Thus, the grey and black boxes represent the sliver index coming from the coils of the corresponding slabs. Figures 10– Figure 11 12 represent the results for nozzle design A, and Fig. 13 is for nozzle design B. The design differences are described in Table 1.
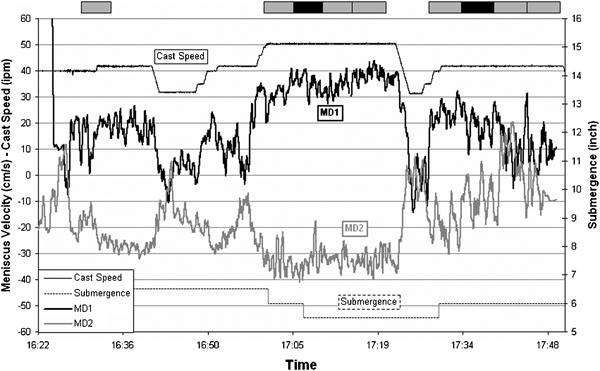
Meniscus velocity measurements, casting parameters and quality feedback for casting sliver sensitive grade with SEN A
Meniscus velocity measurements, casting parameters and quality feedback for casting sliver sensitive grade with SEN A
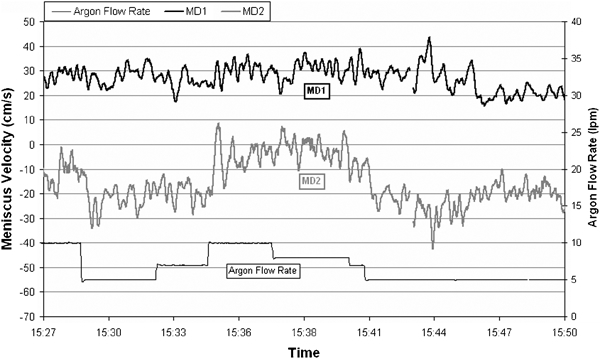
Meniscus velocity measurements and casting parameters for casting sliver sensitive grade with SEN A
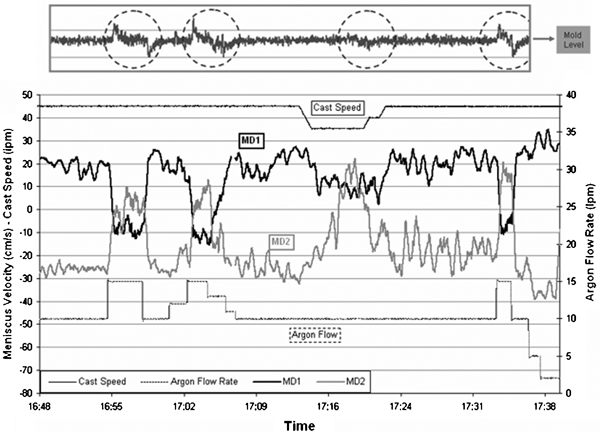
Meniscus velocity measurements and casting parameters for casting sliver sensitive grade with SEN B
As seen in Fig. 10, there is a significant correlation between cast speed and meniscus velocity. At high casting speed, the flow is double roll, thereby the meniscus moves towards the SEN (+ for MD1 and − for MD2). The flow is usually symmetric. The reduction in casting speed causes a significant drop in meniscus velocities and an increase in velocity fluctuations. This sometimes generates bias or single roll flow pattern having very low velocity magnitudes. Ramping up to the high casting speed shows recovery in the meniscus velocity magnitudes and in the overall flow pattern. The indication of the reductions and increases in cast speed can be clearly seen on the meniscus velocity measurements. Since the mould width was kept roughly constant in each case, any remarks that are made for the cast speed is valid for the throughput as well. The flow seems very stable when the mean values are in the range of 20–40 cm s−1. No significant correlation is noticed between the quality data and the meniscus velocity.
A different characteristic was tried to be tracked in the measurements shown in Fig. 11. Only the measurement shown in Fig. 11 was conducted later at the sequence, i.e. it did not start with a clean SEN. During this test, a significant increase in the gate index is detected. It is important to mention that the cast speed and the tundish level are constant during the time span of this measurement shown in Fig. 11. Based on the measurement results, the flow at the meniscus is completely disturbed and is biased all the time. The velocity magnitudes are quite different from one side to the other side of the SEN. The velocities on one side of the SEN could sometimes reach a value of 60 cm s−1, which is considered extremely high for meniscus flow. Even though at the end of the sequence single roll flow is apparent, the velocity magnitudes still show significant variation for each side of the nozzle, i.e. 10–30 cm s−1. No symmetry is obtained at any time. These 50 min data show one of the worst flow structures that could be achieved. During this measurement, it was also noticed that there was a pressure loss in one of the argon injection/sealing sources. Thus, there are two possible explanations for this kind of flow behaviour at the meniscus, which are air aspiration in the system and nozzle clogging. It is quite surprising to see that there is no correlation between the meniscus velocity and the quality feedback.
Figure 12 demonstrates how the meniscus velocity reacts to the argon flow change. The velocities on one side of the nozzle seem to be insensitive to the changes in the argon flowrate. For that corresponding side, i.e. MD1, the meniscus velocity is within the range of 20–30 cm s−1 and quite stable. However, the other side reacts to the argon flowrate change dramatically. At low argon flowrate, MD2 shows similar values with MD1. The overall flow pattern is seen as double roll and symmetric. When the argon rate increases, the deterioration of the meniscus flow on the MD2 side is evident. The higher the rate, the more it deteriorates. At the maximum rate, very low meniscus velocities are achieved on the corresponding side. For that period, it can be concluded that the overall meniscus flow is biased. Reducing the argon flowrate causes a recovery of the meniscus velocity for that side of the nozzle. The overall flow pattern turns into a strong double roll once again when low argon injection is maintained. This SEN design is more prone to biased flow.
Figure 13 shows the results of meniscus velocity measurements when different casting speeds and argon flowrates are tested for SEN B. In this case, the meniscus flow seems predominantly symmetric. The only exception happens at very low casting speed. The flow is strong, stable and double roll most of the time with meniscus velocities in the range of 20–30 cm s−1. When the argon flow is suddenly increased to high values, the meniscus velocities significantly change, and the measurement values drop to 0–10 cm s−1. Single roll flow becomes evident at the highest argon flowrate. Lowering the argon flow causes a recovery of the meniscus velocity on both sides of the SEN. Further reduction in the argon flowrate increases the meniscus velocities. The sudden changes in the argon flowrate and therefore in the meniscus velocities are noticed as spikes in the mould level signals, shown as red circled areas at the top of Fig. 13. A similar trend was obtained in many other measurements but not as dramatic as the case demonstrated. This means that sudden changes in the meniscus velocities are also detected with the mould level sensors. Gradual but significant changes in the meniscus velocities have also a footprint in the mould level signal, as shown in Fig. 13. This indication is not as significant as the ones obtained in sudden changes; however, it is still apparent.
Based on all the measurements conducted, Fig. 14 was constructed and shows the relationship between argon flowrate and throughput in order to reach a favourable meniscus flow for different SEN designs. A favourable meniscus velocity is considered when the meniscus flow is symmetric, double roll and having relatively less fluctuations. Thus, these three conditions have to be met in order to consider the meniscus flow favourable. The argon flowrate on the y axis shows the maximum allowable argon flow at the corresponding throughput value. It shows the upper limit of the argon flow. That limit can shift according to the nozzle submergence. Basically, Fig. 14 suggests that there is a maximum argon flowrate beyond which the meniscus flow is not favourable. This rate is not only a function of throughput but also a function of nozzle design and nozzle submergence. It is expected to have a similar trend for the lower limit, which would probably be supported by the nozzle clogging index. Thus, there should be an area in the throughput versus argon flowrate plot where the favourable flow is obtained for each nozzle design. The optimum meniscus flow should be somewhere in that favourable area. This optimum meniscus flow is expected to be supported by the quality data. A well established quality feedback and more velocity measurements should help to determine the optimum operating conditions along with the optimum meniscus flow. A compressive study is needed to complete this part of the study.
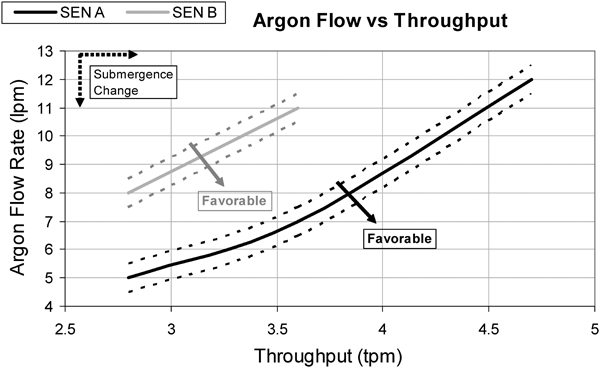
Relationship between argon flowrate and throughput to reach favourable meniscus flow for different SEN designs
It is important to mention that the correlation between the product quality and the meniscus flow could not be found in the present study primarily due to the fact that the product quality feedback was not sufficient both quantitatively and qualitatively.
Conclusions
In this paper, an overview of the liquid steel flow in continuous casting machines is provided, and the challenges and applicability of computational modelling and real time flow measurements are discussed. Single phase and two-phase CFD models for the tundishes and the moulds were developed for various ArcelorMittal continuous casting machines. The effects of various operational parameters, including tundish and caster practices on the flow structure, are investigated. In addition, real time submeniscus velocity measurements were performed with the concept of torque measurement. The concept and challenges of the technique are introduced, and the effects of casting parameters on mould flow structure were investigated. Some of the major findings are the following.
Two different tundish designs, i.e. T1 and T2, were considered for the CFD study of tundish flow. The effects of tundish design, uneven throughput extraction and temperature on tundish flow structure were investigated. Even though both designs include single internal structure and impact pad, the general flow characteristics are quite different. In T1 design, the liquid steel jet coming from ladle shroud creates a very strong, large scale circulation, whereas in T2 design, most of the jet coming from ladle shroud bounces back from the impact pad, reaches the top surface and does not create a large scale circulation; instead, follows its own path and curls from the wall by creating a spiral-like flow. The flow structure of the T1 design is insensitive to thermal effects and uneven throughput extraction from strands, whereas for the T2 design, thermal effects and uneven throughput extraction have a significant impact on the overall tundish flow structure.
Four different SEN designs were considered for the CFD study of mould flow. The effects of circular port, roof and cup type bottom designs, port orientation, port angle and argon flow on the mould flow structure were investigated. Circular ports along with a roof bottom design generate highly unsteady, expanded jet in the mould, which in turn causes high levels of vorticity at meniscus very close to the narrow faces. Argon injection causes significant deterioration of flow structure at the meniscus. This deterioration depends on the strength of the upper loop at the single phase flow condition when no argon is injected. Owing to the fact that port down SEN provides a stronger upper loop in the absence of argon compared to port up SEN, argon injection causes relatively less deterioration of meniscus flow with port down SEN when argon is introduced.
Two different SEN designs were considered for the mould flow measurement study. Different casting conditions, including mould width, nozzle submergence, cast speed and argon flow, were tested. Significant correlations were found between throughput, nozzle submergence, nozzle design and meniscus velocities. It is evident that the throughput and the argon flow have major effects on the meniscus velocities. There is a maximum argon flowrate beyond which the meniscus flow is not favourable. This rate is not only a function of the throughput but also a function of the nozzle design and the nozzle submergence. In addition, any significant change in the meniscus velocities causes significant changes in the mould level.
Footnotes
Acknowledgements
The author would like to express his many thanks to B. Chukwulebe, D. White, M. Ozgu, J. Sengupta, J. Thacker, A. Elnenaey, V. Gueugnon, M. Atkinson, D. Kruse, S. Kinkel, J. Bradley, R. Kostyo, D. Sena, M. Alavanja, D. Idstein, S. Chakraborty, S. Kipp, C. Kennedy, S. Schreiner, J. F. Domgin, T. Tsai and G. Lawson from ArcelorMittal for their support.