
Abstract
This paper presents the development of a mathematical model to describe the direct reduction of iron oxides in a shaft furnace. The concept of the shrinking core model was adopted. A pellet model was developed for the direct reduced iron using three consecutive reaction schemes, while the furnace was modelled as a one-dimensional steady state moving bed reactor. The combined pellet–reactor model was used to determine the profiles of compositions and temperature of gas and solid. The resulting boundary value problem was solved using the orthogonal collocation method. Validation of the model against data from a local iron/steel plant showed satisfactory results. A sensitivity analysis was carried out for the effects of key operating parameters, such as bustle gas temperature, ratio of gas/solid feedrates and reductant/oxidant ratio. Useful profiles were compiled to illustrate the results of the sensitivity analysis. These results may serve as guidelines for further optimisation studies of the unit.
List of symbols
surface area per unit volume/m−1
fitting kinetic parameters
reactant (H2 or CO) concentration at haematite/magnetite interface/mol m−3
product (H2O or CO2) concentration at the haematite/magnetite interface/mol m−3
reactant (H2 or CO) concentration at the magnetite/wüstite interface/mol m−3
product (H2O or CO2) concentration at the magnetite/wüstite interface/mol m−3
reactant (H2 or CO) concentration at the wüstite/Fe interface/mol m−3
product (H2O or CO2) concentration at the wüstite/Fe interface/mol m−3
reactant (H2 or CO) concentration at the external pellet surface/mol m−3
product (H2O or CO2) concentration at the external pellet surface/mol m−3
bulk phase gas reactant (H2 or CO) concentration/mol m−3
bulk phase gas product (H2O or CO2) concentration/mol m−3
moles of carbon/mole of iron
concentration of carbon monoxide along the reactor/mol m−3

concentration of haematite in the pellets along the reactor/mol m−3

concentration of hydrogen along the reactor/mol m−3
heat capacity of the gas/J mol−1 °C−1
heat capacity of the solid/J mol−1 °C−1
reduction furnace diameter/m
effective diffusion coefficient for the reducing gas in the Fe phase/m2 s−1
effective diffusion coefficient for the reducing gas in the magnetite phase/m2 s−1
effective diffusion coefficient for the reducing gas in the wüstite phase/m2 s−1

effective diffusion coefficient for the product gas in the Fe phase/m2 s−1

effective diffusion coefficient for the product gas in the magnetite phase/m2 s−1

effective diffusion coefficient for the product gas in the wüstite phase/m2 s−1
gas molar flux/mol m−2 s−1
solid molar flux/mol m−2 s−1
heat transfer coefficient between the gas and solid/J m−2 °C−1
mass transfer coefficient between bulk reactant gas and the surface of the particle/m s−1
mass transfer coefficient between bulk product gas and the surface of the particle/m s−1
reaction rate constant at the haematite/magnetite interface/m s−1
reaction rate constant at the magnetite/wüstite interface/m s−1
reaction rate constant at the wüstite/Fe interface/m s−1
equilibrium constant for the reduction reaction at the haematite/magnetite interface
equilibrium constant for the reduction reaction at the magnetite/wüstite interface
equilibrium constant for the reduction reaction at the wüstite/Fe interface
reactor height/m
partial pressure of component i/N m−2
effective radius of interface between haematite and magnetite in the pellet/m
effective radius of interface between magnetite and wüstite in the pellet/m
effective radius of interface between wüstite and Fe in the pellet/m
pellet radius/m
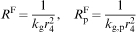
resistance of the interfacial reaction at the haematite/magnetite layer/s m−3
resistance of the interfacial reaction at the magnetite/wüstite layer/s m−3
resistance of the interfacial reaction at the wüstite/Fe layer/s m−3
gas film resistance for the gaseous reactant/s m−3

gas film resistance for the gaseous product/s m−3
resistance of the intraparticle diffusion of the gaseous reactant in the Fe layer/s m−3

resistance of the intraparticle diffusion of the gaseous product in the Fe layer/s m−3
resistance of the intraparticle diffusion of the gaseous reactant in the magnetite layer/s m−3

resistance of the intraparticle diffusion of the gaseous product in the magnetite layer/s m−3
resistance of the intraparticle diffusion of the gaseous reactant in the wüstite layer/s m−3

resistance of the intraparticle diffusion of the gaseous product in the wüstite layer/s m−3
gas temperature along the reactor/oC
solid temperature along the reactor/oC
gas velocity/m s−1
solid velocity/m s−1
volume of the iron layer/m3
reduction rate at the haematite/magnetite interface/mol s−1
moles of carbon monoxide consumed at the haematite/magnetite interface/mol s−1

moles of hydrogen consumed at the haematite/magnetite interface/mol s−1
reduction rate at the magnetite/wüstite interface/mol s−1
moles of carbon monoxide consumed at the magnetite/wüstite interface/mol s−1

moles of hydrogen consumed at the magnetite/wüstite interface/mol s−1
reduction rate at the wüstite/Fe interface/mol s−1
axial coordinate/m
moles of carbon monoxide consumed at the wüstite/Fe interface/mol s−1

moles of hydrogen consumed at the wüstite/Fe interface/mol s−1
heat of reaction for reaction i/J mol−1
bed bulk porosity
porosity of the haematite
oxygen atoms reacting/mole of haematite converted to magnetite = 0·333
oxygen atoms reacting/mole of hematite to convert magnetite to wüstite = 0·555
oxygen atoms reacting/mole of hematite to convert wüstite to iron = 2·112
molar density of iron/mol m−3
average molar density of reducing gases/mol m−3
molar density of haematite/mol m−3
dimensionless axial coordinate
Introduction
The direct reduction process has gained growing importance in recent decades as a source of metallic units for electric arc furnaces. The world production of direct reduced iron (DRI) has grown from near zero in 1970 to 68·5 million tonnes in 2008.1 Midrex technology is the most important one and has ∼58% of the world DRI production.1 The main reactor (i.e. the shaft furnace) in the technology is a moving bed reactor.
The modelling and simulation of the direct reduction process are important objectives since the iron/steel industry is known to be one of the most energy intensive industries. Modelling is, however, a challenging task since there are a number of material and energy flows that interact in unpredictable ways. Early studies of moving gas–solid bed reactors were carried out in the 1950s.2,3 These studies used simple linear models to obtain the dependence of reaction rates on solid temperature in order to solve analytically the reactor model. The validity of these solutions is limited to a narrow range of temperatures. Schaefer et al. 4 carried out a study of the steady state behaviour of the reactor and showed the existence of multiple steady states. Yoon et al. 5 developed a model for a Lurgi type reactor used in the carbon gasification. The authors used the shrinking core model for solid particles while assuming identical temperatures in solid and gas phases. Amundson and Arri6 re-examined the same model while considering different temperatures in both phases. Arce et al.,7 on the other hand, developed a model for a countercurrent moving bed reactor using a shrinking core model for the pellet and a heterogeneous model for the reactor. Rao and Pichestapong8 developed a model for a moving bed reactor by considering that the controlling step is the mass transfer of gaseous reactants in the product solid layer. Takenaka et al. 9 developed a reactor model in which the reduction rate equations were derived from a three-interface model and involved both mass and heat balances. The model rate parameters were determined according to a parameter fitting method. Negri et al. 10 carried out a comparison between one- and three-interface pellet models in the direct reduction of haematite in a moving bed reactor. Parisi and Laborde11 used an unreacted shrinking core model as a basis to model a counter current gas–solid reactor but assumed that haematite is reduced to iron irreversibly. This is an oversimplification since the most difficult reduction step is the one from wüstite to iron, which is highly reversible. The effects of various operating parameters on the performance of the reduction reactor were studied by several authors.12,13 The most important parameters seemed to be the reduction gas temperature and composition. By raising the reducing gas temperature, the gas ratio (H2/CO) necessary to obtain the desired degree of reduction is lowered. Recently, Nouri et al. 14 used the grain model with product layer resistance to simulate the direct reduction reactor. The model considered intergrain diffusion of the porous haematite pellet as well as product layer (sponge iron) diffusion around each grain. Similar to the work of Parisi and Labrode,11 the authors assumed the reduction of haematite to proceed directly and irreversibly to iron.
In this work, we present the derivation and numerical simulations of a model that describes the direct reduction of iron oxides in the reactor. The concept of the shrinking core model8,13 was adopted. A mathematical formulation was obtained that defines the mass flux of the reactant gas in terms of bulk gas phase and pellet properties. A complete pellet model was developed for the DRI using three consecutive reaction schemes. Afterwards, a one-dimensional non-isothermal moving bed reactor model was derived for the furnace. Unlike the previous work, both the kinetics of steam reforming of methane and carburisation are included in the model. Moreover, all the reduction reactions are assumed to be reversible, which is more reminiscent of the actual behaviour in the reactor. The method of orthogonal collocation is successfully applied to the solution of the resulting boundary value problem. This numerical method is known to be efficient in handling moderately steep solution profiles. The simulations were validated against data obtained from a local iron/steel plant. A sensitivity analysis of the effect of key operating parameters was also carried out.
Iron oxide reduction
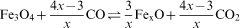
Three consecutive reactions are considered for the reduction of iron oxide ore (haematite). The reduction reactions by hydrogen are represented as follows.
Haematite reduction to magnetite
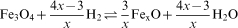

Haematite reduction to magnetite

Pellet model
The three consecutive reactions were used to develop a pellet model based on the shrinking core scheme. The following assumptions were made:
quasi-steady state assumption
the reduction reactions are assumed to take place on three sharp interfaces: the first between iron and wüstite, the second between wüstite and magnetite and the third between magnetite and haematite
the gas diffusivities between the different layers are the same for the reducing gases and are calculated based on bulk gas conditions (a more rigorous model that assumes that gas diffusivities change with composition from one layer to another would complicate unnecessarily the model)
the water gas shift reaction takes place only close to the top gas exit and is modelled as suggested by Negri et al. 15
there is no volume change during the reduction. The reduction process occurs at three advancing interfaces inside the haematite particle (Fig. 1), which proceeds through the following steps:
transport of gas reactant from the bulk gas phase to the outer surface of the solid
diffusion of gas through the porous layer (Fe) to the iron/wüstite interface
a portion of the gas reacts with wüstite to form iron and gaseous products
the balance of the reactant gas diffuses through the porous wüstite layer to the wüstite/magnetite interface
a portion of the diffusing gas in the previous step reacts with magnetite to form wüstite and gaseous products
the balance of the reactant gas diffuses through the porous magnetite layer to the magnetite/haematite interface (unreacted core oxide)
chemical reaction of the gas with haematite to produce magnetite and gaseous products
outward transport of the gaseous products follows an opposite pattern.
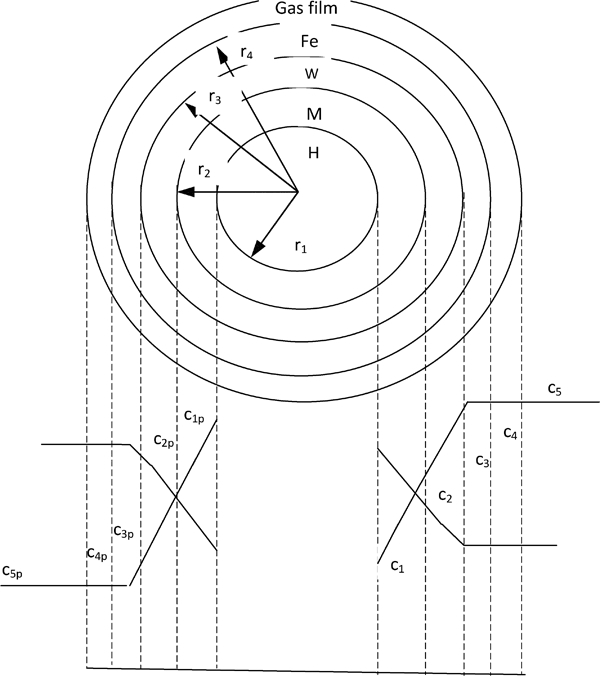
Schematic representation of three-interface pellet mode
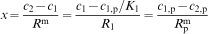
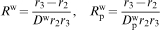
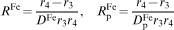
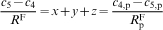
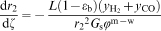
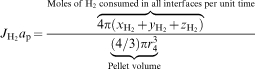
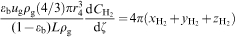
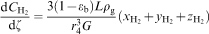
Each step offers resistance to the overall reduction, which is determined by summing up the rates of reduction of the three interfaces. The rate of moving for each interface is determined in terms of rate constants for surface reactions and bulk gas conditions. The key assumption in the model is the quasi-steady state approximation, i.e. the mass flux of the reactant diffusing towards an interface is equal to the amount of the gas reacted plus the remaining amount that diffuses to the following interface. The diffusion of the gaseous product is related to the reactant by the stoichiometric ratio, which is 1∶1 for both hydrogen and carbon monoxide.
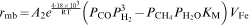
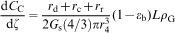
In our derivation, subscripts 1–5 are used to indicate the haematite/magnetite, magnetite/wüstite, wüstite/Fe, Fe/boundary layer and boundary layer/bulk interfaces, as shown in Fig. 1. The reaction rate Ωj of the reducing gas at the pellet interface j is expressed in the following form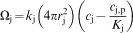
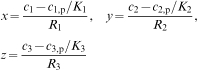


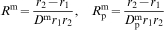

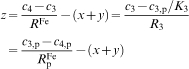
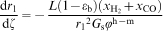
Similarly, the reduction rate in the second layer (wüstite/magnetite) is expressed in terms of the reduction rate in the first layer and the resistances of the intraparticle diffusion of the reactant and product in the wüstite region, i.e.


Reactor model
A moving bed model was developed for the DRI reactor. The following assumptions were used:
steady state operation
both gas and solid streams move in plug flow with no radial temperature or concentration gradients, i.e. one-dimensional model
ideal gas behaviour for the reducing gases
spherical pellets with equal size and with constant voidage of packing
heat transfer from the reactor wall to the surrounding is through an effective convective heat transfer coefficient.
Mass balance – solid phase
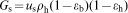
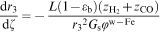
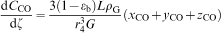
In the first step, mass balance equations are written for iron oxides in the interface positions as particles move down through the reactor. The changes in iron oxides along the bed are represented in terms of the variation in the radii of the shrinking interfaces for the three layers. For the magnetite/haematite interface, the change in the haematite concentration is defined as the oxygen fraction consumed during the reduction at this interface.
Considering a volume of element (π/4)d
t
2
Z, the change in the haematite concentration in the pellets of this element, in terms of the interface radius, can be expressed as follows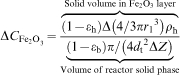
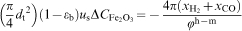

Introducing the dimensionless reactor height
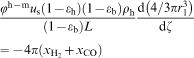

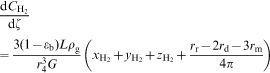
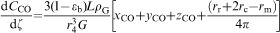
Mass balance – gas phase
Two mass balance equations are written for the reducing gases: one for hydrogen and the other for carbon monoxide. The hydrogen molar balance in the element (π/4)d
t
2
Z is given by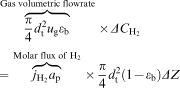


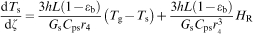
Energy balance – solid phase
The differential heat balance for solid relates the change in solid temperature along the bed with the heat transferred from the gas phase into the solid phase and the heat generated or consumed by the reduction reactions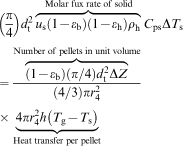
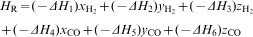
The heat capacity of the solid is given by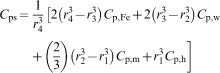
Energy balance – gas phase
The heat balance for the gas phase is written as follows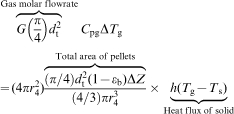
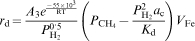
Model modification to account for steam reforming and carburisation
In this part, we include the effect of the other side reactions that could occur in the reduction reactor. All these reactions are assumed to take place on the iron layer. These reactions are the following.
Steam reforming reaction16


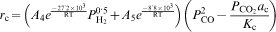
Carbon monoxide disproportionation18


The reactor model includes two additional mass balances in the gas phase: one for methane consumption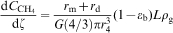
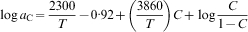
The carbon activity a
c is based on the formula given by Chipman19
The solid differential heat balance equation (38) is also modified to include the heat of all side reactions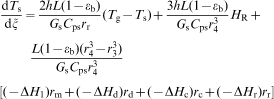
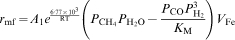
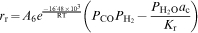
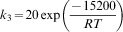
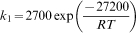
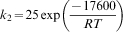
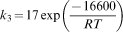
Kinetics
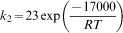
The kinetics used in this work are those developed by Tsay et al. 20,21
For hydrogen production, the kinetic rate constants are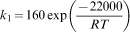
Assumptions for transition and cooling zones
The main role of the transition zone is to carburise the product iron, which saves energy in the subsequent refining in the electrical arc furnace. As to the cooling zone, its main role is to cool down the product iron. The gas temperature profiles in the transition and cooling zones are very steep because the flowrate of gas is small while that of the solid is large, resulting in a large temperature increase. The solution of the models for both transition and cooling zones may lead to difficulties in convergence because of the severe steepness of the profiles. For this purpose, we made a simple analysis to approximate the events taking place in the transition zone. We assumed that 95% of the methane in the transition zone decomposes into carbon and hydrogen and that 5% of the hydrogen is used in the further reduction of iron oxides. As to the cooling zone, the methane decomposition is very minor and could be neglected.
Numerical methodology
The method of orthogonal collocation is used to solve the boundary value problem. The main advantage of this technique is its adequate representation of the model with minimum number of variables and its capability of solving moderately steep profiles. It is known that the solid temperature rises quickly as it enters the reactor from about ambient temperature to reaction temperature. Afterwards, the solid temperature changes slowly past the entry zone. Soliman22 developed a spline collocation method that is suitable for this kind of problems. The method is based mainly on subdividing the domain into zones in which the profile is fitted by a spline polynomial. For the boundary between the zones, proper continuous conditions are imposed. Thus, we can have the first spline point that divides the temperature profile into a fast and slow changing zone. Then, we have two consecutive zones representing the points at which two of the three moving fronts reach the centre of the iron ore pellet. Moreover, in order to obtain an adequate initial guess for the problem, we start by solving a simple problem whose solution is known. For our case, a reactor with zero length will have the boundary conditions as its solution. This solution is used as an initial guess for a reactor with a small length δ l. The solution of this problem is the initial guess for a problem with a reactor of length 2δ l. These iterations are continued until the required reactor length is recovered. This elementary length δ l is used as an adjustable parameter when convergence problems are encountered.
Results and discussion
The numerical simulations were carried out using the design and operating parameters shown in Table 1. These parameters are associated with a local iron/steel plant. In the start of the simulations, we study the selection of the number of collocation points needed for the numerical simulation. Figure 2 shows the effect of collocation points on the calculated profiles of gas temperature. When the number of collocation points is 4, some oscillations could be seen in the profile. Increasing the number of collocation points to 6 yields a smooth profile, while further increase to 7 does not yield any improvement. Therefore, the number of collocation points chosen in the computations is 6. It can be seen from Fig. 2 that since the gas is fed countercurrently to solid, the gas temperatures decreases starting from the dimensionless distance of 1 (bustle gas) to the dimensionless distance of 0 (top gas). This decrease is due to the endothermic nature of the reaction and to the fact that the solid is fed at colder temperature. Figure 3 shows the profile of the solid temperature. The profile is quite close to that of the gas temperature. Table 2, on the other hand, shows the results of the validation against plant data. Only dry gas composition is available for validation. The sampling is carried out in the real plant after the scrubber, i.e. at low temperatures. The results of the table show overall satisfactory agreement, in consideration that measurements errors are quite possible.
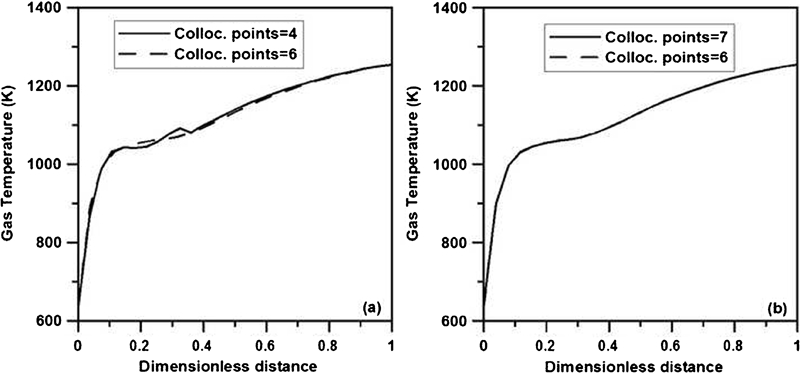
Effect of collocation points on gas temperature profile
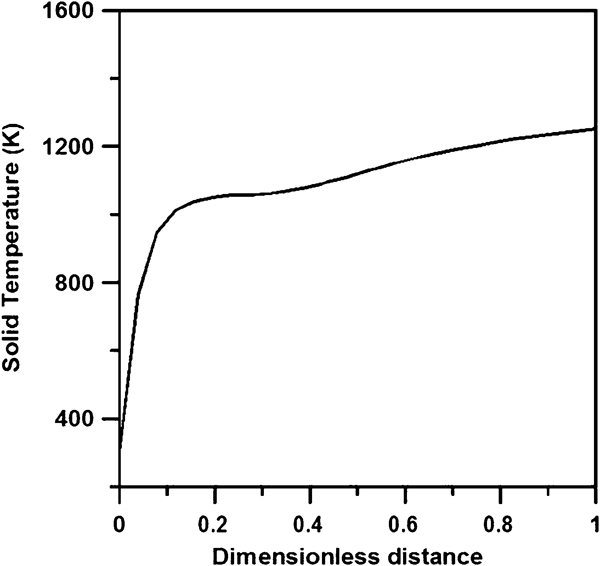
Profile of solid temperature for collocation point number of 6
Nominal and design parameters of reactor
Comparison between plant data and model results at exit conditions for top gas dry analysis
Figure 4 shows the effect of some operating parameters on the profile of the gas temperature. The figure shows that for an increase in the bustle gas flowrate (from a ratio of 1068∶1100), the gas temperature starts from the same values at the bustle gas side (dimensionless distance of 1) but then yields larger values of gas temperature compared to the base case. This is due to the fact that a smaller residence time causes less endothermic reduction, and for the same heat input, the increase in the flowrate causes a less decrease in temperature drop, which means a larger gas temperature compared to the base case. A decrease, on the other hand, in bustle gas temperature (from 1249 to 1204 K) causes evidently a decrease in gas temperature. A decrease in methane fraction (from 5·6 to 3·6%) causes less reforming and less decrease in temperature drop, causing an increase in gas temperature compared with the base case.
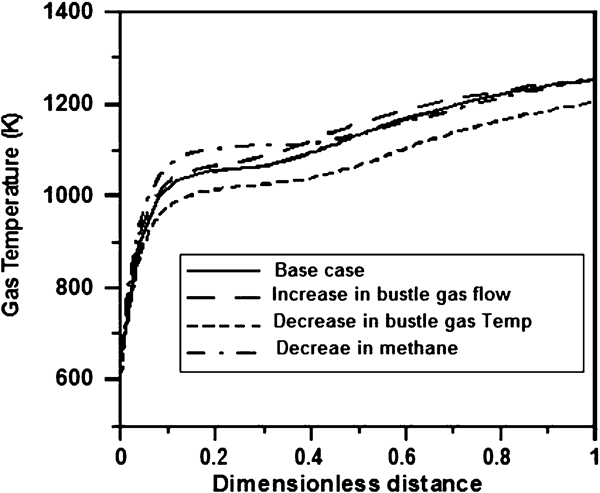
Effect of some operating parameters on profile of gas temperature
Figure 5 shows that a decrease in the ratio of H2/CO (from 1·84 to 1·45) causes a less decrease in temperature drop and, hence, an increase in the gas temperature. The reason is that the reduction by carbon monoxide is less endothermic than by hydrogen. This causes excess heat and therefore less temperature drop. Figure 5 also shows that a decrease in the reductant/oxidant ratio (H2+CO)/(H2O+CO2) causes a less temperature drop because of less availability of reducing gases.
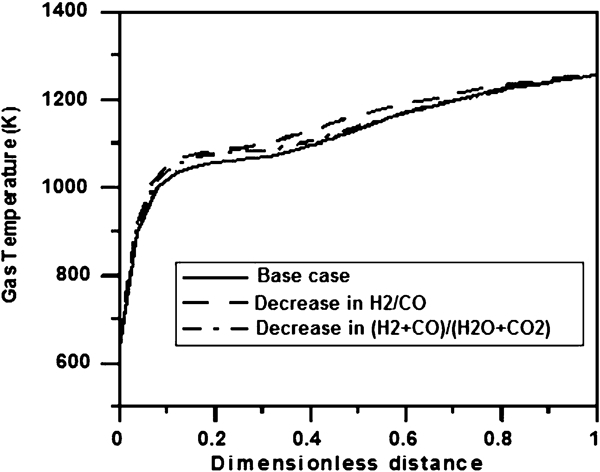
Effect of some operating parameters on profile of gas temperature
The profiles of the thickness of the different layers with the distance are shown in Fig. 6. It can be seen that the third layer of FeO is the controlling step as it decays much slower than the layers of Fe2O3 (layer 1) and Fe3O4 (layer 2). The effect of some operating parameters on the thickness of the layers is shown in Figs. 7 and 8. This effect is similar for the three layers, so only the first layer is chosen for the simulations. It can be seen from Fig. 7 that an increase in the bustle gas flowrate results in more reduction, which results in the layer to decay quicker than the base case. The decrease in the bustle gas temperature induces less reduction so the layer decays much slower. A decrease in the ratio of H2/CO, on the other hand, yields larger temperature and therefore more reduction, causing the layer to decay quickly. Figure 8 shows that a decrease in the reductant/oxidant ratio causes less reduction and therefore less temperature drop, resulting in high temperatures. This results in a faster decay of the layer. A decrease, on the other hand, in methane mole fraction can be seen to decrease the temperature drop, so it has a similar effect to the increase in reductant/oxidant ratio.
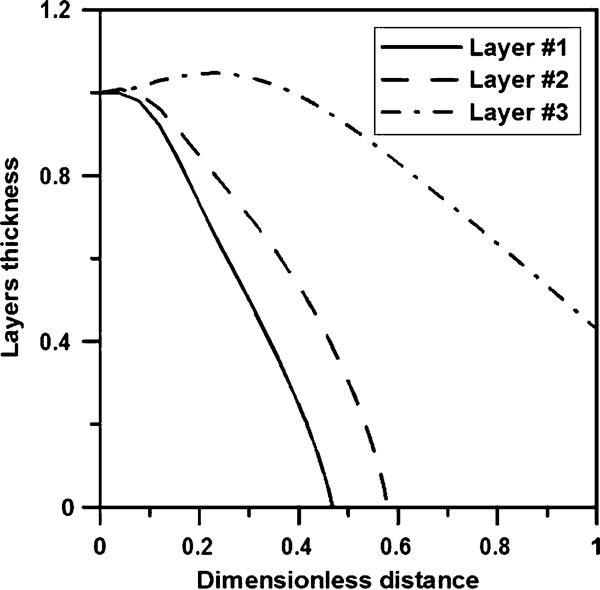
Profile of thickness layers
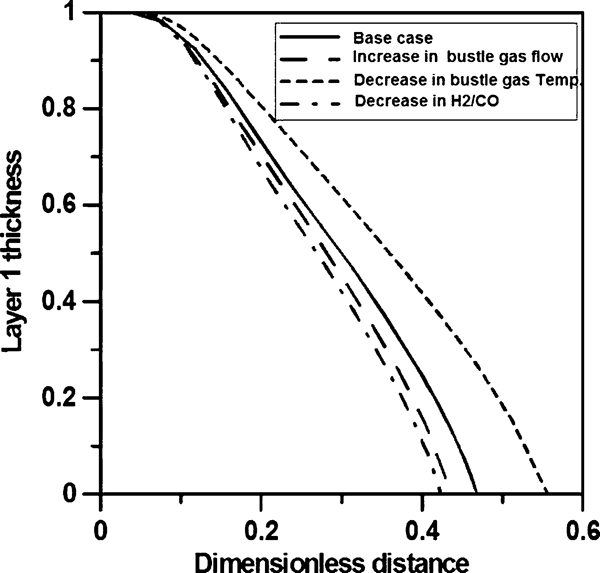
Effect of some operating parameters on profile of thickness layer
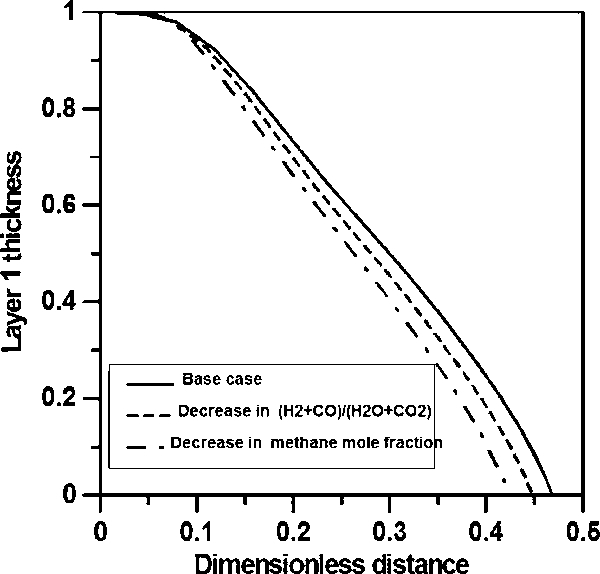
Effect of some operating parameters on profile of thickness layer
Having studied the variations of the local profiles, we show the simulations for the overall performance of the reactor. Figures 9– Figure 10 Figure 11 Figure 12 Figure 13 Figure 14 Figure 15 Figure 16 Figure 17 18 show the effects of key operating parameters on the metallisation degree and carbon content. Figures 9 and 10 show the effect of a change in bustle gas temperature. The decrease in this temperature causes a reduction in the gas temperature, and this leads to less reduction and therefore less metallisation. A decrease in bustle gas temperature, for instance from 1300 to 1200 K, decreases the metallisation degree from 98·3 to 86·6%. Figure 10 shows the effect on carbon content. Carbon comes primarily from methane and then from CO. A larger gas temperature causes more decomposition and therefore more carbon content. It can be seen that a decrease in bustle gas temperature from 1300 to 1200 K decreases the carbon content from 0·62 to 0·22%.
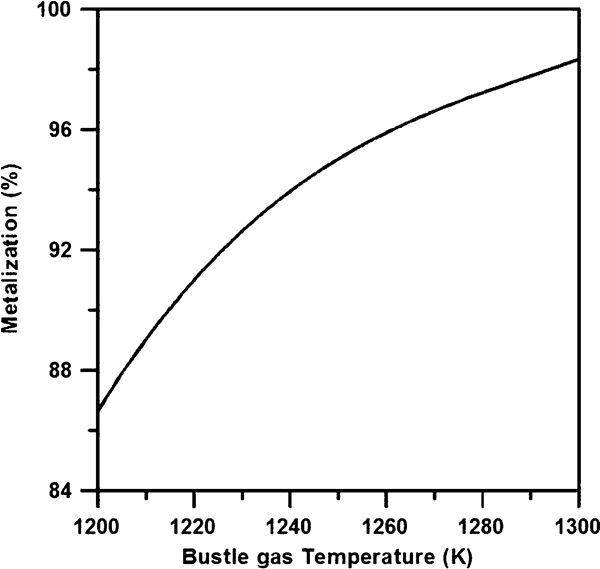
Effect of bustle gas temperature on metallisation
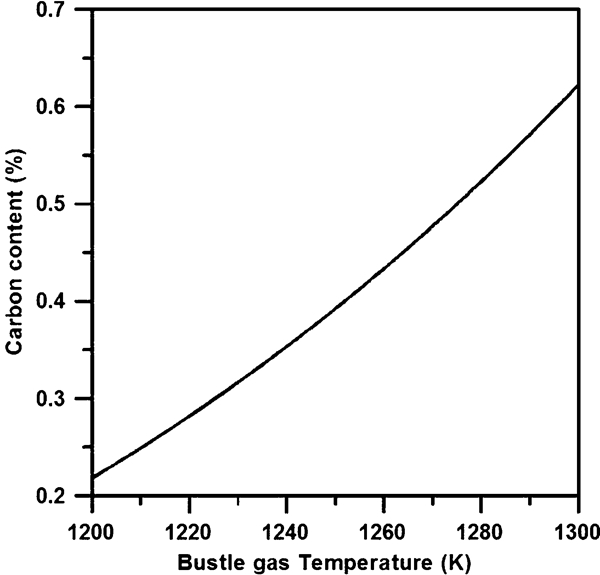
Effect of bustle gas temperature on carbon content
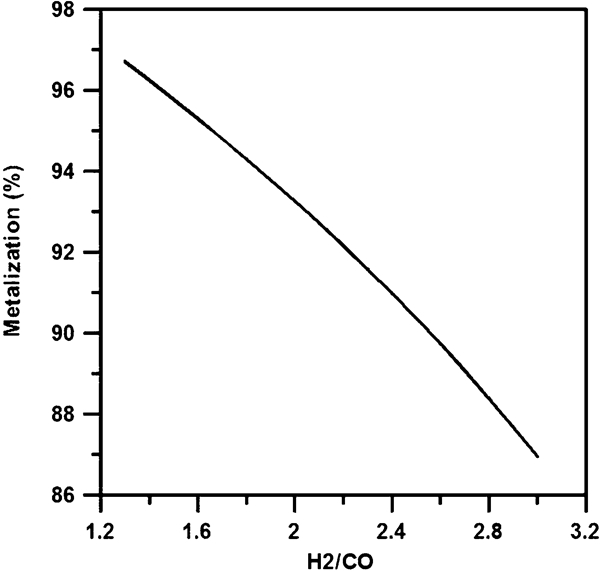
Effect of H2/CO on metallisation
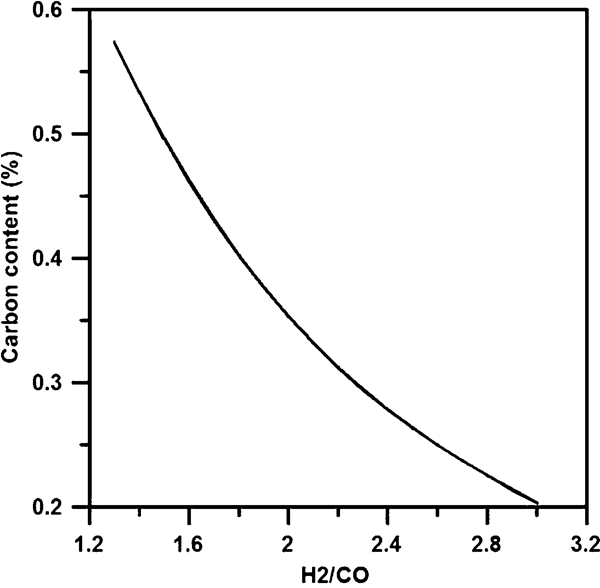
Effect of H2/CO on carbon content
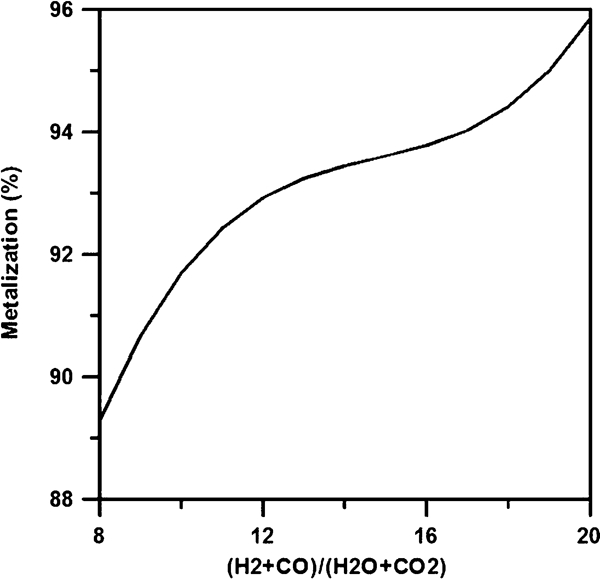
Effect of (H2+CO)/(H2O+CO2) on metallisation
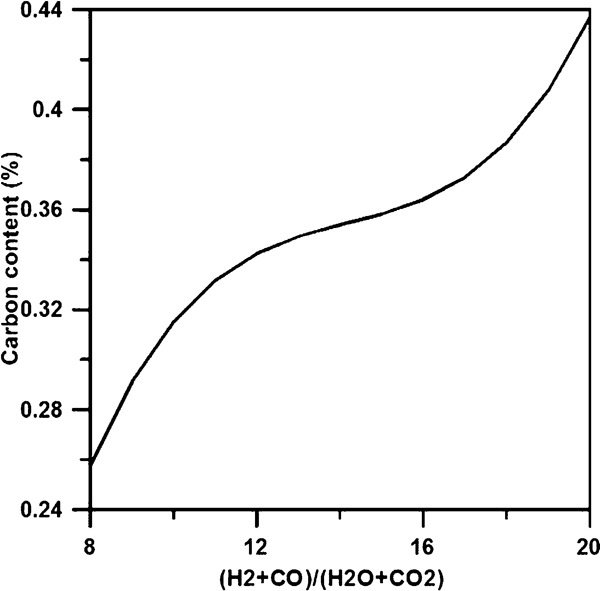
Effect of (H2+CO)/(H2O+CO2) on carbon content
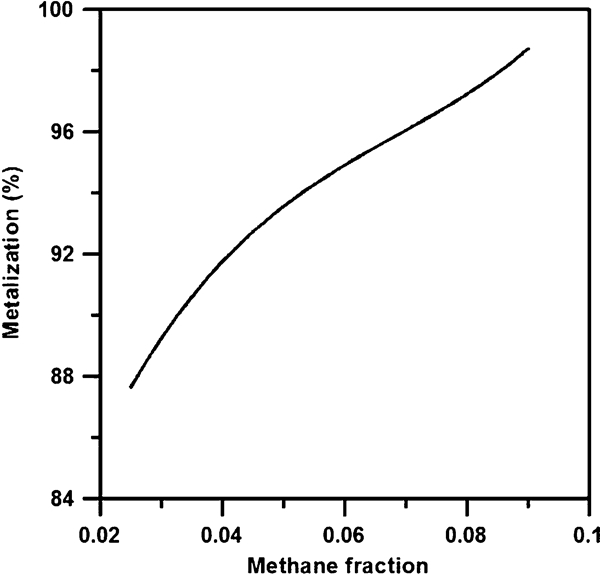
Effect of methane feed percentage on metallisation
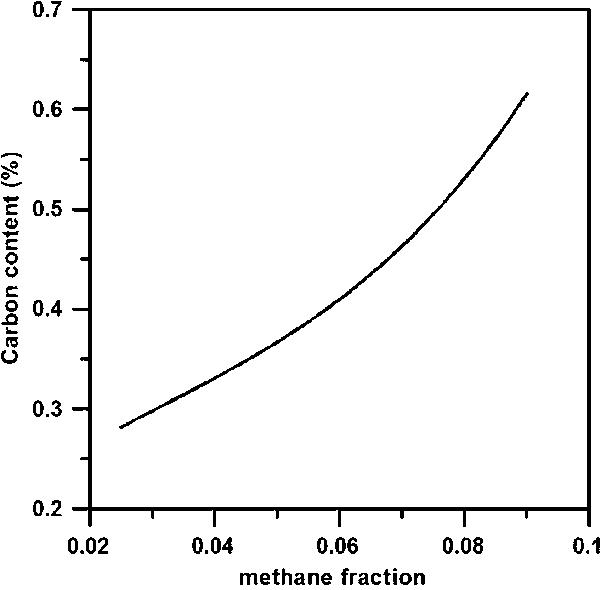
Effect of methane feed percentage on carbon content
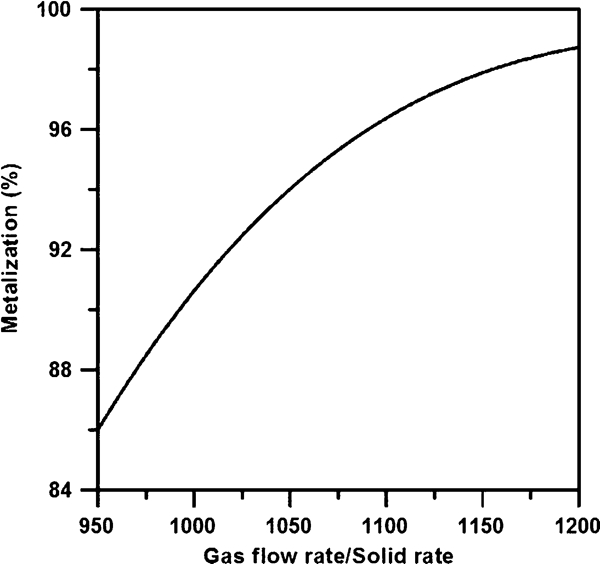
Effect of gas flowrate/solid rate on metallisation
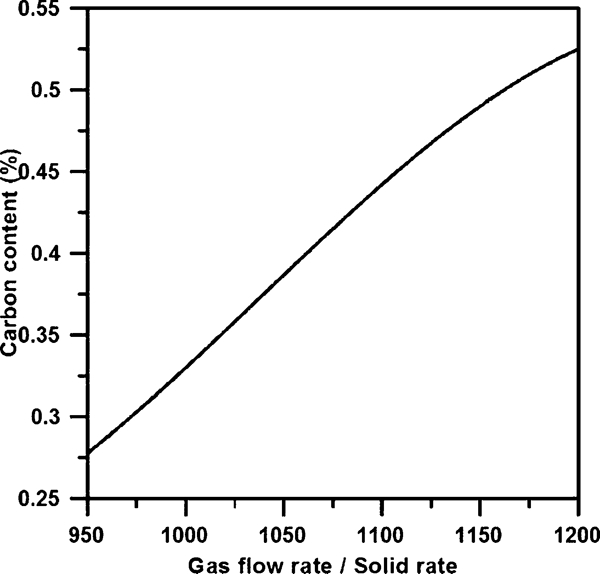
Effect of gas flowrate/solid rate on carbon content
Figures 11 and 12 show the effect of the ratio H2/CO. Generally, this ratio is constrained between 1·2 and 2 to avoid carbon deposition. The decrease in the reductant ratio leads to better metallisation because carbon monoxide is a better reductant than hydrogen as the overall reaction of CO is exothermic and the temperature therefore remains high. The decrease in the ratio H2/CO also means more CO and therefore more reduction and more carbon formation. A decrease, for instance, in the ratio of H2/CO from 2 to 1·3 leads to an increase in the metallisation degree from 93·3 to 96·7% and an increase in the carbon content from 0·35 to 0·57%. Figures 13 and 14 show the effect of the reductant/oxidant ratio. Similarly to the H2/CO ratio, the reductant/oxidant ratio is generally constrained between 10 and 14. The decrease in this ratio evidently reduces the degree of metallisation because there are less available reducing gases. The carbon content also decreased because of the decrease in CO. For instance, a decrease in the reductant/oxidant ratio from 14 to 10 leads to a decrease in the metallisation degree from 93·5 to 91·7% and a reduction in the carbon content from 0·36 to 0·26%. Figures 15 and 16 show the effect of methane mole fraction. The decrease in mole fraction reduces the metallisation because it leads to less reforming. The carbon content has decreased because of less methane decomposition. For instance, a decrease in the methane mole fraction from 9 to 2·5% reduces the metallisation degree from 98·7 to 87·6% and also the carbon content from 0·62 to 0·28%. Finally, Figs. 17 and 18 show the effect of the ratio of gas to solid feedrates. The increase in this ratio leads to more reducing gases, i.e. hydrogen and carbon monoxide, and therefore to more metallisation. This also yields more decomposition of methane and therefore more carbon content. An increase, for instance, in the ratio of gas to solid feedrate from 950 to 1200 leads to the increase in the metallisation degree from 86 to 98·7% and also an increase in the carbon content from 0·28 to 0·53%.
Conclusions
A detailed model based on shrinking core pellet was developed for a direct reduction reactor. The models for the transition and cooling zones were approximated by simple algebraic equations since a detailed model in these zones would result in too steep profiles (and stiff problems), while a small extent of methane decomposition takes place in the transition zone and even less in the cooling zone. The model was solved using a spline collocation method for the base case to obtain local profiles of temperature and layers thicknesses and was subsequently used for a sensitivity analysis of the effect of reactor operating parameters. Satisfactory results were obtained when the model was validated against gas dry compositions, the only data available from a local plant. The effects of model parameters on the metallisation degree and carbon content permitted the construction of useful plots showing the effects of bustle gas temperature, reductant ratio, reductant/oxidant ratio, methane mole fraction as well as the ratio of gas/solid feedrates. The results of the sensitivity analysis may be helpful in further optimisation studies of the unit.
Footnotes
Acknowledgements
This work was made possible by a generous grant from the National Plan for Science and Technology (project no. 08-ENE337-2).