
Abstract
A range of iron ores were used in varying proportions to prepare 28 different ore mixtures. Each mixture was classified according to its granulation index and sintered in a pilot plant. The resulting sinters were characterised by chemical analysis, degradation during reduction in the blast furnace (reduction degradation index test), cold strength (tumbler test), coke consumption and process productivity. Sinter quality was assessed in relation to the granulation index of the ore mixture.
Introduction
The blast furnace demands quality sinter with high cold strength [as determined by the tumbler index (TI)], a low reduction degradation index (RDI), high reducibility, little variation in chemical composition, an appropriate particle size (screened between 12 and 35 mm) and the lowest possible fine content.
In the sintering process, the mixture of iron ores, fluxes and coke is subjected to granulation, which consists of homogenisation in a rotary drum for several minutes with the addition of 6–8% water. The granules thus formed are then loaded onto the sintering grate, where their temperature is raised to between 1250 and 1325°C to produce a semimolten material which, during subsequent cooling, crystallises into various phases, mainly haematite, magnetite, ferrites and silicates. 1 1,2
The granulation stage is highly important because the granule size distribution is directly related with bed permeability and productivity, and it is possible to design the desired granule size, for a given ore mixture, in order to produce a specific sinter microstructure.
Granulation efficiency directly influences the bed permeability and the air flowrate through the bed, the flame front descent rate and the bed temperature profile versus time.3 – 6 The granulation behaviour of a ore mixture will determine the structure and composition of the formed granules and the granule’s influence on the local sintering reactions.
The present work considers 28 different ore mixtures prepared using iron ores classified according to their granulation index (G index). Each mixture was sintered in a pilot plant, and the sintering fitness of each mixture was studied as a function of the G index.
Granulation
Granulation treatment is of basic importance for the sintering of iron ores since good sinter bed permeability largely determines the process rate and thus the plant productivity. The first studies on the structure of granulated ore mixtures were performed by researchers at Nippon Steel Corporation, who coined the term quasi-particle.7 – 9 Quasi-particles are formed by a haematite nucleus, which remains unmelted during sintering, surrounded by finer ore grains with silicon gangue in the presence of high basicity (CaO/SiO2). Particles >0·7 mm act as nuclei, and those <0·2 mm act as adherent fines.
During sintering, the layer adhered to the nucleus experiences the formation of silicoferrites of calcium and aluminium (SFCA) due to the solid–liquid reaction between haematite and a CaO.FeO flux that contains small amounts of SiO2 and Al2O3, i.e.
Granulation index
Classifying the iron ores that form part of an ore mixture for sintering according to their granulation behaviour makes it possible to predict the type of sinter obtained. Nippon Steel Corporation defines the G index for ore grain size classification, from the point of view of sintering behaviour, using the expression7

The G index has been established as a result of the practical observation that some fractions present positive granulation behaviour while others behave negatively. Thus, the N fraction, with particles of between 0·7 and 8 mm in size, constitutes an excellent base for the formation of granules. The F fraction, with a particle size of <0·2 mm, adheres to the N fraction particles due to its fineness and can be assimilated to form stable granules. However, the M fraction, with particles of between 0·2 and 0·7 mm, is not desirable since these particles are not large enough to constitute stable nuclei and are not fine enough to be adhered. The M fraction remains free and can become lodged in the gaps left between the granules, thus harming the bed permeability and reducing the process productivity.
The G index classifies ore particles into four groups: A, B, C and D, in order of decreasing/increasing fineness, with group A corresponding to coarse ores and group D to very fine ultraconcentrates. The following limits are established for these groups
group A: G index of ⩽15
group B: G index of 15–35
group C: G index of 35–70
group D: G index of ⩾70.
Applying the G index to individual ores allows obtaining an optimum ore mixture for sintering from the point of view of grain size composition. Another very interesting application is the possibility of replacing certain ores with others from the same group of G index values.
Granulation index classification of ores
Iron ores form part of the mineral mixtures used to produce sinters. Sinter properties are analysed considering the ores that make up their composition and the parameters used in sintering: bed height, return fine percentage and basicity index.
Table 1 lists 30 iron ores used by Arcelor-Mittal in its 200 m2 sinter strand, ordered from coarsest to finest and classified according to different criteria.4 It can be seen that the classification of the ores is similar, whichever criterion is chosen, but the classification according to G index is selected because it is considered more complete.
Granulometric classification of iron ores4
Before the appearance of concentrated ores, the granulometric index used was the <0·125 mm fraction, since at first the granulometries of all the ores were highly similar, and it was sufficient to characterise one point on the curve in order to obtain complete information about the entire curve. The granulometric curve area index11 is related to the fineness of the ore. This index aims to assign each fraction of the granulometric curve to the weight that it really has in sintering, and for this reason, the abscissa axis is used with a logarithmic scale, which assigns greater weight to the finer particle sizes. This index is defined as the area contained between the granulometric curve of the ore and the abscissa axis. The average size is obtained by weighting the average value of each interval into which the granulometric curve has been divided according to the weight of the ore contained in each granulometric interval.
The D 50 granulometric mean is defined as the index that determines the median of the mixture’s granulometric distribution curve, i.e. the size both above and below which there is the same weight of ore. This index represents a certain attempt to improve the forecast using all of the granulometric curves and not just one single value. Its disadvantage is that it considers with the same weight, both fine and coarse sizes, when the former has greater importance in sintering.
The G index classifies iron ores as follows:
group A: CVRD-Carajas, Hamersley, MBR-Brazil and Robe River
group B: Andaluza, Nimco, SNIM-Acid and SNIM-Tazadit
group C: Goa Siliceous and San Isidro
group D: PRESUR.
In tests carried out in the sintering pot, varying the G index between 6 and 198, the optimum coke consumption was seen to correspond to mixtures containing ⩾50% group A ores, ⩽35% group B ores (where A+B>68%), ⩽12% group C ores and ⩽5% group D ores (where C+D<12%).4 In other words, the best results for good granulation are obtained when the G index values fulfil the following conditions
A+B>68
C+D<12.
Sinter production in pilot plant
At its Gijón works, the steelmaking company Arcelor-Mittal operates two sintering plants with effective sintering areas of 200 and 281 m2 respectively to produce 5·0–5·5 million tons of sinter each year. This sinter is used as burden material in the two blast furnaces operating at Gijón, each with a hearth diameter of 11·3 m and a working volume of 2349 m3, which between them produce 3·8–4·3 million tons of pig iron each year.
The present joint Arcelor-Mittal–CENIM research has involved the production of several series of sinters in CENIM’s pilot plant in the Arcelor-Mittal Gijón works. The pilot plant has a sintering pot of 40×40 cm in cross-section and 60 cm in height and is equipped with a suction circuit capable of creating a reduced pressure (depression) of >14·7 kPa, a propane fired ignition system and a system for measuring the gas input volume and gas output temperature.
Raw materials used
CENIM has used a series of iron ores, fluxes and coke consumed routinely in the Arcelor-Mittal sintering plants at Gijón. Table 2 shows the chemical analysis of the iron ores. They are all haematite based in nature, except for the PRESUR ore, which is magnetite base. They all have high iron content. A broad characterisation of these ores has been published elsewhere.12 Table 3 shows the results of granulometric analysis. Some ores present a mean size of >2 mm, which is beneficial for the good permeability of the resulting ore mixture.
Chemical analysis of iron ores/wt-%
*CL: Calcining losses.
Granulometric analysis and G index of iron ores/wt-%
Size analysis on frozen element (SAFE) granulation fitness test
The SAFE test13 makes it possible to know the final state of granulation of an ore or an ore mixture, since it is carried out on granules that are consolidated by freezing, determining their size distribution by means of a normal laboratory screening procedure. To carry out the test, 1 kg of iron ore is placed on a metallic tray, which in turn is placed inside a freezer at a temperature of less than –20°C for 90 min. The moisture in the granules solidifies, affording them the necessary solidity to be screened in a screening unit at 3000 vibrations/ min for 10 min. The screen tower is maintained at a low temperature by means of ice, which is packed between the double walls of a metallic container. The granule size distribution is determined by weighing separately the fractions retained in the different screens. No additives are added to the ore mixture. Stainless steel sieves of ASTM series, 21 cm diameter, are used.
Table 4 compares the INITIAL and SAFE granulometries of each of the ores. All the ores present good granulation fitness except for the Nimco ore, whose average size only increases from 2·50 to 2·77 mm. The Andaluza ore shows particularly good granulation fitness, with its average size increasing from 2·04 to 3·87 mm, while the Goa Siliceous ore increases from 1·00 to 3·44 mm. This means that the Goa Siliceous and Andaluza ores are important components of the ore mixture since their inclusion helps achieve greater permeability in the sintering bed and consequently greater productivity.
Size analysis on frozen element test of iron ores
Composition of ore mixtures
Table 5 shows the component percentages of the ore mixtures used to manufacture the sinters. The work of Formoso et al. 4 details the evolution of stockpile composition in Arcelor-Mittal each year over a 12 years period (from 1987 to 1998), classifying the ore mixture used in the sinter strand by G index groups. Recoveries, in the form of steelmaking byproducts such as rolling mill scale, Linz–Donawitz sludge, throat dust and return fines, account for a high percentage (15–23%) of the stockpile composition mixtures.
Ore mixture composition/wt-%
Taking into account the experience acquired in the previous work,4 the present work planned specific component percentages of the ore mixtures and used a 19·3% recovery rate in each ore mixture; the 19·3% of recoveries formed by:
return fines: 8·2%
limestone: 5·4%
Linz–Donawitz slag: 2·5%
millscale: 2·2%
screened out pellets and coarse materials: 0·7%
flue dust: 0·3%.
Mixtures M1–M14: These mixtures were prepared by varying the percentages of ores classified in G index group A and leaving unchanged those corresponding to the other groups. The total percentage of group A ores is 50·5% in all the mixtures.
Mixtures M15–M20: The percentages of group B ores were varied and the other groups left unchanged. The total percentage of group B ores is 20·4% in all the mixtures.
Mixtures M21 and M22: The percentages of group C ores were varied, and the other groups left unchanged. The total percentage of group C ores is 8% in both mixtures.
Mixtures M23–M28: The percentages of ores in all the groups were varied. These mixtures were prepared using group A and B ores in increasingly smaller proportions, which diverged from the ideal condition, i.e. A+B<68. The aim was to compare the properties of sinters prepared with these mixtures with those of sinters prepared using mixtures that fulfil the ideal composition in terms of the G index. In a similar way, mixtures were prepared using group C and D ores in increasingly large proportions that diverged from the ideal condition, i.e. C+D>12.
Sinter production
Various series of sinters have been produced in the pilot plant using the mineral mixtures prepared as described above. The production conditions were:
added heat in ignition: 21 Mcal t−1 of sinter
ignition time: 90 s
working depression: 1300 mm water column
bed height: 50 cm
return fines: 25%
hearth layer: 3 cm.
Each test was carried out in triplicate to square the balance between return fines added and return fines produced.
Results and discussion
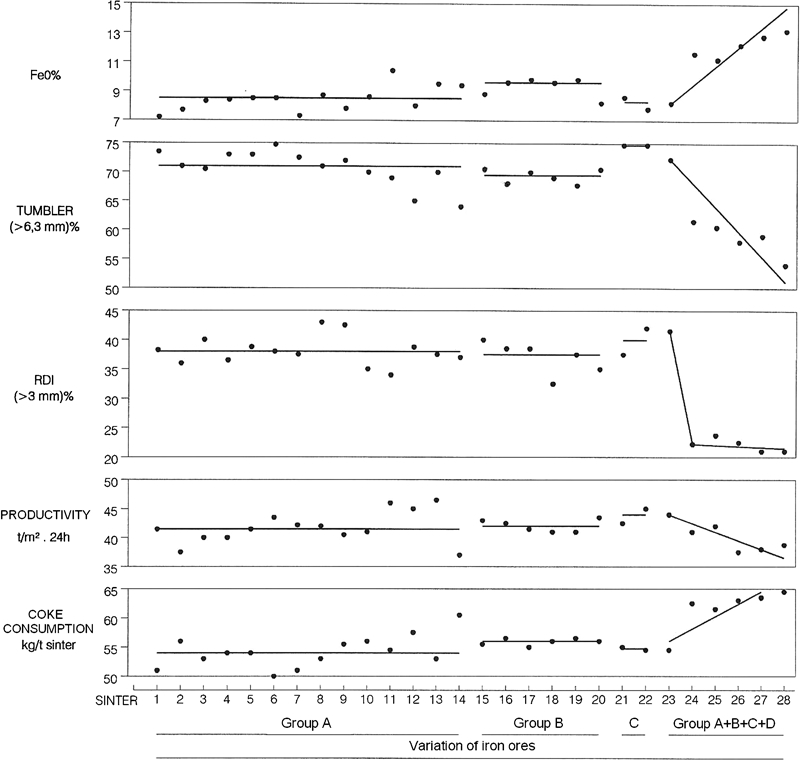
Table 6 shows the results obtained for the sinters produced with the different ore mixtures. Table 7 shows the results of the chemical analysis of sinters, and Fig. 1 shows the variation in sinter properties for the sinters produced.
FeO content, TI, RDI index, productivity and coke consumption of sinters
Sintering made in pilot plant with ore mixtures
Chemical analysis of sinters/wt-%
Sinter composition
Sinter is the main ore mixture used as burden material in the blast furnace. The sinters produced in the present research have a total iron content of 55–58% and a low impurity content (Table 7). Considering the results of the chemical analysis, these sinters are suitable for processing in the blast furnace.
The sinters present an FeO content of 7–14%. The FeO content is an important control parameter in a sintering plant. When the chemical composition of an ore mixture is fixed, the FeO content can provide an indication of the sintering conditions, in particular the coke consumption.14 In Fig. 1, it can be seen that the FeO content in sinters S1–S22 remains within a limited range, whereas in sinters S23–S28, the FeO content rises as a consequence of the greater magnetite PRESUR ore content. This higher FeO content leads to an improvement in the RDI (lower RDI values) but worsens the strength, reducibility, productivity and coke consumption.
The sinters present a low Al2O3 content, in the order of 1·1–1·8%, which is beneficial. The most damaging effect of alumina is to worsen the RDI, which increases as the alumina content rises. Industrial experience with the blast furnace shows that when the sinter contains 10–11%CaO, an increase of 0·1% in the Al2O3 content raises the RDI by 2 points.15
The MgO content of the sinters was between 0·7 and 2%. In research on the influence of MgO additions on sinter properties, it has been observed that the most important effect is to reduce the haematite and SFCA content and increase the magnetite content. Most of the MgO was bonded by magnetite to form (FeMg)O.Fe2O3 type spinels. MgO also seems to stabilise the olivines and pyroxenes in the slag.16
The CaO content of the sinters varied between 8 and 11%. Limestone was added to the ore mixture in order to obtain sinters with basicity (CaO/SiO2) in the 1·4–1·9 range, which is the optimum. CaO combines with the iron oxides to form compounds with a low melting point, which favours the formation of the primary melt during the process of assimilation of the ore mixture components at high temperatures (>1000°C), and a minimum level of this melt is needed to produce a sinter of high strength. These compounds are Fe2O3.CaO (1216°C) and FeO.CaO (1120°C).
The SiO2 content of the sinters was stable at 5–7%, even though the silica content of the ores varied over a broad range, from very low values (0·50%) to very high values (16·40%) (Table 1). The reason for this is that the preparation of the ore mixtures tended to average out the values. SiO2 combines with FeO and CaO to form compounds with a low melting point, favouring the formation of the primary melt: FeO.SiO2 (1180°C), 2FeO.SiO2 (1205°C), FeO.SiO2.CaO (1223°C) and Fe2O3.SiO2.CaO (1192°C).
Figure 2 shows the structure of an area of a particle on a sinter S1 sample obtained by SEM. It is possible to see the presence of haematite, precipitated magnetite, SFCA, gangue and pores.
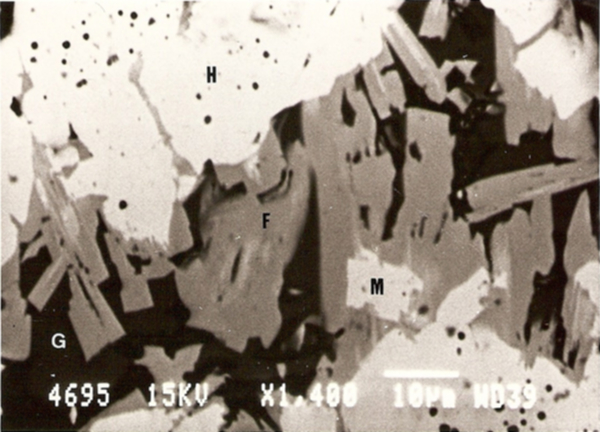
Close view of particle located in sinter sample S1 (×1400): presence of (dark) gangue and (black) pores (H: haematite, M: magnetite; F: ferrite)
Average sinter size
In Table 6, it can be seen that the average size was in the 24–32 mm range, which is suitable for loading into the blast furnace. In Arcelor-Mittal,4 for the period 1987–1998, the average sinter size remained steady between 20 and 25 mm, somewhat smaller than that obtained in the present research.
Bed permeability
Table 6 displays cold permeability values corresponding to the instantaneous measurement of air consumption taken 2 min after completing the ignition of the sintering pot. These values ranged between 4·5 and 6·5 m3 min−1. Hot permeability corresponds to the lowest air consumption value. The minimum consumption point occurs after 60% of the total sintering time has passed. The total sintering time was 25 min. The hot permeability values are in the 4·1–5·2 m3 min−1 range.
The cold permeability of sinters S1–S22 to the air flow passing through the sintering bed remained within the interval of 5·7–6·6 m3 min−1, whilst the corresponding hot permeability is 4·5–5·2 m3 min−1. For sinters S23–S28, there is a progressive decline in the cold permeability (4·5–5·8 m3 min−1) and hot permeability (4·1–5·0 m3 min−1). This is due to the increasing incorporation of PRESUR ore fines in ore mixtures M23–M28, which leads to poorer granulation and consequently a loss of permeability.
Coke consumption
Table 6 shows that the coke consumption varied between 50 and 65 kg t−1 of sinter. It can be seen that the sinters produced with varying proportions of group A ores and constant percentages of ores from the other groups (sinters S1–S14) required the same order of coke consumption as the sinters produced with varying proportions of group B ores (S15–S20) or group C ores (S21–S22).
The coke consumption for sinter S14 was the highest of all group A ores (60·3 kg t−1 of sinter). This sinter had been produced with ore mixture M14 using 50·5% Robe River ore (Table 5). The use of this mixture is not recommended because, in addition to its high coke consumption, it also presents low productivity and a low TI (Fig. 1).
When the percentages of all the ores were varied (S23–S28), coke consumption rose, and the productivity and strength of the resulting sinters decreased; sinters should not be produced using mixtures M23–M28.
Productivity
Table 6 shows the productivity values ranging between 37 and 47 t m−2 per 24 h. As in the case of coke consumption, similar values are seen for productivity in sinter series S1–S14, S15–S20 and S21–S22. For group A ores, the lowest productivity was obtained with S14, which includes 50·5% Robe River ore in ore mixture M14. Series S24–S28 presented notably lower productivity values (Fig. 1).
Reduction degradation index test
The degradation of sinter during low temperature reduction is determined by the RDI test.17 The RDI of the sinters ranged over a very wide interval, between 21 and 43% (Table 6). Low RDI values are desirable. Sinter degradation takes place during its reduction in the blast furnace, in the low temperature zone (850–950°C), and has a harmful effect on the strength of the burden in the furnace, with the consequent loss of permeability to reducing gases and an increase in coke consumption.18
Degradation is originated to a certain extent in the transformation that takes place during the reduction of haematite to magnetite, accompanied by an increase in volume that gives rise to the presence of structural stresses in the sinter.19
The RDI improved for sinters S23–S28 due to the fact that ore mixtures M23–M28 incorporated the magnetic PRESUR ore in increasing percentages, thus raising the FeO content (Fig. 1). Higher FeO levels mean an increase in magnetite, Fe3O4 (or FeO.Fe2O3), a decrease in haematite and consequently a decrease in the Fe2O3→Fe3O4 reaction, which results in a smaller volume increase due to this transformation and thus improves the RDI.
Secondary haematite is the main cause of poor degradation resistance in the sinter.20 This observation is based on the common presence of cracks around secondary haematite. These cracks form due to the increase in volume that accompanies the transformation that takes place during the reduction of haematite to magnetite and are known to be responsible for the degradation of sinter.
Tumbler test
The TI values of the sinters ranged over a very wide interval, i.e. between 53 and 75% (Table 6). The cold strength of the sinter is determined by the tumbler test21 and depends on the strength of the individual ore components, the strength of the binding matrix and the composition of the ore. The study of the fracture strength of several ore phases has yielded the following order: primary (or residual) haematite>secondary (or precipitated) haematite>magnetite>SFCA.
Figure 1 shows a high TI for sinter series S1–S14, S15–S20 and S21–S22, with values of >70% for many of the sinters. The exception is seen for sinter S14. A progressive decrease in strength may be observed for series S23–S28.
The value of the TI allows the determination of the cold mechanical strength, impact resistance and abrasion resistance of sinters, which is directly related with the tendency to form fines during transportation and handling, from the sintering machine to the blast furnace throat.
The sinter’s strength depends largely on the properties of the matrix formed by the vitreous phase, silicates, olivines and ferrites. The vitreous phase presents a high degree of stress; the allotropic transformation, which starts at 697°C, from β-2CaO.SiO2 to γ-2CaO.SiO2, is accompanied by a change in volume that causes a decrease in the sinter strength. Ferrites have been identified as a strong binding phase that improves the sinter strength.22 – 25
Granulation index
Table 8 shows the percentages of iron ores (Table 5) according to their G index. Mixtures M1–M14, M15–M20 and M21–M22 fulfil the conditions A+B>68 and C+D<12, i.e. they present ideal granulation behaviour. Mixtures M23–M28 do not fulfil the above conditions and diverge progressively from the ideal conditions, as can be seen in Fig. 1, which in general shows a steady worsening of sinter quality.
Ore mixture G index
In a previous study on granulation,4 it was reported that 15 iron ores were used during the period 1987–1998, forming different proportions of ore mixtures processed in an industrial sintering plant. The recovery rate in each mixture varied between 15 and 23%. In this period, the mixture composition had been improved successively, bearing in mind the classification of ores in terms of their G index. The content of ores belonging to groups A and B has increased, with the aim of fulfilling the ideal condition of achieving a mixture with A+B>68. Similarly, the content of group C and D ores has been adjusted to meet the ideal condition of C+D<12. In the indicated period, comparison of plant productivity with ore mixture granulometry reveals a relationship between improvement of the ore mixture composition, in terms of its G index, and a rise in productivity from 30 to 38 t m−2 per 24 h. Coke consumption dropped from 50 to 34 kg t−1 of sinter in the same period.4
In recent research,26 the G index GI (expressed as wt-%) is defined by the equation
It was found that granulation improved with an increase in the GI. The improvement of granulation leads to an improvement in sinter bed permeability and thus an increase in productivity.
Conclusions
Twenty-eight ore mixtures were prepared and classified according to their G index. Each mixture was used to produce a sinter in a pilot plant. On the basis of the results obtained, the following conclusions may be drawn.
According to the G index theory, generally replacing an ore with another from the same group does not seem to have a significant influence.
In ore mixture series M1–M14, mixture M14 (containing 50·5% Robe River ore), used to produce sinter S14, presented the worst behaviour than the rest of the sinters in this series.
Ore mixture series M24–M28 diverge from the ideal behaviour, according to the G index theory, and should not be used to manufacture sinters.
It is necessary to use various ores from each group, because, although greater production can be obtained with a single ore, the sinter strength is worse.