
Abstract
This paper aims at investigating the failure behaviour of resistance spot welds under tensile shear (TS) and coach peel (CP) loading conditions. A failure mechanism was proposed to describe both interfacial and pullout failure modes in each loading condition. The mechanisms were confirmed by SEM investigations, examining the cross-sections of the fractured welds to detail the fracture path. The experimental results showed that in the pullout failure mode during TS testing, necking is initiated at the nugget circumference in the base metal, and then failure propagates along the nugget circumference in the sheet, leading to the final fracture, while pullout failure during the CP test occurred by crack initiation and propagation near the weld nugget/heat affected zone boundary. The interfacial failure to pullout failure mode transition in the TS and CP tests was also studied. The critical weld nugget size required to ensure the pullout failure mode was obtained for each loading condition. The critical fusion zone size to ensure pullout failure mode during the TS test was larger than that of the CP test. It was found that the load bearing capacity of the spot welds under CP is significantly lower than that of the TS test.
Introduction
Vehicle crashworthiness, which is defined as the capability of a car structure to provide adequate protection to its passengers against injuries in the event of a crash, largely depends on the integrity and mechanical performance of spot welds.1 Resistance spot welding is the dominant process in sheet metal joining. To ensure and maintain the structural integrity of the automotive body structure under service condition such as a crash situation, the remotest possibility of producing even one or two defective welds in a critical component needs to be eliminated.2 Therefore, evaluation of spot weld quality is a vital issue for the reliability of the vehicle and for improving the economics of vehicle production. Evaluating spot weld quality requires studying welding process variables and weld performance interrelations.
There are generally three indexes for the quality control of resistance spot welds (RSWs):
fusion zone (FZ) size: FZ size, which is defined as the width of the weld nugget at the sheet/sheet interface in the longitudinal direction, is the most important factor in determining the quality of the spot welds3 – 7
weld mechanical performance: spot weld mechanical performance is generally considered under static/quasi-static and fatigue loading conditions; pot welds in real service condition experience complex loading conditions, including shear, tensile, compression, bending and torsion stresses8
failure mode: this is the manner in which the spot weld fails. Failure mode and failure mechanism largely depend on the complex interplay between the weld geometry and the material properties of the FZ/heat affected zone (HAZ)/base metal (BM) as well as the test geometry and the stress state in each weld.9 – 12 Therefore, the prediction of the failure mode and failure location is a challenging issue. Generally, the RSW failure occurs in two modes: interfacial failure (IF) and pullout failure (PF).9 – 12 Figure 1 shows typical fracture paths during the mechanical testing of a spot weld. In the interfacial mode, failure occurs via crack propagation (path A), while in the pullout mode, failure occurs via nugget withdrawal from one sheet. In this mode, fracture may initiate in BM (path B), HAZ (path C) or HAZ/FZ (path D), depending on the BM and the loading conditions. Spot weld failure mode is a qualitative measure of the weld quality. Failure mode can significantly affect the load bearing capacity and the energy absorption capability of RSWs. Generally, the pullout mode is the preferred failure mode due to its higher associated plastic deformation and energy absorption. Thus, vehicle crashworthiness, as the main concern in automotive design, can dramatically reduce if the spot welds fail via interfacial mode. The PF mode during quality control indeed indicates that the welds have been able to transmit a high level of force, thus causing severe plastic deformation in its adjacent components and increased strain energy dissipation in crash conditions.12 Therefore, it is needed to adjust the welding parameters so that the PF mode is guaranteed.
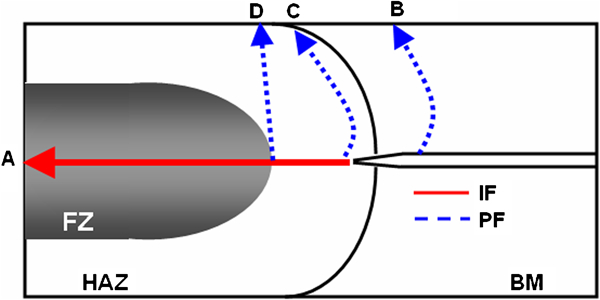
General fracture paths during mechanical testing of RSWs: IF, path A; PF, paths B, C and D
Although the spot weld has been used extensively, a simple failure criterion that is able to predict the failure strength of a spot weld subjected to various loading conditions does not exist.8 A study towards better understanding the failure mechanism under various loading conditions is the first step to develop a failure criterion for RSWs. Therefore, the aim of the present work is to investigate the failure modes and failure behaviour of RSWs under two loading conditions: the tensile shear (TS) test and the coach peel (CP) test. The TS sample geometry is chosen as a representative case for predominantly shear load (i.e. shear force to the weld interface). The CP test is chosen as a representative case for predominantly tensile/bending loading condition.
Experimental
A 1·5 mm thick uncoated low carbon steel of the type used in the automotive industry was used in the investigation. The chemical composition of the steel is Fe–0·04C–0·21Mn–0·03Si–0·04Al–0·01S–0·008P. Spot welding was performed using a 120 kVA ac pedestal type resistance spot welding machine controlled by a PLC (Progrmmable Logic Controller). Welding was conducted using a 45° truncated cone RWMA class 2 (Cu–Cr–Zr) electrode with 7 mm face diameter. In all the experiments, the electrode pressure and the squeezing, welding and holding times (i.e. electrode holding time after welding current off) were kept constant at 4 bars and 45, 12 and 15 cycles respectively. The welding current was changed from 10 to 14 kA. The aim of this experiment set is the investigation of the effect of physical weld attributes (more importantly weld FZ size) on the weld performance. Seven samples were performed per welding condition, including three samples for the TS test, three samples for the CP test and one sample for weld size measurement.
The TS and CP tests were used to characterise the mechanical properties of the welds. The dimensions of the samples are shown in Fig. 2. Quasi-static mechanical tests were performed at a crosshead of 2 mm min−1 with an Instron universal testing machine. The peak load was extracted from the load–displacement curve. The failure modes of the samples were determined by examining the fracture surfaces. Micrographs of the cross-section of failed spot welds were examined in order to understand the failure mechanism.
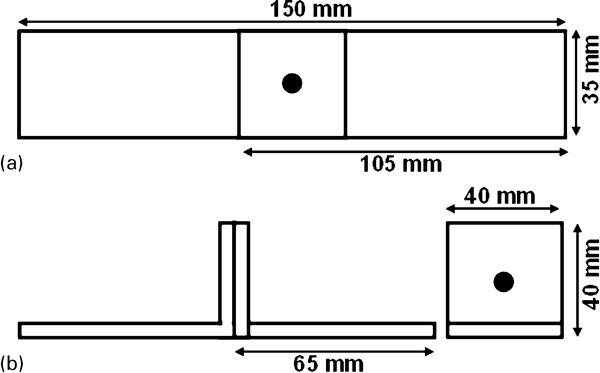
Dimensions of specimens for a tensile shear test and b coach peel test
Samples for metallographic examination were prepared using standard metallography procedures. Weld microstructures and macrostructures were examined under optical microscopy. Weld nugget (FZ) sizes were measured on the weld cross-section parallel to the rolling direction. Etching reagent (4% nital) was used to reveal the fusion line boundary. A Vickers microhardness test was performed along the interfacial line and 50 μm above the weld centreline using 100 g load on a Bohler microhardness tester.
Results and discussion
Microstructure and hardness profile of joint
The macrostructural characteristics of the RSWs, particularly the FZ size as well as the microstructural and hardness characteristics of the RSWs, play important roles in their failure behaviour and failure mode. Rapid heating and cooling induced by the resistance spot welding thermal cycles significantly alter the microstructure in the joint zone. A typical macrostructure of the joint is shown in Fig. 3a , indicating three distinct zones, namely, FZ, HAZ and BM.
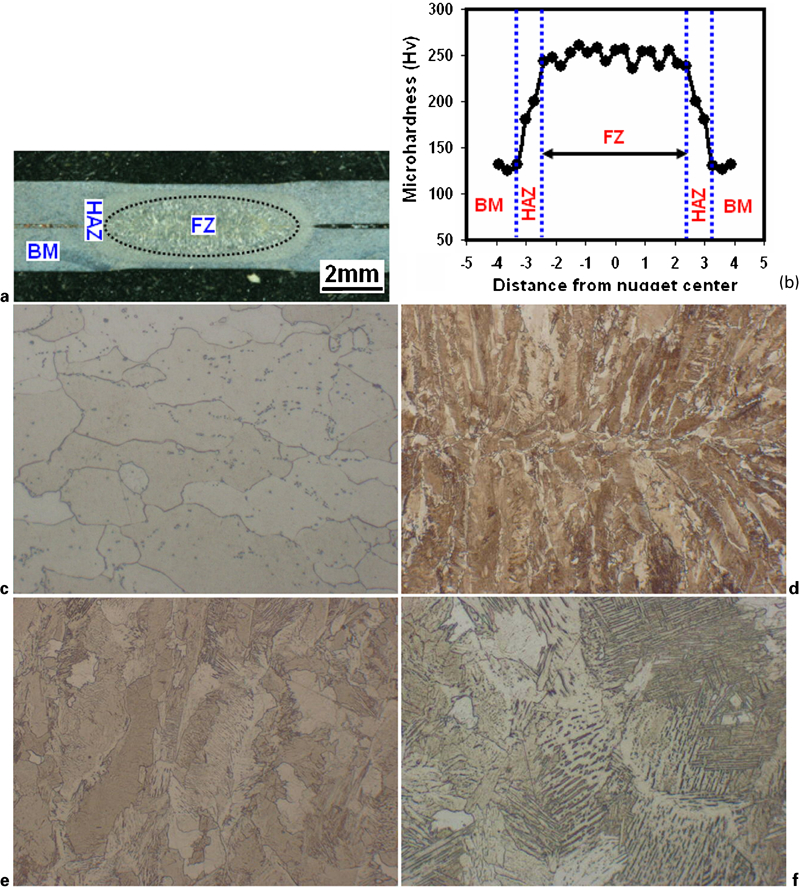
a typical macrostructure, b typical hardness profile, c BM microstructure, d columnar grain in FZ and e, f FZ microstructure
The hardness profile of the joint is shown in Fig. 3b
. The hardness variation across the joint can be analysed in terms of the microstructure of the joint. The BM microstructure, as depicted in Fig. 3c
, consists of ferrite grains; the corresponding hardness is 125 HV. The FZ consists of a directional columnar structure growing towards the weld centreline (Fig. 3d
). The microstructure of the FZ, as shown in Fig. 3e and f
, mainly consists of lath martensite with boundaries decorated by the grain boundary ferrite and Widmanstätten ferrite. Some bainite and polygonal ferrite were also observed in the FZ (Fig. 3f
). The formation of martensite in the FZ explains the higher hardness of the FZ compared to the BM hardness. Despite the low carbon content of the BM and its ferritic structure, the martensite phase was formed due to the high cooling rate of the RSW process. Martensite formation in the FZ of low carbon steels is reported by several researchers.10,13
–
15 Martensite formation in the FZ is attributed to the high cooling rate of the resistance spot welding process due to the presence of water cooled copper electrodes and their quenching effect as well as the short welding cycle. It was shown through modelling that spot welds with thicknesses of up to 2 mm typically solidify in <3–4 cycles.13 Gould et al.
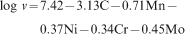
14 developed a simple analytical model predicting the cooling rates of RSWs. According to this model, the cooling rate for 1·5 mm thickness is ∼4000 K s−1. For steels, the required critical cooling rate to achieve martensite in the microstructure can be estimated using the following equation16
The formation of various products during the decomposition of austenite during cooling can be explained as follows.17 On cooling at below A 3 temperature, austenite begins to transform. Allotriomorphic ferrite is the first phase to form. This ferrite phase grows in the form of layers, tending to decorate the austenite grain boundaries. During the transformation, carbon accumulates ahead of the ferrite, slowing the growth rate as the layer thickens. Conversely, Widmanstätten ferrite grows in the form of plates or laths, permitting carbon to be partitioned to the sides. This allows the plates to lengthen at a steady rate, which is much faster than the thickening of allotriomorphs. Bainite formation occurs at lower temperatures, sometimes accompanied by the precipitation of cementite. Any remaining austenite then either decomposes into martensite or is retained in small quantities in the microstructure.17
Failure mechanism during TS test
Two types failure mode were observed during the TS tests, i.e. IF and PF modes, as shown in Fig. 4. A simple model describing the stress distribution at the interface and circumference of a weld nugget during the TS test is shown in Fig. 5:
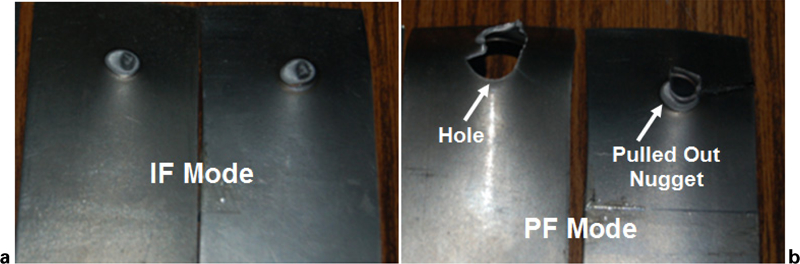
Failure modes of spot welds during tensile shear test
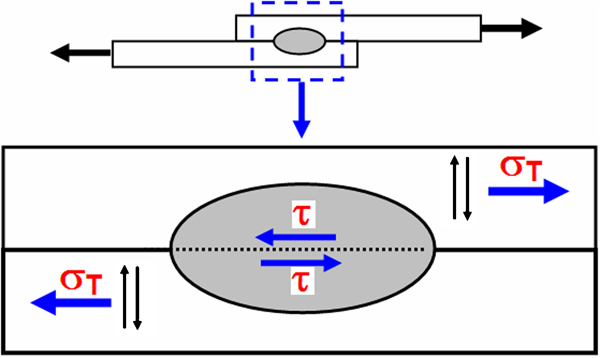
Simple model describing stress distribution at interface and circumference of weld nugget during tensile shear test
as can be seen in Fig. 5, shear stresses are dominant at the interface. In the IF mode (corresponding to path A in Fig. 1), the shear stress at the sheet/sheet interface is the driving force of the failure. Figure 6 illustrates an SEM image of the fracture surface of a spot weld failed in IF mode during TS test showing elongated dimples. The shape of the dimples depends on the loading conditions. The elongated dimples indicate that the IF failure mode during TS test has a shear nature
as can be seen in Fig. 5, one leg of the lower sheet and one leg of the upper sheet are subjected to tensile stress. The tensile stress at the nugget circumference is the driving force for PF mode. In PF mode, when there is certain amount of rotation, the tensile stresses formed around the nugget cause plastic deformation in the sheet thickness direction. Necking occurs at both loaded legs of the TS sample as the tensile force increases. Generally, the necking occurs in BM (corresponding to path B in Fig. 1) or HAZ/BM (corresponding to path C in Fig. 1). Necking is not equal in both sheets. The stress concentration caused by the uneven necking in the two sheets leads to the withdrawal of the spot weld from one sheet. In order to understand the failure mechanism, optical micrographs of the cross-sections of the spot welded joints after the TS test are examined. Figure 7 shows the macrograph of the fracture surface of a spot weld which failed at pullout mode. The failure of the spot weld appears to be initiated near the middle of the nugget circumference and then propagated by necking/shear along the nugget circumference until the upper sheet is torn off. The necking location in the TS test is dictated by the hardness profile. As can be seen, necking is initiated at the BM (corresponding to path B in Fig. 1), where its low hardness in comparison with HAZ and FZ can provide a preferential location for necking during the TS test. Therefore, it can be concluded that the strength of the spot welds in the TS test is dictated by the BM strength rather than HAZ or FZ. Figure 8 shows the SEM image of the fracture surface in the necking region of a sample failed in PF mode, showing near circular dimples which are indicators of failure under stress being normal to the overall plane of fracture. Therefore, it is concluded that the driving force for the PF mode is the tensile stress.
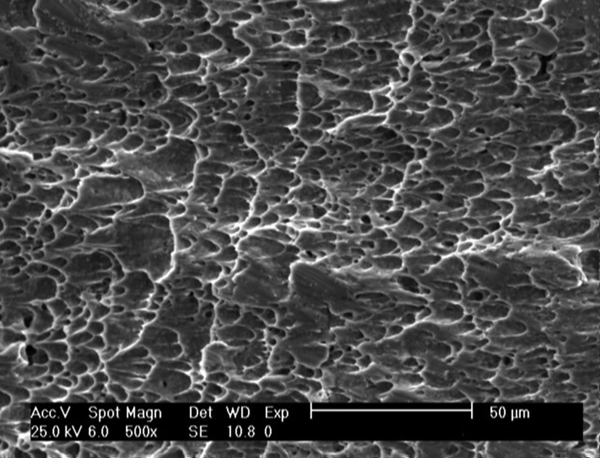
Fracture surface SEM image of spot welds failed in IF mode during TS test
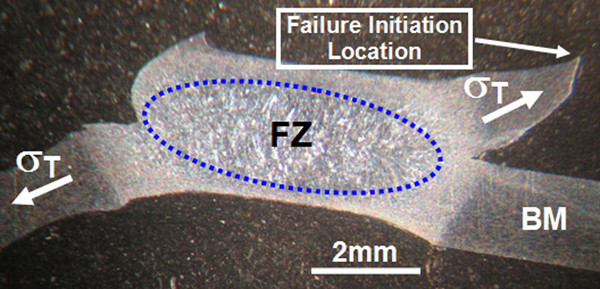
Typical macrograph of fracture surface cross-section of spot welds which was failed via pullout failure mode during tensile shear test
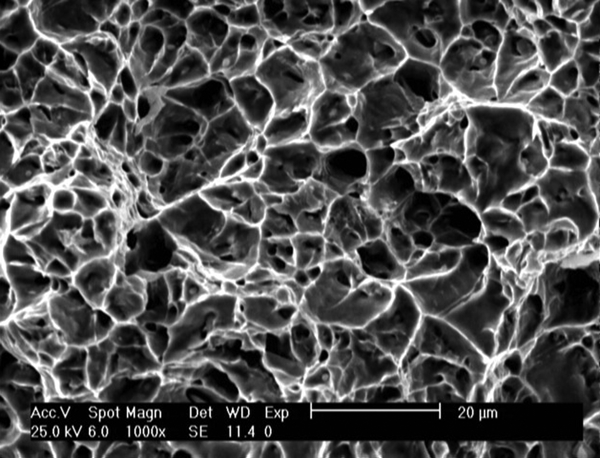
Fracture surface SEM image of spot welds failed in PF mode during TS test
Failure mechanism during CP loading condition
Two types of failure mode were observed during the CP tests: IF and PF modes, as shown in Fig. 9. As can be seen, the spot weld which failed in the IF mode exhibits a smooth fracture surface and undergoes little plastic deformation during the failure process, indicating low failure energy. However, the spot weld which failed in PF mode exhibits significant deformation, indicating higher energy absorption compared to IF mode. An undeformed CP specimen contains a moment arm between loading line and weld nugget. As the applied eccentric load P increases, the effective moment arm decreases by the rotation of the initial moment arm part. Hence, the edge of the weld nugget undergoes relatively concentrated tensile stress from the bending moment. Figure 10 shows a simple model describing the stress distribution at the interface and circumference of a weld nugget during the CP test:
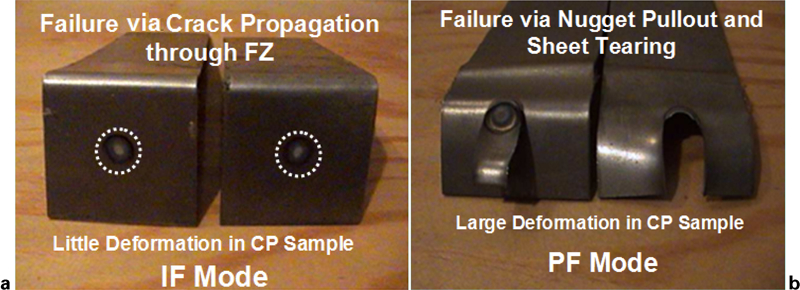
Failure modes of spot welds during coach peel test
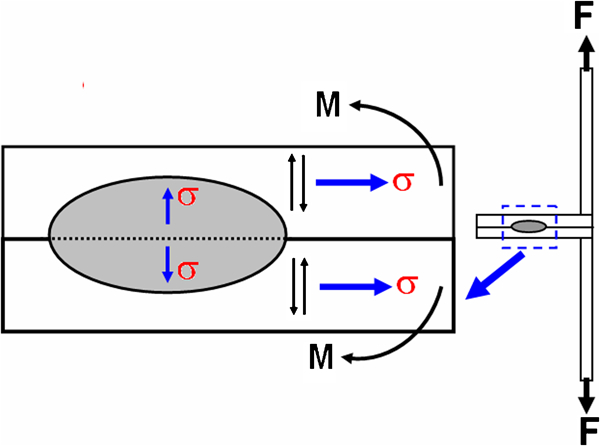
Simple model describing stress distribution at interface and circumference of weld nugget during coach shear test
in the IF mode, the tensile stress at the sheet/sheet interface is the driving force of the failure. Figure 11 illustrates the SEM image of the fracture surface of a spot weld failed in IF mode during CP test, showing near equiaxed dimples. This confirmed that the driving force for the IF mode in CP test is tensile stress
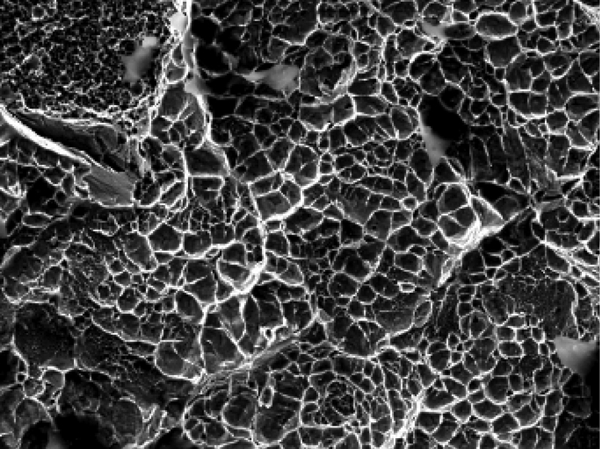
according to Fig. 10, bending stress is the driving force for PF mode during the CP test. Figure 12 illustrates the SEM image of the fracture surface of a spot weld failed in the PF mode during the CP test, showing near elongated dimples. This confirmed that the driving force for PF mode in the CP test is bending stress. In order to understand the failure mechanism in PF mode during the CP test, micrographs of the cross-sections of the spot welded joints after the CP test are examined by optical microscopy. Figure 13 shows the macrograph of the fracture surface of a spot weld which that failed at pullout mode during the CP test. As can be seen, the failure mechanism of the CP specimens is distinctly different from that of the TS specimens. The PF in the CP test is accompanied by crack initiation and propagation. According to Fig. 13, crack initiates beside the notch tip at or near the faying surface. Crack initiation and propagation sites are located in the coarse grained HAZ (corresponding to path D in Fig. 1). Final fracture occurs as the crack propagates through the sheet thickness. The observed mechanism is in agreement with the mechanism suggested by Zuniga and Sheppard.18 They divided the failure sequence of the spot welds in the CP specimens into four stages: (1) propagation of the notch tip toward the FZ; (2) large tensile strains at the faying surface blunt the notch tip; (3) ductile fracture initiation beside the blunted notch tip, crack initiation occurs by microvoid coalescence; and (4) final fracture occurs by crack propagation through the thickness direction.
Fracture surface SEM image of spot welds failed in IF mode during CP test
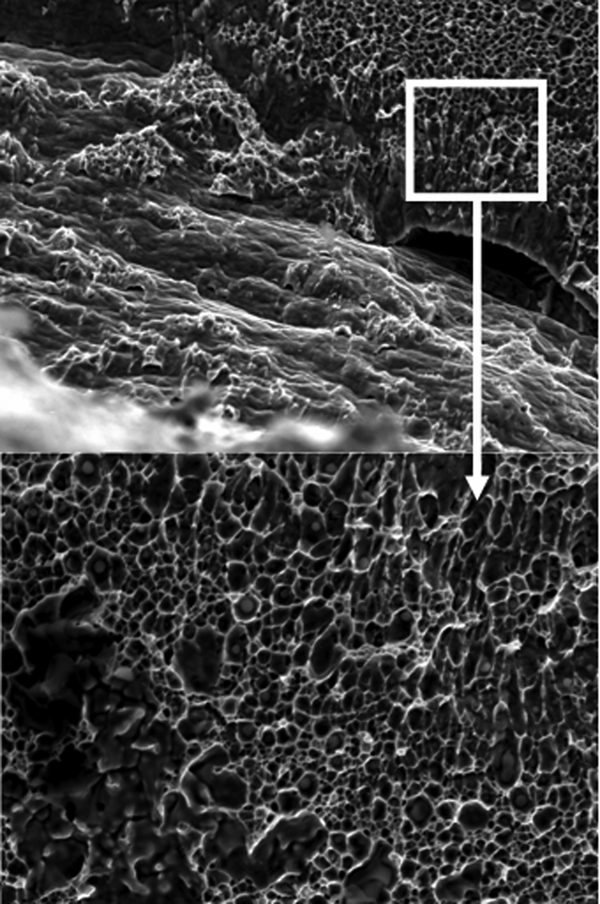
Fracture surface SEM image of spot welds failed in PF mode during CP test
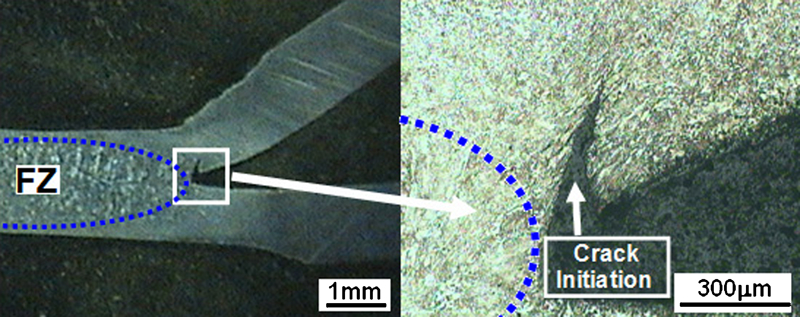
Typical macrograph of fracture surface cross-section of spot welds that failed via pullout failure mode during coach peel (CP) test
IF to PF mode transition
The FZ size is one of the key factors in controlling the failure mode of spot welds. Figure 14 shows the correlation between the welding current, the FZ size and the failure mode of the spot welds during TS and CP. Increasing the welding current and welding time increases the FZ size. It is well documented that there is a critical FZ, above which the PF mode is guaranteed.9 – 12,19,20 The critical FZ D C to ensure PF mode was determined by examining the weld fracture surfaces. The critical FZ size (defined as the FZ size between the maximum weld size leading to IF mode and the minimum weld size leading to PF mode) is identified in Fig. 14. In order to avoid the IF mode, a minimum welding current of 11 kA should be used for welding the CP specimens, while a minimum welding current of 12 kA is required to ensure PF mode for the TS specimens. As can be seen, during the TS test, spot welds with FZ sizes of >6·1 mm failed in the PF mode, while during the CP test, spot welds with FZ sizes of >5·5 mm failed in PF mode. Indeed, a smaller FZ size is required for obtaining PF mode during the CP test in comparison with the TS test (i.e. spot welds exhibit a higher tendency to fail in IF mode during the TS test rather than the CP test). To explain the IF to PF transition behaviour, the following points should be considered:
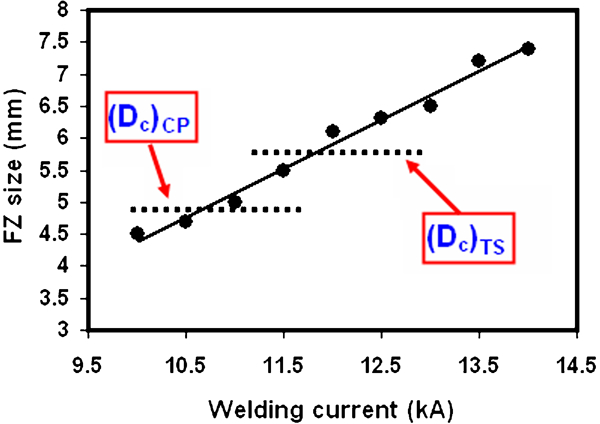
Effect of welding current on fusion zone (FZ) size and failure mode of spot welds during tensile shear (TS) and coach peel (CP) tests
in the TS test, the driving force for the IF mode is the shear stress at the sheet/sheet interface, while in the CP test, the tensile stress at the sheet/sheet interface is the driving force. It is well known that the shear strength of the metals is lower than their tensile strength. This point can partly explain the higher tendency of TS samples to fail in IF mode
the driving force for the PF mode in both TS and CP tests is the tensile stress at the nugget circumference. In the TS test, the tensile stress is mainly induced by the bending moment due to the weld nugget rotation. The bending stresses experienced by the CP samples are higher than the TS samples due to its unique geometry. This point can explain the higher tendency of the CP samples to fail in PF mode.
Mechanical properties
As shown above, spot welds during TS and CP tests exhibit different failure behaviours. A typical load–displacement curve of the spot welds failing in the PF modes is shown in Fig. 15. The welding conditions in the two cases are the same. The load–displacement curves in the TS and CP tests are different due to the CP test configuration and its own deformation and failure characteristics. The non-linear region in the curves is attributed to the strain hardening of the samples. In the TS test, the peak point corresponds to the necking in the BM region. In the CP test, the peak point corresponds to the crack initiation in HAZ. After reaching the peak force, the force descends gradually with the tearing process of the BM around the weld nugget. From Fig. 15, the following points can be drawn:
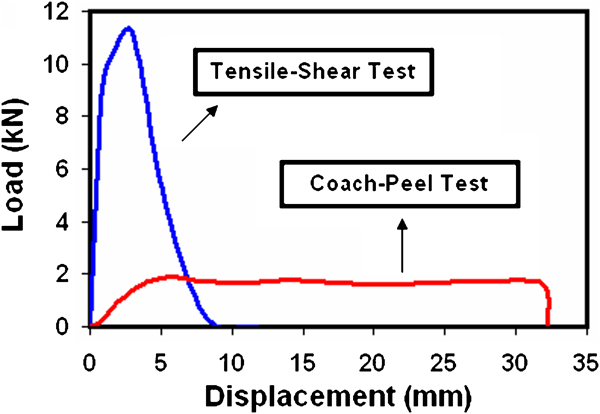
Comparison of load–displacement of spot weld in CP and TS loading conditions
the load bearing capacity of spot welds under CP is significantly lower than that of the TS test. This can be attributed to the more complicated stress state as well as the larger bending moment applied to the weld during the CP test
the displacement to failure in the CP test is significantly larger than that of the TS test. This is due to the large deformation of the CP sample induced by the bending moment
the energy absorption capability of spot welds in CP test is lower than that of the TS test.
Figure 16 shows the relationship between weld FZ size and peak load in both loading conditions of the TS and CP tests. There is a direct relationship between FZ size and peak load; however, the peak load in the CP test has a low sensitivity to FZ size in comparison with the TS test. In addition, beyond a critical FZ size, there is no increase in the CP strength of the spot welds.
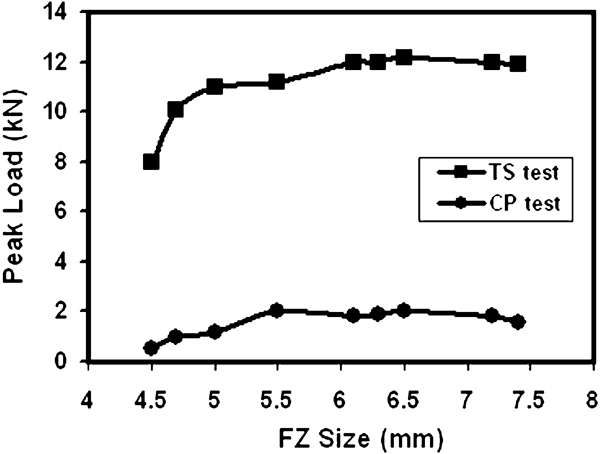
Effect of FZ size on peak load in TS and CP tests
Conclusions
The failure behaviour of RSWs under TS and CP loading conditions was investigated. A failure mechanism was proposed to describe both IF and PF modes in each loading condition. The mechanism was confirmed by SEM investigations of cross-sections of fractured weld to detail the fracture path. In light of the above examinations, the following conclusions can be drawn:
The CP specimens in PF mode failed by initiation and propagation of a crack beside the blunted notch tip. The TS specimens in PF mode failed by through thickness necking.
In pullout mode, the failure locations of the CP and TS specimens were in the BM region and coarse grain HAZ respectively.
There is a minimum FZ size to ensure PF mode during the mechanical testing of RSWs. The critical FZ size to ensure PF mode during the TS test was larger than that of the CP test. This was explained in terms of stress state at the sheet/sheet interface and the nugget circumference.
The load bearing capacity of spot welds under CP is significantly lower than that of the TS test. The displacement to failure in the CP test is significantly larger than that of the TS test. The energy absorption capability of the spot welds in the CP test is lower than that of the TS test.