
Abstract
A new concept has been developed to assess, and a new technique developed to improve, the microthermomechanical rigidity of the solidifying shell in the secondary cooling zones during continuous casting of steel. This is to maximise the coherent solid shell resistance ‘I c’ against thermometallurgical and mechanical stresses at different levels from meniscus. The idea behind this concept is to optimise the degree of homogeneity of the cooling pattern between a pair of rolls. The effect of the degree of homogeneity of the cooling pattern between a pair of rolls ‘HDCP’, in different spray cooling zones on the different types of centreline segregates has been investigated. A number of plant trials with two different water cooling patterns between a pair of rolls have been performed. The metallographic investigation contains examinations and measurements of the level of centreline segregates of collected samples. A one dimensional (1D) transient finite difference mathematical model of thermal, solidification, solid shell resistance and cooling conditions has been developed to test the different effects of spray patterns on the microthermomechanical rigidity concept and therefore on the mechanism of centreline macrosegregation level. The results indicate that the increase in the degree of homogeneity of the cooling conditions is proportional to the increase in slab internal microquality. The results show that the degree of homogeneity of the cooling pattern affects centreline macrosegregation significantly. This depends significantly on the degree of homogeneity of cooling pattern between a pair of rolls, its location from the meniscus and, generally, on the increase microthermomechanical rigidity concept.
List of symbols
unity elementary area (m2)
correlation factor of caster operation conditions
exponent coefficient of cooling region
constant in equations (8) and (9)
nominal concentration of carbon (wt-%)
specific heat (J kg−1 K−1)
cooling rate (°C s−1)

diffusion coefficient for carbon in dendritic solid phase k (m2 s−1)
roll diameter (m)

interaction coefficient for element j dissolved in liquid iron at 1600°C
fraction
Newtonian heat transfer coefficient at time t (W m−2 K−1)

average Newtonian heat transfer coefficient at time t (W m−2 K−1)
inhomogeneity degree of cooling pattern
initial Newtonian heat transfer coefficient of cooling region (W m−2 K−1)
position of neutral axis (m)
enthalpy (kJ kg−1)

average enthalpy (kJ kg−1)
homogeneity degree of coherent solid shell resistance
coherent solid shell resistance (N mm−1/m s −1/m)

average coherent solid shell resistance between a pair of rolls (N mm−1/m s−1/m)
equilibrium partition coefficient of binary Fe–C system

partition coefficient for component P, in an J component system
distance between a pair of rolls (m)
spray length (m)
latent heat of fusion (J kg−1)
mould length (m)
exponent in equations (8) and (9)
number of fluctuations between a pair of rolls
number of phases
Pèclet number
surface heat fluxes at x = 0 and x respectively (kW m−2)
gas constant
time (s)
initial time of cooling region between a pair of rolls (s)
temperature (°C)
liquidus and solidus temperatures of binary system respectively (°C)
surface and cooling fluid temperatures (°C)
local interdendritic liquid velocity (m s−1)
molar volume (m3 mol−1)
roll length (m)
Cartesian coordinates (m)
mole fraction of carbon
coefficient in equations (1) and (2) for element j
coefficient in equations (3) and (4) for element j
thermal conductivity (W m−2 K−1)

average thermal conductivity (W m−2 K−1)
primary dendrite arm spacing (μm)

equivalent thermal conductivity in liquid phase (W m−2 K−1)
casting speed (m s−1)
density (kg m−3)

average density (kg m−1)

concentration of element j in the liquid phase l (wt-%)
coefficient in equation (17) for element j
constant in equation (6c)
infinitesimal element length or time
Superscripts
equivalent
phase
liquid phase
number of alloying elements
gamma solid phase
delta solid phase
exponents in equation (6c)
Subscripts
carbon
coherent
phase
liquid phase
maximum and minimum values
cooling region
peritectic reaction
solid phase
Introduction
Zero defect strategy1, 2 for the internal quality of continuously cast steel slabs is a major issue that has been given a lot of attention, especially on the need for efficient spray cooling systems to avoid such defects.1 – 9 The most important internal defect is centreline macrosegregation.5 – 9 This defect can be described as a precipitous positive concentration peak of alloying elements in the centre of the slab, with negative concentration on both sides of the peak. The steep concentration does not solidify dendritically and can cause inferior mechanical properties of the final product.6, 7 The mechanism behind centreline macrosegregation has been discussed many times in the literature where it is concluded that one major cause is the consequence of intensive deformations induced in the solidified shell.5, 8, 9 These deformations result from thermal and mechanical stresses imposed on the slab. In the continuous casting of steel slabs, it is well known that the ferrostatic pressure head of the liquid steel melt causes a positive bulging where the solid shell of broad face bulges out between a pair of rolls as shown schematically in Fig. 1.3, 4 Roll misalignment10 caused by a poor setting or flexing of the machine, roll bearing wear and roll deflection also result in a positive or a negative bulging. The literature has shown that solid shell resistance of coherent zone ‘I c’ plays a major role in determining the level of bulging and therefore its effect on centreline macrosegregation.5
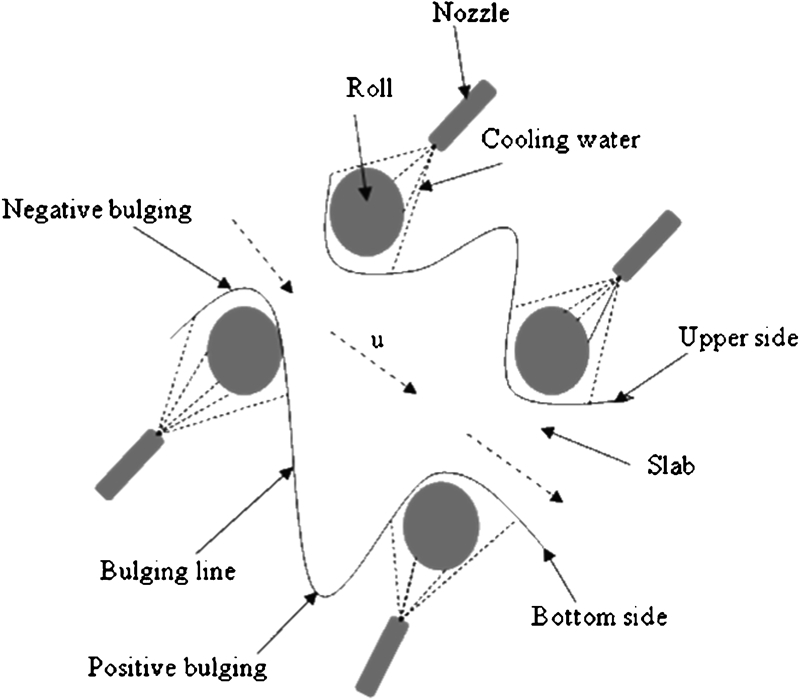
Schematic illustration of bulging line between pair of rolls
Numerous studies for simulating the resistance of the solid shell of continuously cast steel slabs have been done to improve the internal quality. Miyazawa and Schwerdtfeger11 developed a model to compute the bulging based on the solid shell resistance concept. El-Bealy3 extended this model to study the effect of various cooling conditions on the formation of halfway cracks and fluctuation of the macrosegregation phenomenon. He also studied the effect of different secondary cooling patterns3, 12 and different dendritic solid phase distributions13 on the solid shell resistance in the secondary cooling spray zones. Subsequently, several practical techniques have been developed to improve the inner quality and therefore eliminate the centreline macrosegregation in continuously cast steel slabs by using electromagnetic stirring,14, 15 mechanical forces,16 by improving the spray cooling patterns3, 17 or increasing the flow water flow of certain secondary zone in last stages of spray cooling zones, called thermal soft reduction.6, 17, 18 These studies, as well as proposed techniques, concluded that the spray cooling pattern is an essential parameter to improve the solid shell resistance and therefore, the internal quality of slabs.
Many efforts have been made to study and optimise the uniformity of cooling patterns in the secondary cooling zones in continuously cast steel slabs.19 – 24 The cooling pattern between a pair of rolls and its effect on the heat transfer coefficient distribution was explained by many authors.19 – 24 These investigations concluded that the surface temperature fluctuates rapidly and continuously during secondary spray cooling zones in continuous casting of steel. Also, they proposed several techniques to improve the effect of spray cooling on the internal quality, such as increasing the spray cooling length and increasing the flowrate in a certain cooling zone or by using air mist nozzles.25 – 27 Recently, El-Bealy28 has proposed a new technique called ‘thermomechanical rigidity technique’ to examine the effects of operating, cooling conditions and caster design parameters on the maximisation of the growth rate of solid shell resistance in various cooling regions between a pair of rolls, and generally on the surface and internal quality of steel slabs.21
In order to minimise the centreline macrosegregation in continuously cast steel slabs, in this paper, the microthermomechanical rigidity concept is investigated, and extended, by applying different cooling patterns between a pair of rolls as a development of thermal soft reduction technique. This paper gives a detailed description of four plant trials with two different secondary cooling patterns that use various spray nozzle designs at different levels from meniscus. The paper continues with a metallurgical study of collected samples and the theoretical calculations of thermal, solidification and solid shell resistance ‘I c’. The paper concludes with a discussion on the effect of different secondary cooling patterns and their location on the microthermomechanical rigidity concept and therefore, on the centreline segregates.
Plant trials and metallurgical study
Plant trials
The industrial trials were carried out during four group casting heats with 150×1300 and 170×1040 mm rectangular section slabs. All the steel grades examined were commercial peritectic carbon steels with carbon content varying from 0·09 to 0·12 wt-%. Table 1 gives the casting conditions and compositions of the slabs from which the centreline segregation samples were taken. As observed from these data, the variations of slab thickness, superheats and casting speeds for different group heats are small. Therefore, their effects on the centreline macrosegregation levels are small and it can be neglected. The slab caster used for the industrial trials was the 8 m radius caster at the Egyptian Iron and Steel Company, El-Tabien, Helwan, Egypt. The geometric detail of the slab caster and operating conditions are presented in Table 2. The numerical simulation was based on this slab caster.
For the purpose of the investigation, the relation between the formation of centreline macrosegregation and the changing of the degree of the homogeneity of the cooling patterns between a pair of rolls at different distances from meniscus was examined. An extra cooling cycle21 with two different cooling patterns was applied individually between a pair of rolls on the slab upper broad side at 2, 6 and 14 m from the meniscus as shown in Figs. 2a and b . The features of cooling patterns are summarised in Table 2. The cooling pattern between a pair of rolls shown in Fig. 2a uses a cone nozzle3, 12, 21 and the detail of this cycle is explained by El-Bealy et al..21 The proposed cooling pattern shown in Fig. 2b uses an elliptical spray nozzle and the arrangement of this proposed elliptical spray nozzle is presented in Fig. 3. In this proposed nozzle configuration, the present outlet design achieves plenty direct spray cooling in the unsprayed subregion in this restricted area as shown in Fig. 2b . This results in optimisation of the fluctuation of the heat transfer coefficient and therefore, more homogeneity of cooling pattern between a pair of rolls.
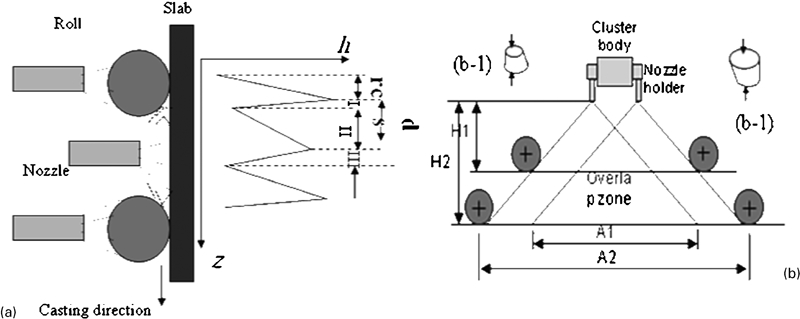
Schematic illustration of a normal and b new cooling cycles
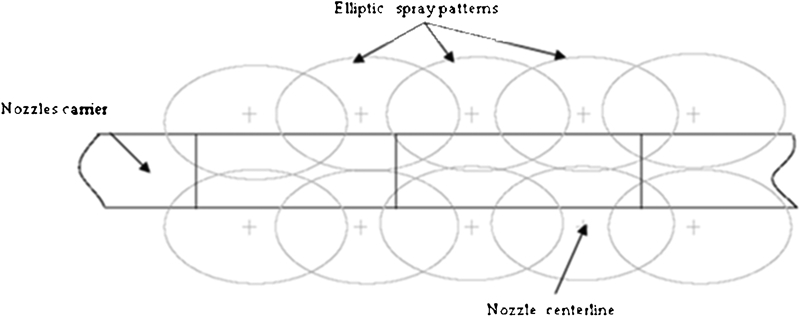
Schematic illustration of new nozzle fluid distributions
Samples for the metallurgical study were cut from the middle of cross-section of the slab broad faces as shown in Fig. 4a . The detail of the cutting principles were taken from Sivesson and Raihle18 where the slices of the slab were taken out perpendicular to the casting directions as shown in Fig. 4a and b .
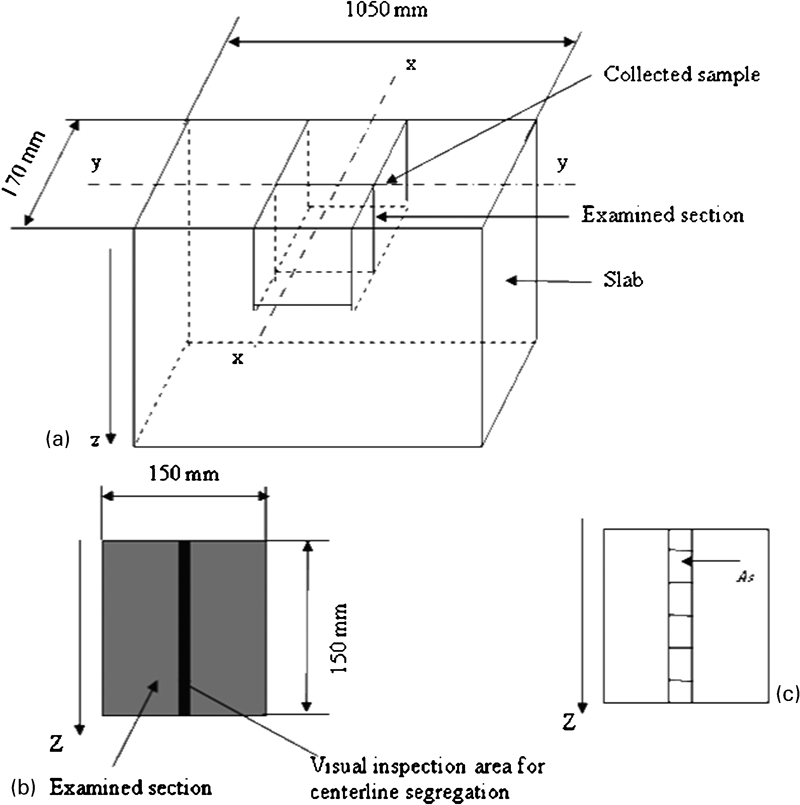
Schematic illustration of a sample location and examined b section and c grid
Metallurgical study and measurements
The oils and oxidised surface layers on the slab samples were first removed by sandblasting to reveal the existence of the centreline segregation. Then, the collected samples from plant trails were machined flat, ground and then the samples sulphur printed by using the standard method.29
The important quantitative measurements to quantify the central macrosegregation defects are central macrosegregation area and the vertical distance between ‘V’ (off-centre semimacrosegregation) segregates.18, 29 The central segregation area measurements were carried out on the 5 mm wide and 150 mm long longitudinal section, as illustrated in Fig. 4b as the black area. This area was divided into a number of small elements of 5×1 mm of width and length, as shown in Fig. 4c . These specimens and the sulphur prints were then examined under a stereo microscope and by using the intercept method in two directions, x and z. in the case of the ‘V’ segregates, only one vertical intercept line was used. Five measured lines for every segregation type were taken on each section to measure average width and length of this area for every direction and mean distance between ‘V’ segregates. Therefore, the measured central segregation area can be computed by averaging the area of mean width of x direction multiplied by the mean length of z direction for every examined area shown in Fig. 2c . The measurements of centreline segregation areas are tabulated in Table 3.
Results from visual and metallographic study together with measurements of centreline segregates
As stated in the literature, the errors in measured and derived quantities were calculated based on the ASTM standard method30 within the 95% confidence interval and the reader is referred to the original references for the details of this method.30
Experimental results
The metallographic structure shown in Figs. 5–8 reveals only a columnar crystal zone for all the heat samples. Figure 5 shows first group sample (heat 2), with large single ‘V’ segregates with discontinuous mini-ingotism31 and discontinuous filled interdendritic cracks in the upper and bottom areas. The distance between ‘V’ segregates changes from 12 to 15 mm as shown in Fig. 5. Figure 6 shows the metallographic result of second group sample (heat 6), where the mini-ingotism increases in the length and decreases in the width. The distance between ‘V’ segregates decreases to 8–10 mm and no interdendritic cracks are observed. Figure 7 illustrates the third group sample (heat 8), where the mini-ingotism is irregular and decreases in the length and width. The distance between ‘V’ segregates changes noticeably from 14 to 28 mm. Figure 8, for the fourth group sample (heat 11), does not exhibit any mini-ingotism or interdendritic cracks, but does show large single ‘V’ segregates. The distance between the ‘V’ segregates changes from 10 to 14 mm. In general, the photographs reveal that the internal quality of continuously cast slabs improves with the change the cooling pattern between a pair of rolls and this effect increases with increasing distance from the meniscus. Also, these metallographic results show that there is no clear relation between the cooling pattern and the morphology of the ‘V’ segregates. The results from the metallographic study and measurements of average centreline segregate areas for different groups are summarised in Table 3.
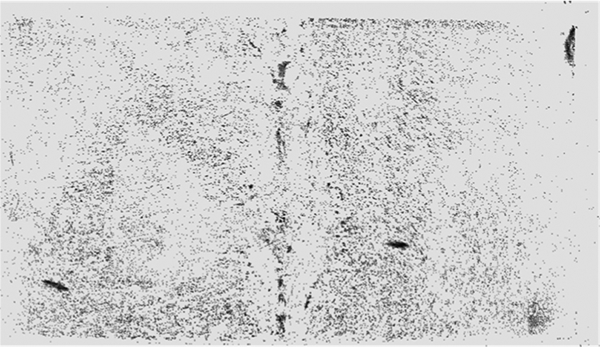
Sulphur print from heat 2 (Group I) showing different centreline segregates
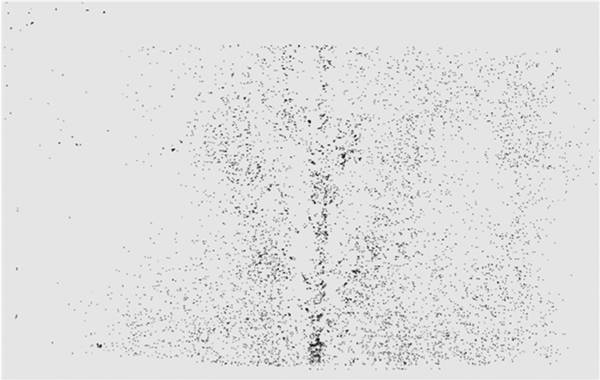
Sulphur print from heat 6 (Group II) showing different centreline segregates
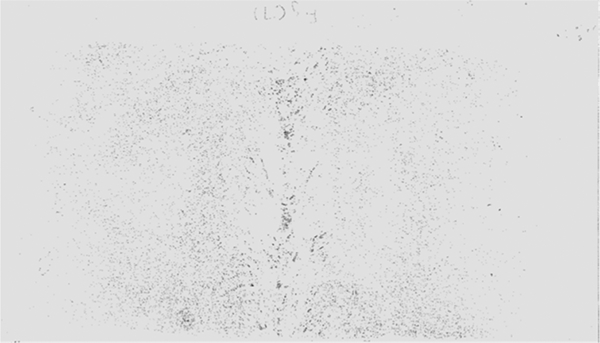
Sulphur print from heat 8 (Group III) showing different centreline segregates
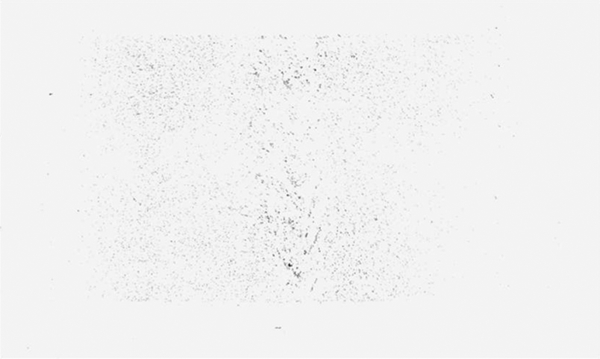
Sulphur print from heat 11 (Group IV) showing different centreline segregates
Model formulation
Mathematical model
Heat flow model was developed to determine the thermal history and temperature distributions in solidified shell and mushy zone of continuously cast steel slabs. Because of the high specific capacity C
p, low thermal conductivity λ of steel and high casting speeds used in the continuous steel casting, heat flow by conduction in the direction of casting (z) is small compared to the heat transferred by the bulk motion of strand. Therefore, a two-dimensional simplification of the full three-dimensional process is reasonable where the Pèclet number Pe in the direction of z of this process is high32 and equal to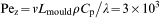
Furthermore, in the case of rectangular sections that have a large geometric cross-section ratio (L/B⩾3) as seen in Fig. 9, the problem can be simulated by using a one-dimensional (1D) model, where a Pèclet number in the direction of y is also high32 and equal to
Schematic illustration of grid of computations
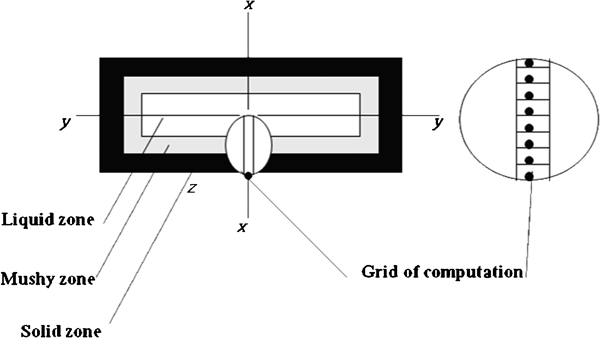
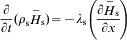
In the present study, a 1D transient finite difference model based on the solution of the non-steady state energy equation is proposed by Poirier et al.,33 where this model represents the situation in the middle of the long transverse cross-section of the slab as shown in Fig. 9. The Poirier et al.’s33 approach to the modelling of heat transfer of dendritic solidification has been discussed thoroughly in Ref. 33. The model distinguishes the heat transfer in liquid, mushy and solid zones, taking into account the effects of the heat of mixing in both the solid dendritic and the interdendritic liquid in the mushy zone, and also the effects of heat changes of different solid phase transformations in the solid zone. Therefore, the intensive enthalpy 
For the mushy zone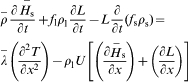
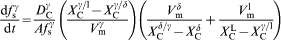
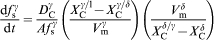
The solidification model discriminates different phases in the mushy zone and the phases in the peritectic reaction region (modes 2 and 3) (Fig. 10a
), by using Fredriksson–Stjerndahl model,34 as shown in Fig. 10b and c
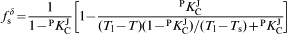
. In the mushy zone, this model distinguishes the delta dendritic solid and interdendritic liquid. Rogberg’s35 approach was used in these computations to represent a complete diffusion mechanism of carbon in dendritic solid until the peritectic temperature3,
35


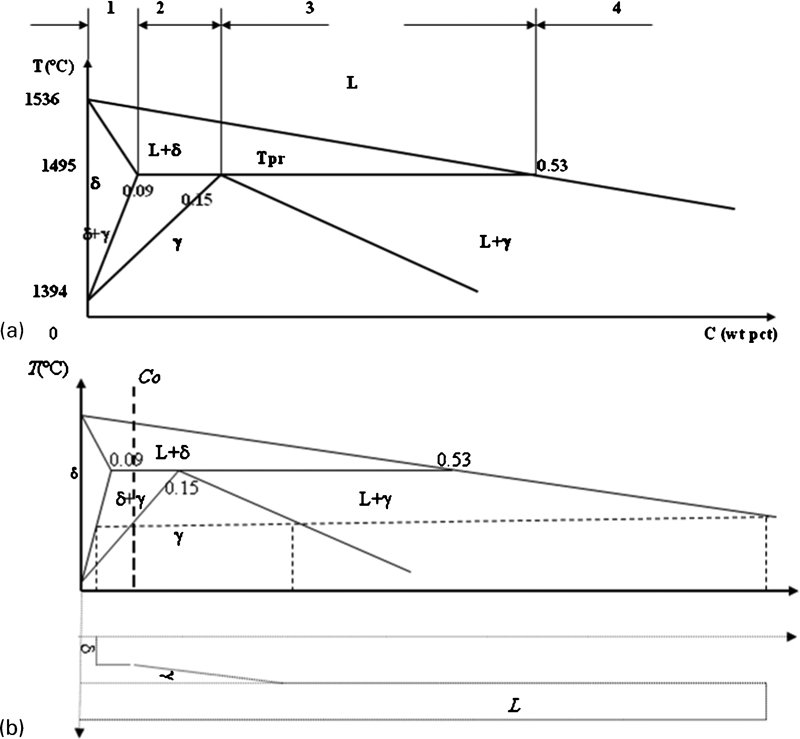
Schematic illustration of a Fe–C phase diagram and b carbon concentrations during three-phase peritectic reaction ‘mode 2’
In order to evaluate the bulging level, the solid shell resistance of the slab coherent shell was obtained by assuming a Miyazawa and Schwerdtferger11 approach, which was modified by El-Bealy.12, 13 The modified approach used the following assumptions:
the effective solid shell thickness varies between a pair of rolls (Fig. 11a
). The value of effective solid shell thickness was determined simultaneously as distance from the slab surface to the coherent isotherm. This thickness was calculated as the sum of the thicknesses between the slab surface to isotherm of actual solidus temperature ‘T
sol’ and then between the isotherm of actual solid temperature into the coherent isotherm at coherence temperature ‘T
coh’. The actual solidus temperature was termed as a function of a cooling rate. The primary dendrite arm spacing and can be formulated as follows12


Below the coherence temperature T
coh, it was assumed that the material behaves mechanically as a solid material and can be calculated by

the temperature and various dendritic solid phases set as variables in both z and x directions as shown in Fig. 11b
. The following equations were used to determine the position of the natural axis (h
1,h
2) and the creep resistance of the coherent shell I
c respectively12,
13
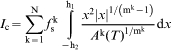
it is very difficult to derive a governing equation from the first principle including the different operating parameters and their interactions to examine the internal quality of continuously cast steel slab. Therefore, a new and simple concept called microthermomechanical rigidity ‘Mic-TMR’ has been proposed to examine quantitatively the level of internal microdefects.28 This concept can be defined by computing the non-dimensional number. The build-up of the equation for this number is based on the fact that the inner quality of continuously cast steel slabs is proportional to solid shell resistance ‘I
c’, the diameter of the roll ‘D
R’ and the direct sprayed cooling length ‘l
spray’, and it is inversely proportional to the unsteady state heat transfer between a pair of rolls, slab width ‘W
R’ and finally the distance between a pair of rolls ‘l’ as follows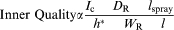


Schematic illustration of a bulging solidifying shell, b dendritic solid phase distributions and c neutral axis cross-section
where A* is the correlation factor of caster operation conditions and is equal to unity in these computations. Subsequently, equation (11) is used to calculate the non-dimensional number of the microthermomechanical rigidity ‘Mic-TMR’ between a pair of rolls at certain distance from meniscus in these computations. The target for calculating this number is to examine and measure the effect of increasing the homogeneity of spray cooling pattern between a pair of rolls on the degree of severity of internal microdefects and therefore, qualitatively, on the internal microquality in various secondary spray cooling zones.28
Initial and boundary conditions
The schematic model domain for the 1D mathematical model for the middle of the long transverse cross-section of the slab is shown in Fig. 9. The figure shows also the explicit finite difference mesh and its boundary conditions employed to simulate different thermal fields. For similarity, a uniform grid system of width 80 mm was adopted for only a half slice of the slab moving downward with the steel shell at the slab casting speed. The dimensions of the control elements are Δx = 0·1 mm for all grid mesh computations, as shown in Fig. 9. For reasons of increasing the accuracy, the time step is small, where Δt = 0·001 s.12 Consequently, the initial conditions when t = 0 at the meniscus (z = 0), the initial temperature Tφ is equal to pouring temperature T pour. At z = 0, the pouring temperature T pour is assumed uniformly throughout the slab thickness and the chemical species are also assumed to be distributed consistently and set to their initial values.
Heat transfer at the surface was assumed to follow a generalised Newtonian law.12,
13 Thus, it was assumed that the heat flux across the surface is proportional to the difference between surface and constant water cooling temperatures as defined in the following equation12,
13


Because of the fluctuating nature of mould cooling conditions,44, 45 the normally used mould heat flux as function of dwell time46 – 48 cannot be used. This is due to complex phenomena governing the mould heat transfer, specifically the mechanism of air gap formation and ferrostatic pressure head.45 In this study, the fluctuating mould cooling conditions approach proposed by El-Bealy and Fredriksoon45 and modified by El-Bealy3, 21, 47 to use the fluctuating macrosegregation phenomenon as verification of mould heat transfer history was used. El-Bealy45 presented measurements of macrosegregation distributions for continuously cast steel billets made by Rogberg35 and by El-Bealy3, 47 for a slab caster considered similar as for this work. Therefore, the mould heat flux as function of distance from the meniscus used in these computations is plotted in Fig. 12.
Variations of surface heat flux with distance from meniscus of heat 1
The secondary spray cooling zones of continuous steel casters has been the subject of numerous studies. A comprehensive review of spray cooling relations is given by Brimacombe,48 where these correlations were plotted as a function of spray cooling water flux in order to demonstrate the range of variations in the correlations, but these correlations will not be repeated here. As mentioned above, the important effect of the detail of fluctuation of heat transfer coefficient and its effect on the formation of internal microdefects, these models and their correlations cannot give an accurate and clear picture of surface temperature variations between the rolls; these models give only detailed information about the heat flux in the sprayed and unsprayed areas.
Therefore, in order to describe accurately the heat transfer in the secondary spray cooling zones of continuous steel caster, typically results from surface temperature measurements are used in conjunction with heat transfer model developed by El-Bealy et al.
3,
21 to correlate surface boundary conditions and Newtonian heat transfer coefficients of different cooling regions between a pair of rolls with different cooling cycles. In this model, the distance between a pair of rolls was divided into several cooling regions and every region may be divided to subregions, each characterised by the mechanisms of heat transfer modes, bulging line shape and scale formation control this cooling region (Fig. 2a
).3,
21 In these cooling regions, and due to a rapid changes in the nature of the heat transfer, the Newtonian heat transfer coefficient was proposed to follow an exponential function within every cooling region and the following equation was used in the computations
Numerical analysis
The transformed numerical equations of the governing equation in the above model are difficult to obtain analytically and a numerical integration is available. These equations were discretised based on the finite difference method proposed by Rung Kutta and described in Ref. 51. These equations were solved by using a small time step Δt to achieve accurate solutions.41, 50 The new temperature of the control element of computation at time t+Δt in Rung Kutta finite difference method was obtained through the interpolation of old temperature through several steps, which had been calculated previously by the same method and the calculation of new temperature, was based on the following criterion
For small time interval 

The strategy for the full solution computation steps of heat transfer, solidification behaviour and coherent solid shell resistance during dendritic solidification process of continuously cast steel slabs is used as follows:
read the input file
estimate the new casting temperature distribution
calculate the different dendritic phase fractions
calculate the thermophysical properties of metal
estimate the initial Newtonian heat transfer coefficient
analyse thermal fields and their temperature gradients
repeat steps (iii)–(vi) until converged solutions are obtained
define the position of neutral axis (h 1,h 2)
repeat steps (viii) and (ix) until converged solutions are obtained
calculate the coherent shell resistance ‘I c’
calculate the microthermomechanical rigidity number ‘Mic-TMR’
go to step (ii).
In the fully coupled way, this strategy can calculate the heat transfer, dendritic and interdendritic phases and solid shell resistance in the continuous casting process as described above. This strategy was verified in several cases in Refs. 3, 21 and 47 and the major steps involved in the process are shown as flow chart in Fig. 13.
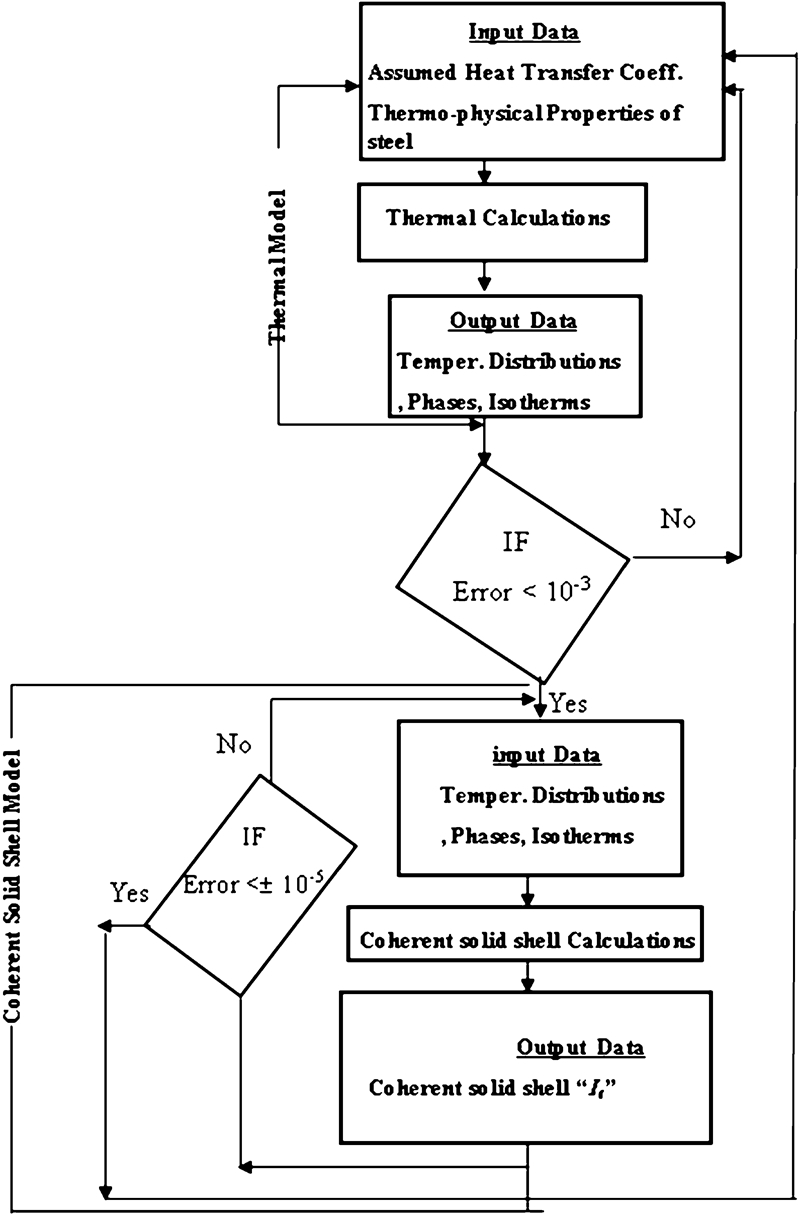
Schematic illustration of simulation algorithm flow chart
Model validation
An analytical solution of the thermal-solidification model of continuously solidified shell derived by Kristiansson52 is used here as an ideal validation problem for thermo-solidification model in the mould zone. However, measurements of slab surface temperature with distance from meniscus by El-Bealy3 in the secondary cooling spray zones have been used to validate the proposed model. Constants for this validation problem for the thermal solidification model were chosen to approximate the conditions of interest in this work and these are listed in Table 6.
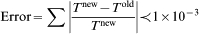
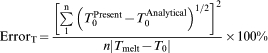
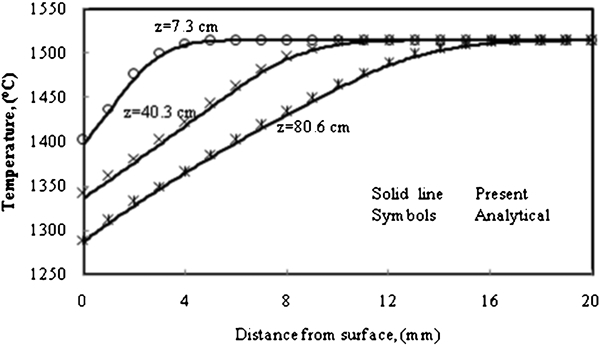
Figure 14 shows the temperature distributions across the solidifying shell and the mushy zone at different mould positions, whereas the surface temperature at different locations from meniscus is illustrated in Fig. 15. In these models, an optimised mesh and time step, similar to that adopted for the 1D present model slab casting simulation, were used.53 The relative average errors are given in equations (16a) and (16b) for the temperature distributions and surface temperature respectively31,
44
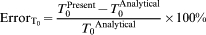

Temperatures through solidifying shell at different mould locations compared with Kristiansson52 analytical solution
Simulated surface temperatures of present model compared with El-Bealy3 measurements at a) 2.5, b) 6 and c) 12 m from meniscus
Predicted results
The results of three simulations of proposed cooling pattern between a pair of rolls at different levels from meniscus as well as the simulation of traditional cooling pattern are presented and discussed here in the section.
Case 1
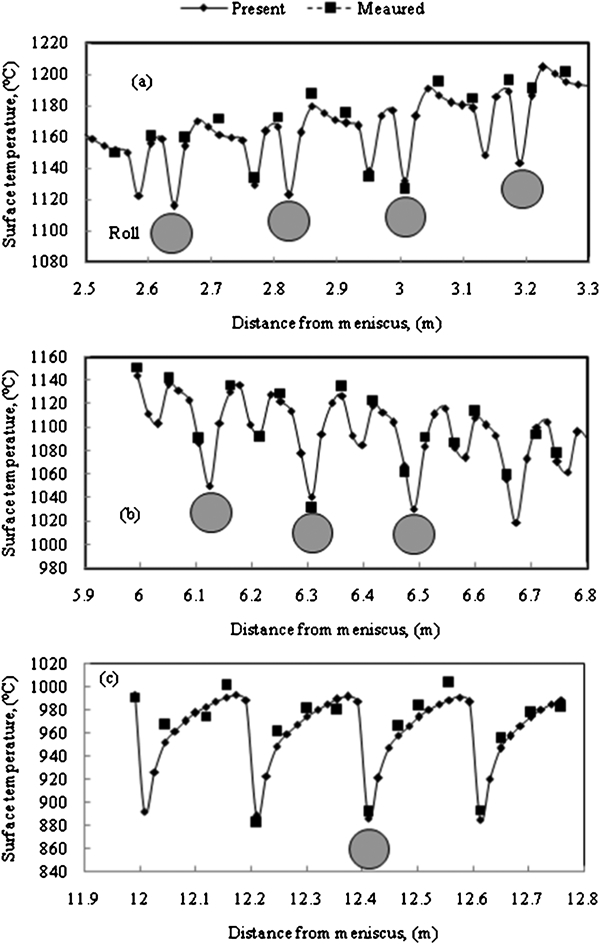
Case 1 compares the heat transfer coefficient ‘h’, surface temperature ‘T 0’ and the coherent solid shell resistance ‘I c’ of the cooling pattern of heat 2, at 2 m from the meniscus, with those values from the traditional cooling pattern of heat 6, and these are shown in Fig. 16.
Comparisons of a Newtonian heat transfer coefficient, b surface temperature and c coherent solid shell resistance between heats 1 and 2
Figure 16a illustrates the comparisons of h of different nozzle outlet designs within the spray cooling zone II illustrated in Fig. 12. In general, the predicted results show that h fluctuates rapidly between a pair of rolls for different cooling regions with various cooling patterns. In the roll contact region shown in Figs. 2, h increases rapidly to the peak values of 500 and 525 (W m−2 K−1) for cone (normal) and elliptic (new) nozzle outlet designs respectively, where the conduction mode controls the heat transfer process in the region due to contact the roll and slab surfaces.21 The difference between the peak values of different nozzle outlets is due to the effect of direct spray area in the case of elliptic cooling pattern in the unsprayed cooling region (Fig. 2b ), followed by the roll contact region (Fig. 2a ). This effect cools the roll surface in the roll contact region and increases h in this region. This is followed by a rapid decrease in h in the unsprayed region to minimum values of 80 and 100 (W m−2 K−1) for cone (normal) and elliptic (new) nozzle outlets designs respectively. This is due to the changing in the heat transfer mode from conduction into convective/radiation mode.21 As a result of the direct spray cooling effect, which results from the intersection of cooling patterns for roll nozzle and direct cooling nozzle shown in Fig. 2a , slight and direct sprayed cooling region is generated in the unsprayed region. This effect forces h to increases gradually by various cooling patterns based on the nozzle design as shown in Fig. 16a . In this region, h fluctuates slightly in the case of the cone nozzle design, whereas in the case of elliptic nozzle design, h increases continuously until the direct spray region of the extra nozzle. The slight effect for the different nozzle designs is due to the natural of water droplets and low boiling temperature of water.20, 21, 28 In the direct spray cooling region, h increases again into second peak values of 300 and 320 (W m−2 K−1) for cone and elliptic outlet designs respectively. The small disagreement between peak values is due to the dissimilarity conditions of fluid distribution in direct spray cooling region where the elliptic outlet gives higher degree of homogeneity than the cone nozzle type, but the difference is still small in this cooling region. Then, h drops suddenly into minimum values of 30 and 70 (W m−2 K−1) in the second unsprayed cooling region for normal cone and new elliptic designs respectively. The effect of elliptic water distribution is observed where h increases gradually into 80 (W m−2 K−1). Then, h increases again into the peak values in the roll contact region of second roll. Note that this cooling cycle repeats continuously between caster rolls with the same cooling mechanisms, as illustrated in Fig. 16a .
The surface temperature profiles shown in Fig. 16b illustrate the effect of various cooling patterns for different nozzle outlet designs on the fluctuation of surface temperature ‘Tφ ’ at level 2 m from meniscus. These profiles demonstrate that Tφ fluctuates rapidly and continuously between rolls based on the cooling conditions of different cooling regions and subregions between a pair of rolls. These profiles affect directly on the growth of coherent solid shell resistance between a pair of rolls.3, 12, 13 Subsequently, in the roll contact region, the slab surface cools rapidly and drops by values of 40 and 26°C (Fig. 16b ), for cone (normal) and elliptic (new) outlet designs respectively. This results from natural differences in the magnitude of h which varies due to the changing in the density distribution of various cooling patterns and therefore roll surface temperature.20, 21 Then, the slab surface reheats rapidly in the unsprayed region where Tφ increases by values of 50 and 48°C for normal and new nozzle designs respectively. It is interesting to note that there is no observed difference in reheating temperatures between different nozzles designs. This is due to the nature of the heat flow mode controlling heat transfer between the slab and roll surfaces. This means that the effect of the new outlet nozzle design has no significant effect compared with the normal one in this cooling region. This is followed by different slight cooling due to various cooling patterns. This behaviour continues until the slab surface enters into direct spray region. In the direct spray region, Tφ drops again by values of 27 and 29°C for normal and new outlet nozzle designs respectively. This is followed by another gradual reheating of slab surface when the slab surface enters into another unsprayed region through overlapping region shown in Fig. 2.28 Another interesting observation arises from the model predications where Tφ is approximately constant in the second unsprayed due to the effect of the overlapping spray cooling regions, which are generated with the cooling patterns of the new elliptical outlet nozzle design, where the new design shows more smooth temperature profile than the normal one. After this region, another drop in Tφ is observed at the roll contact area for the second roll. In general, it is noted that the slab surface temperature reheats in this cooling zone with normal design, whereas it cools with new one. This is due to smooth surface temperature profile and the rapid fluctuations of surface temperature almost disappear between a pair of rolls.28
Simultaneous coherent solid shell resistance ‘I c’ is also often used as a criterion for measuring the resistance against different thermometallurgical and mechanical stresses subjected to the slab. Also, this criterion affects significantly the movement of dendrites in and out against the ferrostatic head, which influences on the fluid flow of molten steel in liquid pool close to dendrite tips.38, 57, 58 As suggested elsewhere, this quantity was studied here for its importance under various cooling conditions, solidification phenomena and solid state phase transformation processes. Therefore, to examine the influence of different nozzle designs on I c or the ability of the coherent shell to resist different stresses and to control the fluid flow, the model was used to simulate I c for different nozzle designs at level 2 m from meniscus and the results are shown in Fig. 16c . The figure illustrates that I c increases continuously with distance from meniscus by different development rates and profiles. In the case of normal design, I c shows a very small growth between the rolls with slight fluctuations or drops in the roll contact regions, whereas in the case of new design, I c grows continuously with distance from meniscus with high growth rate. These drops are due to the steep temperature gradient associated with rapid surface cooling in this cooling region.12, 21 The predicted results show also a slowdown of I c growth in unsprayed cooling regions as shown in Figs. 16c . This is because the rapid reheating of slab surface and small temperature gradient, which forces the position of neutral axes away from the slab surface.12, 13 In the direct spray cooling region, the development of I c depends completely on the water distribution where the predicted results show that I c of new nozzle design grows by higher rate than the normal one. Therefore, these results can be considered as a positive sign for improving the cooling patterns and thus minimisation of the slab internal defects12 due to the increase in the resistance against thermometallurgical and mechanical stresses12 and therefore, more control of fluid flow of liquid molten steel in the liquid pool close to dendrites tips when the new design is applied.58
Case 2
This simulation was carried out to study and compare the effects of different cooling patterns of various outlet nozzle designs for heats 2 and 8 in cooling zone III at 6 m from the meniscus (Fig. 12), on the heat transfer coefficients ‘h’, surface temperatures ‘T 0’ and coherent solid shell resistances ‘I c’. These comparisons are shown in Fig. 17.
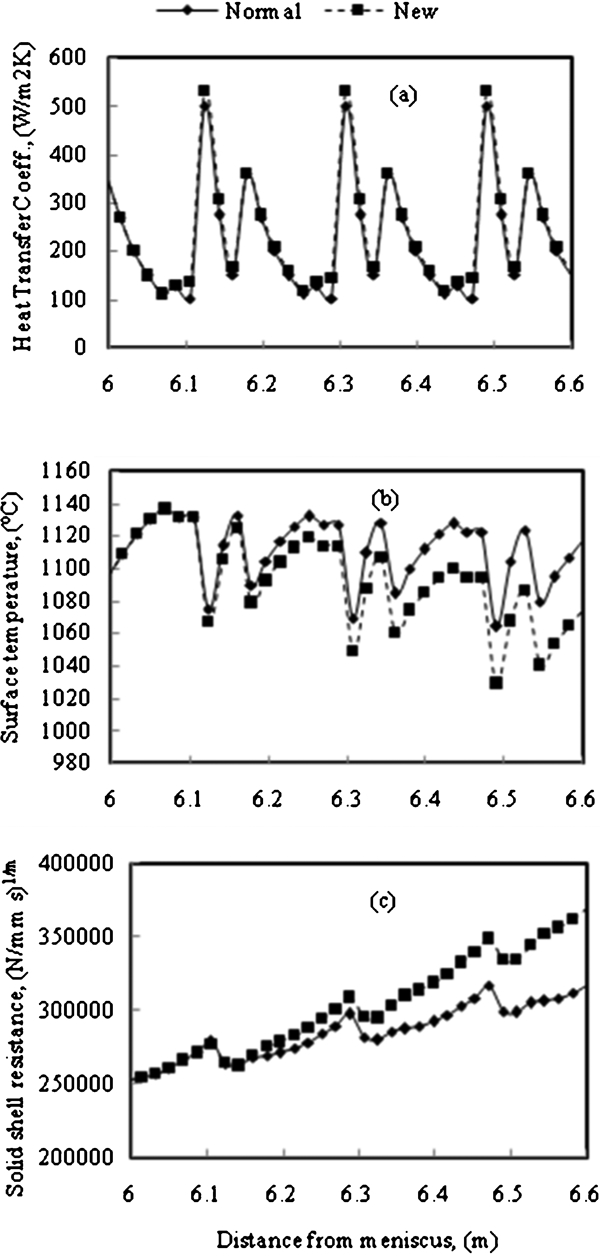
Comparisons of a Newtonian heat transfer coefficient, b surface temperature and c coherent solid shell resistance between heats 1 and 3
Figure 17a shows the comparisons of predicted h for different nozzle designs in the spray cooling zone III shown in Fig. 12. The same trend is observed in different cooling regions between a pair of rolls and the quantitative differences only appear to be due to the changes the roll diameter, distance between a pairs of rolls and water flowrate. Consequently, h increases steeply into the peak values by 500 and 532 (W m−2 K−1) for cone (normal) and elliptical (new) outlet nozzle designs respectively in the roll contact region. It is interesting to note that surface temperature peak of new nozzle design increases slightly in this case than its value in case 1. This is followed by a rapid decrease into the minimum values of 151 and 166 (W m−2 K−1) in the unsprayed cooling region for cone and elliptical nozzle types respectively.21, 28, 50, 59 In the unsprayed area, the cooling profiles of different nozzle designs behave differently until entering into the direct spray region between a pair of rolls. In the case of normal nozzle design and in overlapping subregion between the roll and extra cooling nozzles, h increases slowly followed by slight decreasing as shown in Fig. 17a . However, in the case of new nozzle design, h increases slightly until the slab surface enters into the direct spray region due to a weak direct spray cooling associated with elliptic shape of new outlet nozzle design. This is because of the increasing distance from the rolls and decreasing in water flowrate (Table 2). In the direct spray region, h increases rapidly into a high value of 360 (W m−2 K−1) for normal and new nozzle designs. The similarity in h values is only due to the similarity in water density distributions in the centre of this cooling region and constant water flowrates in both the cooling patterns.20, 21, 50, 59 In the second unsprayed region in the direction of casting, h decreases gradually until the minimum value of 111 (W m−2 K−1) for normal nozzle design. In the case of new nozzle design, h profile behaves in a different way due to the difference in the density distribution of cooling pattern, where h deceases only into 118 (W m−2 K−1) as illustrated in Fig. 17a . This is because of the formation of direct spray cooling area in unsprayed cooling region due to the overlapping area associated with intersection between the cooling nozzles. This zone is longer in case of new nozzle design than in the case of normal one as seen in Fig. 17a where the elliptical flow distribution cools directly and improves h and its profile in this area. Then, h starts to increases rapidly again into a maximum value on the second contact roll region for all the nozzle designs.
Figure 17b shows the comparisons of predicated the surface temperature ‘Tφ ’ for different nozzle designs in the spray cooling zone III shown in Fig. 12. Not surprisingly, the surface temperature for this case is very similar to case 1.20, 21 In the roll contact area, Tφ drops into minimum values of 62·7 and 70°C for cone (normal) and elliptical (new) outlet designs respectively. The reason behind the increase in the drop of the surface temperature is due to the increasing possibility to cool the roll surface. With increasing the ferrostatic head, this results in a good contact between slab and roll surfaces. Therefore, this affects directly the conduction mechanism and increases the heat transfer flux through a perfect contact between slab and roll surfaces.60 Then, Tφ jumps up to a maximum reheating temperature in the unsprayed region by different values based on the nozzle type. These values are 59 and 57·6°C for normal and new water nozzle designs respectively. It is observed from these results that the difference in the slab surface reheating is not high, but the significant difference is in the behaviour of surface temperature profiles based on the various cooling patterns shown in Fig. 2. These different behaviours result from overlapping of direct sprays cooling generated in the unsprayed cooling region. These are due to the nozzle outlet designs and the ability of water density distributions to cover the restricted areas between slab and roll surfaces in this cooling region.20, 21 Tφ decreases again gradually within 28 and 20°C for normal and new nozzle designs respectively, until the slab surface enters into the direct cooling spray region. In the direct cooling spray region, Tφ falls again by values 44 and 46°C. This is followed by another gradual surface reheating by different values based on the nozzle design. These values are 42·8 and 39·9°C for normal and new nozzles respectively. These predications show another interesting phenomenon where the new nozzle design has significant effect on the reheating surface temperature in the first and second unsprayed regions. After this region, the slab surface starts to enter again into another a roll contact region. In this region, Tφ drops again into minimum values of surface cooling mechanism for all various water nozzle designs.
Figure 17c illustrates that coherent solid shell resistance ‘I c’ increases continuously with distance from meniscus by different rates, where the effects of surface reheating mechanism on I c are insufficient. The results also show that the I c value of the proposed design increases by higher rate than the normal water nozzle. This rate increases with distance from meniscus in the same cooling zone. Owing to high cooling of slab surface in the roll contact area, it is observed that I c jumps down when the slab and roll surfaces have a good contact area and then grows gradually. This agrees well with ceramic sprayed roll technique proposed by El-Bealy,60 and three-span caster roll designed by Voest Alpine.61 These techniques minimise the roll deflection60, 61 by reducing the heat flux from slab into the roll which results in decreasing in the drops of Ic in the roll contact region or by reducing the effect of effective roll span on the deflection. This may help to improve the inner quality of continuously cast steel slabs due to increasing the resistance against different types of stresses subjected to the slab and therefore optimising the fluid flow of steel in the liquid pool close to the dendrite tips and in the mushy zone.57, 58 Therefore, it can prevent halfway cracks, heavy positive segregation formation in different internal slab structure.
Case 3
In the case of spray cooling zone V at 14 m from meniscus, the comparisons between the behaviour of the heat transfer coefficients ‘h’, surface temperatures ‘T 0’ and the coherent solid shell resistances ‘I c’ for heats 2 and 11 with normal and new nozzle designs are shown in Fig. 18. It is predictable that the profiles of h, T 0 and I c in this cooling zone are very similar to cases 1 and 2 with little differences in details.
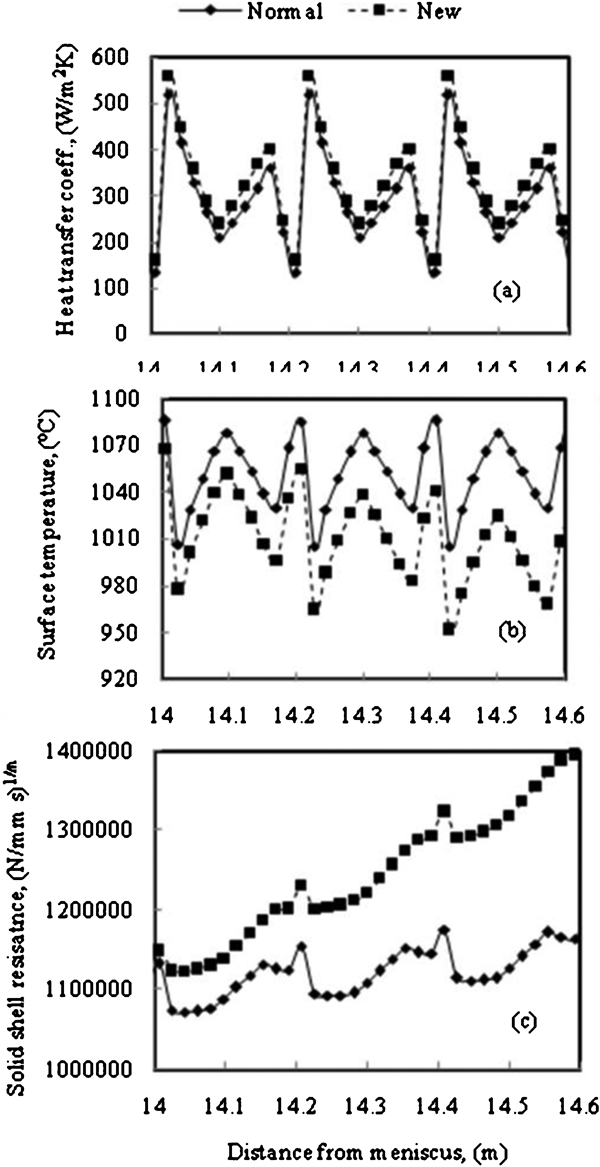
Comparisons of a Newtonian heat transfer coefficient, b surface temperature and c coherent solid shell resistance between heats 1 and 4
Figure 18a shows that the heat transfer coefficient ‘h’ increases suddenly into peak values of 520 and 560 (W m−2 K−1) in the roll contact region for cone (normal) and elliptical (new) outlet nozzle designs respectively. This is followed by a gradual decrease in h until different minimum values of various nozzle designs in the unsprayed cooling region. The cone nozzle design has a peak value of 210 (W m−2 K−1), whereas the elliptical nozzle design gives an increase to 240 (W m−2 K−1). An interesting observation comes from the examination of computed h profiles for different nozzle designs, where the overlapping cooling area between roll and direct spray nozzles disappears. This is because of increase in the distance between a pair of rolls in this cooling zone (Table 2), where the water density distribution is not sufficient to stop the reduction in h until h enters into the direct spray cooling.20, 21 As the slab surface enters into the direct spray cooling, the heat transfer coefficient increases again into high values of 360 and 400 (W m−2 K−1) for normal and new nozzle designs respectively. Then, h decreases steeply again into minimum values by 135 and 160 (W m−2 K−1) for the normal and new nozzle designs respectively, without overlapping spray cooling region. This is followed by a sudden increasing in h again in roll contact region of next roll.
The profiles of surface temperature shown in Fig. 18b illustrate the comparisons between Tφ histories in spray cooling zone V for different water nozzle designs. The similar trend of surface temperature profiles is observed in the different cooling regions between a pair of rolls for different water nozzles. In the roll contact region, Tφ falls into the minimum values due to the conduction mode, whereas in the unsprayed subregion, Tφ jumps up into the maximum value due to changing in the heat transfer mode from conduction into convection and radiation for different water nozzle designs. Tφ reaches a maximum reduction value by 80 and 89°C in the roll contact region, whereas Tφ raises steeply into maximum reheating values by 73 and 71°C in the unsprayed area for normal and new water nozzles respectively. The high cooling mechanism associated with cooling slab surface in this case is due to a good contact between slab and roll surfaces. This happens when the ferrostatic head reaches a maximum value. As the slab moves, this fluctuation continues and rapid surface cooling appears again and attains maximum cooling values by 48·2 and 55°C for normal and new nozzle designs respectively. It is interesting to note that the cooling effect of the new nozzle design is greater than that of the original nozzle due to improved water density distribution with the same water flowrate. This is followed by gradual surface reheating through second unsprayed region as show in Fig. 18b . Tφ increases continuously before the slab surface enters into another roll contact area, where Tφ rises by 1085 and 1040°C for normal and new nozzle designs respectively. When the surface of the slab enters into the second roll contact region, Tφ goes down into the minimum surface temperature of 1028 and 975°C, for the same above arrangement respectively.
The importance of the coherent solid shell resistance ‘I c’ profile between a pair of rolls is illustrated in Fig. 18c . Although the figure illustrates that I c increases continuously between a pair of rolls at cooling zone V by different rates, the predicted results show a noticeable drops in the roll contact regions. These drops are followed by slow and continuous growth of I c in unsprayed cooling regions as illustrated in Fig. 18c . This is because the rapid cooling of slab surface forces the position of neutral axes out close to the slab surface and the value of I c decreases.12, 13 This affects negatively on the bugling level and its effect on the movements of dendrites, which forces the steel liquid in the liquid pool to squeeze in and out mushy zone. This results in formation of different segregation phenomena.57, 58 This predicted comparison shows also that the growth of I c in the case of new nozzle is higher than its growth with normal one, and these growth rates increase with distance from meniscus from roll to roll for both nozzle designs.
General discussion
Mechanism of microthermomechanical rigidity criterion and cooling pattern
Knowledge of the contribution of the cooling pattern design to ‘h’ and ‘I c’ between a pair of rolls is necessary to indicate the development in which the thermomechanical rigidity ‘Mic-TMR’ can be controlled by adjustments to the spray flowrate and distribution of the spray nozzles, the characteristics of roll design and the roll surface material.3, 28, 60, 61 In order to characterise the optimum operating conditions accurately and to improve the inner quality of continuously cast steel slab, Mic-TMR between a pair of rolls is proposed in this study.
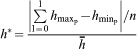
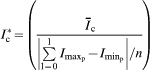
Before proceeding further, it is appropriate to discuss the thermomechanical rigidity criterion Mic-TMR presented in equation (11) and its parameters described in equations (10b) and (10c). This is with respect to the system parameters, degree of inhomogeneity of the cooling patterns h
*, the fluctuation degree of solid shell resistance 

In order to demonstrate the effect of various microthermomechanical rigidity parameters, the variations of the degree of homogeneity of the cooling pattern ‘1/h
*’ and the degree of homogeneity of solid shell resistance ‘


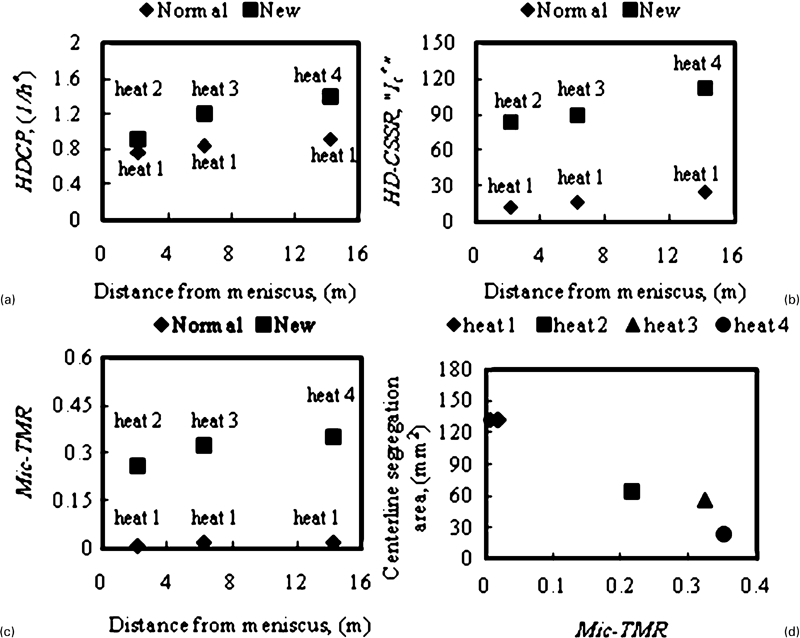
Variations of a homogeneity degree of cooling pattern, b homogeneity degree of coherent solid shell resistance, c microthermomechanical rigidity with distance from meniscus and d centreline segregation area with microthermomechanical rigidity for different heats
For examining the effect of thermomechanical rigidity ‘Mic-TMR’ on the internal microquality, especially its effect on centreline segregation phenomenon, the magnitude of Mic-TMR and its effects on centreline segregation phenomenon for different nozzle designs are shown in Fig. 19c and d , at various cooling spray zones. Figure 19c shows that Mic-TMR is very small in the case of the normal nozzle design, whereas, in the case of the new design, it increases observably. Also, Mic-TMR increases gradually with distance from meniscus for different heats. Figure 19d shows that the area of centreline segregation is constant in the case of heat 2 with the normal nozzle design, whereas it decreases steeply in the case of heats 6, 8 and 11 with the new nozzle design at different locations from meniscus. It is interesting to note that the effect of Mic-TMR on the centreline segregation increases when the new nozzle was applied at 14·4 m from meniscus. These results agree well with the thermal soft reduction technique proposed by Engström et al.,6 Jacobsson et al. 16 and Raihle and Fredriksson.17 This may help to prevent centreline segregation and improve the inner quality of continuously cast steel slabs.
Mechanism of centreline segregates
The results of the mathematical model simulations, combined with experimental results of collected samples, lead to a consistent mechanism for the formation of centreline segregates in continuously cast carbon steel slabs. Before proceeding further, it is important to explain the effect of positive and negative bulging shapes on the movement of mushy dendrites and therefore on the interdendritic liquid fluid flow between the dendrites and liquid pool as explained by Flemings58 and shown in Fig. 20a–c . As the slab moves down and the solid shell bulges out in region A, as shown in Fig. 20a , the mushy dendrites draw out and squeeze the interdendritic liquid to flow into slab centre against the high resistance of ferrostatic pressure, as illustrated in Fig. 20b . The preceding mechanism increases the possibility of negative segregation areas close to the slab centreline shown in Fig. 20c . This mechanism continues until the location of maximum positive bulging between a pair of rolls where the width of region A (Fig. 20a ) controls the width of the negative segregation area. Then, the solid shell starts to bulge in and pushes the mushy dendrites in the direction of slab centre. This draws the steel liquid from the hotter region in the liquid pool into the mushy zone just blow the liquidus line. With decreasing bulging in region B, the opening of the dendrites increases, through which the interdendritic liquid just blow the liquidus isotherm flows in against little resistance aided by the ferrostatic pressure that helps to push the interdendritic liquid into cooler regions in the mushy zone to segregate. At the roll contact area, the coherent solid shell deceases steeply as illustrated in cases 2 and 3 with the normal nozzle design (Figs. 17c and 18c ), which results in a sudden force pushing the fluid flow from hotter region in slab centre into the interdendritic areas in the mushy zone. These mechanisms are defined as interdendritic fluid flow patterns of pumping (1)/sucking (2) process and were illustrated in Fig. 20d .3, 4, 36
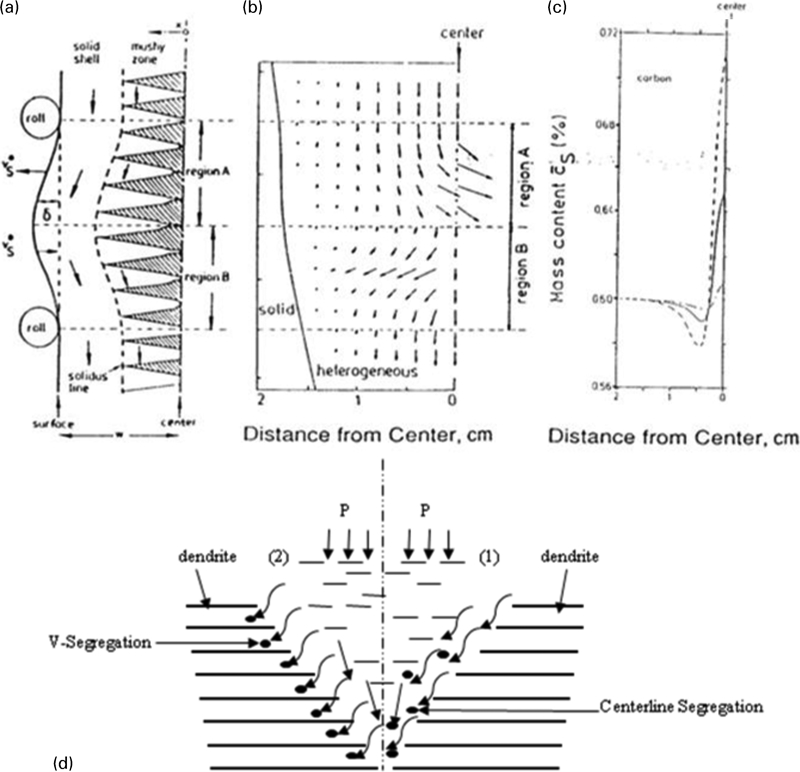
The above process suggests a number of different mechanisms for the formation of centreline segregate such as centreline macrosegregation and V type off-centre semimacrosegregation. At the final stages of slab solidification, the dendrites draw out and reject the rich solute into the slab centre as seen in Fig. 20d(1), which results in centreline segregation. As this mechanism continues, the distance between the dendrites tips increases and draws the rich liquid down from upper hotter regions to increase the centreline segregation as illustrated in Fig. 20d(1).58 This mechanism continues until the slab solid shell reaches its maximum thickness between a pair of rolls. This gives us a good explanation about the question why the vertical slab casters have serious and higher centreline segregation than the curved slab machines. This is due to a continuous increasing in the ferrostatic pressure with distance from meniscus in the case of vertical casters, which results in high force of interdendritic liquid to feed into the central slab areas and generates high centreline positive segregation.63 Then, the rich solute flow changes its direction to into the mushy zone to form V segregation as illustrated in Fig. 20d(2). This process continues until the slab reaches the roll contact area where the final shape of V segregation forms. The different types of centreline segregate depend on the operating conditions and their effect on the solidification, coherent solid shell and therefore on the bulging history, as shown in Fig. 20d .
Conclusions
Using the proposed mathematical model and experimental results in the present investigation, a detailed numerical study was conducted for 1D heat transfer/solidification and coherent solid shell resistance to test the effect of different secondary cooling spray nozzle designs on the microthermomechanical rigidity criterion and therefore on the formation of different types of centreline segregates of continuously cast steel slabs. The following main conclusions can be drawn from the present investigation:
The knowledge of detailed profiles of heat transfer coefficient ‘h’, surface temperature ‘Tφ ’ and coherent solid shell resistance ‘I c’ between a pair of rolls are essential for improving the internal quality of continuously cast steel slabs.
As demonstrated in the present study, the proposed elliptical outlet nozzle design improves the degree of homogeneity of the cooling pattern between a pair of rolls (1/h *), which increases the solid shell resistance ‘I c’ and therefore, improves the thermomechanical rigidity (termed Mic-TMR number) against mechanical stresses in the continuous casting of steel slabs.
Through comparisons of two different designs, it is shown how the detailed nozzle design can affect the homogeneity of the cooling pattern between a pair of rolls and therefore influences the microthermomechanical rigidity and therefore internal quality of continuously cast steel slabs.
The formation of centreline macrosegregation and V segregation depend completely on the coherent solid shell resistance ‘I c’ history and the aim should be to maximise this at the end of liquid pool length and should keep I c to grow continuously in the distance between liquid pool end and the metallurgical length.
The microthermomechanical rigidity criterion ‘Mic-TMR’ is a helpful tool to examine and measure qualitatively internal microquality of continuously cast steel slabs.
Although the predications of the model are generally supported by the present experimental results and pervious theoretical results, it is necessary to create more investigations by both plant trials and numerical modelling to refine the model, solve the remaining problems and to apply the Mic-TMR technique in the metallurgical industries. Another important aspect of the future work is to explain accurately some of complicated defect mechanisms during secondary cooling zones in continuous casting of steel, especially internal interdendritic areas, segregation and interdendritic cracks. In this future work, we may prove the parameters affected the stages of formation of these defects that depend on the thermal fields, metallurgical processing and mechanical stresses generation.
Footnotes
Acknowledgements
The author is indebted to the Companies’ Chair of Swedish Iron Masters Association, Stockholm, Sweden, for financial support of this investigation. Also, his sincere gratitude to Professor H. Fredriksson, Royal Institute of Technology, Institute of Materials Processing, Department of Casting of Metals, Stockholm, Sweden, for his considerable supervision, guidance, helpful discussions throughout the work and valuable assistance (1990–1995). He also is grateful to Egyptian Iron and Steel Company, El-Tabien, Tabbin, Helwan in Egypt, who kindly supplied him with slab samples. The cooperation and assistance of leaders and operating personnel, particularly in the steel sectors, especially, Eng. S. Abd Rabh, former head of Steel Sectors and Central Metallurgical Laboratories, Eng. H. Riad, Egyptian Iron and Steel Company El-Tabien, Helwan, Egypt, during this work is gratefully acknowledged.