
Abstract
By combining a volume of fluid (VOF) and discrete phase model (DPM) multiphase flow models, a mathematical model is established to describe the gas and liquid two phase flow in a steelmaking converter with top and bottom combined blowing. The effect of the numbers and location of the bottom tuyeres and top lance height on the gas and liquid two phase flow are investigated and the prediction is validated by the reported actual measured results. The results show that the stirring energy of the combined blowing converter is mainly from buoyancy driven bottom blowing bubbles and the bottom tuyere arrangements have a significant impact on the bubbly plume of combined converter. The mixing efficiency using three bottom tuyeres is higher than the cases with two or four bottom tuyeres and the optimum placement for the bottom tuyeres is away from the centre of the bottom on 0·3D–0·4D (D is the diameter of converter bottom). The mixing time increases with the angle θ decreasing, which is between bottom tuyeres and trunnion, and 45° is suggested for the angle θ. The top lance height has little influence on the mixing efficiency for the combined blowing converter.
Introduction
In the converter steelmaking process, the application of top and bottom combined blowing technology aims to bring the slag–melt reactions closer to equilibrium and to homogenise both the temperature and the composition of the bath. However, the process still offers opportunities to further improve the steel quality and plant productivity. For example, the converter geometry, top lance configuration, number, dimension and arrangement of bottom elements, as well as the blowing gas rates, all affect the flow and mixing in converter. These parameters are of decisive importance for the oxidation process.
The oxygen steelmaking converter process is very complex, involving the top blowing supersonic jet, bottom blowing bubble plume flows and liquid metal and slag layer multiphase flows. There has been much research in both experimental and numerical simulation reported in past decades,1 – 15 but only few14, 15 deal with the simulation of combined blowing technologies.
Szekely et al. 7 presented a single phase flow model to describe the pool flow field for top blowing. In this model, a predetermined shape of the liquid surface induced by top blowing was used as a boundary condition. Similarly, Zhang et al. 8 improved the computational model, using two equation k−ϵ turbulence model and reduced density ρ = αρ g+(1−α)ρ l for simulating a top and bottom blowing converter. The gas fraction in the top–bottom blowing converter needed to be specified a priori and was usually obtained from empirical correlations.
With the development of computer technology and multiphase flow models, the volume of fluid (VOF) multiphase model was employed to describe gas–liquid two phase flow for a pure top blowing converter water model.9 – 13 Ersson et al. 9 described the flow field and surface deformation caused by an impinging jet under the gas flowrate ranging between 52 and 133 m s−1. The predicted penetration depth was found to agree well with experimental measurements.
The above literature mainly simulated the flow and interface of the gas–liquid two phases in the only top blowing water model, and the top blowing jet density was considered constant due to the low gas flowrate. However, in the actual converter smelting process, the top blowing gas flow is a supersonic jet and the gas compressibility has a great influence on its expansion and the impact force on the liquid surface. The density of supersonic jet should be calculated according to the ideal gas law.
For the mathematical simulation of combined blowing, Singh et al. 14 used the discrete phase model (DPM) to describe the gas–liquid two phase flow and optimise the bottom tuyere configuration, but the influence of top blowing on the liquid surface and the mixing efficiency were ignored. Odenthal et al. 15 used a mathematical model combining with the VOF and DPM16 to describe the gas–liquid two phase flow in the combined blowing converter and the splashing phenomena due to the impinging jet and the mixing time due to pure bottom blowing were investigated, but the mixing efficiency of top and bottom combined blowing were still not studied.
The focus of this paper was to develop a general mathematical model for a top–bottom combined blowing converter and the supersonic jet behaviour of four hole top lance is described with the compressible model. Through the combination of the VOF and DPM multiphase flow model, the flow field and mixing time of the top and bottom combined converter are described and the bottom tuyere arrangement was optimised.
Mathematical models
Gas–liquid phase flow equations in converter (VOF)
At the nozzle exit, the flow mach number of supersonic jet is ∼2·0 for the top blowing. Since the compressibility of gas flow has important implications on the attenuation law of the supersonic jet, the three-dimensional, compressible flow of oxygen inside and outside the nozzle is simulated to yield the basic flow effects.
Mass conservation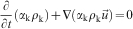


Momentum conservation


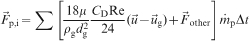
Equation of motion for bubbles (DMP)
The analysis of the bubbles plume is carried out via a Lagrangian approach, in which the trajectories of individual bubbles are determined stochastically in space. The time rate of change of velocity (product of proportional to mass and acceleration) of a discrete bubble is the result of various forces acting on the bubble. The appropriate form of Newton’s second law of motion is represented as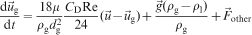


The drag coefficient C
Dis defined as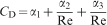


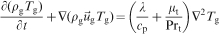
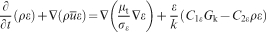
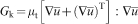
Turbulence models
The governing transport equations for turbulence kinetic energy k, and its dissipation rate ϵ, can be represented as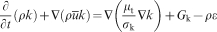

Species transport equations
In order to determine the mixing time in the vessel, the tracer dispersion equation, which is same as the species continuity equation, has been solved in the vessel.
Concentration


Boundary conditions and solution procedure
Figure 1 gives an overview of the computational domain. The top lance is formed by the four hole laval nozzle, and inclination angle between top lance and laval nozzle is 12°. The nozzle throat and exit diameter are 26 and 33·8 mm respectively and the nozzle throat length is 4 mm. The diameter of converter furnace is 3262 mm, and the bottom diameter is 2482 mm. The bath liquid height is 980 mm. Owing to large velocity gradient in the bottom area of the oxygen jet exit, the mesh density is increased for more accurate prediction of the flow field.
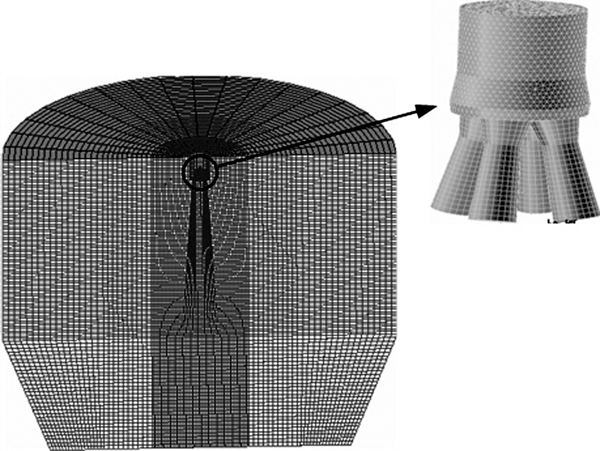
Mesh of converter and four hole lance nozzle
For the solution, the boundary conditions are set as follows. The velocity on the wall of the converter is set to zero and the no slip condition on the wall is prescribed. A standard wall function is used to model the turbulence characteristic close to the wall. At the inlet of the top lance, the pressure inlet condition is used, which is known from the site parameters. The inlet total pressure is identified as 0·83–0·93 MPa and the turbulence intensity is set to 2% with a turbulence viscosity ratio of 10 to start the calculations. The top surface of the converter is set to pressure outlet conditions, which is 0·11–0·12 MPa. The bottom blowing bubbles are assumed to expand rapidly at the bottom tuyeres and the break-up, coalescence and growth mechanism during the bubbles’ floatation are not considered in the present study. The bottom blowing flowrate is calculated as follows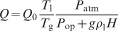
The discretisation of the computational domain is performed with the PRESTO scheme for the pressure and a second order upwind scheme for the transport equations. Pressure and velocity are coupled using the SIMPLEC scheme. The convergence of the equation are monitored by the whole field residual of each variable and when this variable fell below 10−4, the solution is assumed to have converged for that time step. The initial time step is 10−4 s, and the time step program is set to adaptive scheme of FLUENT.
Results and discussion
Fluid dynamic validation
In this section, the fluid dynamic of the top blowing is validated by experimental data presented in previous works.18 The geometry and boundary conditions of the model are consistent with the literature.
Figure 2 shows the comparison between numerical results and experimental data18 for dimensionless velocity attenuation along the jet axis under the same experimental conditions. The total stagnation pressures (driving pressure) of the top blown jet were 0·83 and 0·93 MPa. In this figure, the vertical axis is the dimensionless velocity, which is the ratio of gas velocity of jet axis and nozzle exit velocity (v/v 0). Abscissa is the ratio of the distance from the exit nozzle along jet axis and top lance throat diameter (x/d t). It can be noticed that the simulation results and measurement results are in a good agreement. When the high static pressure airflow passes through the laval nozzle, the pressure energy can be converted into gas kinetic energy. The gas flowrate increases rapidly and becomes supersonic flow. Owing to the static outlet pressure of the top lance is inconsistent with environmental pressures within the converter; there are fluctuations of supersonic jet near the top lance exit.
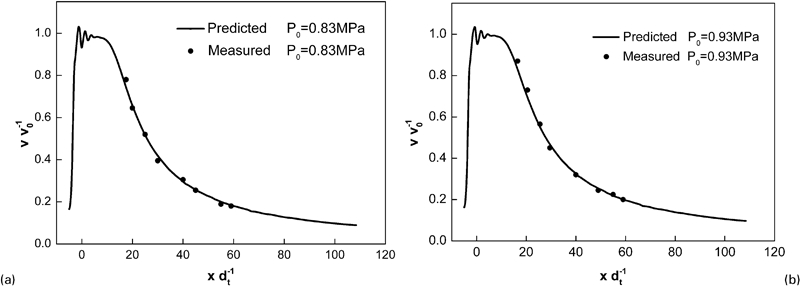
Comparison between predicted and measured for dimensionless velocity attenuation along jet axis
Figure 3 shows the comparison of actual measured and predicted results at level surface of 1050 mm under top lance exit end. It can be seen the simulation results are consistent with the measurements. The maximum value of gas velocity appears in the each jet axis, and the jet boundary interacts with each other.
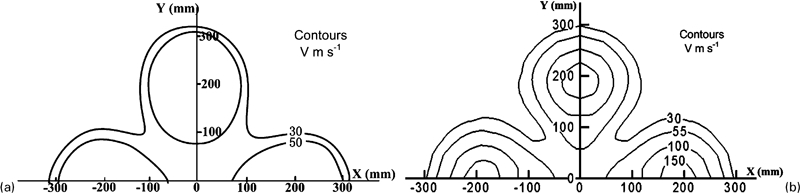
Comparison of a actual measured18 and b predicted at level of 1050 mm under lance exit end
Comparison between pure top blowing and combined blowing
Figure 4 shows the velocity vector of molten steel under the only top blowing. The total stagnation pressure (driving pressure) of top blown lance is 0·83 MPa and lance height is 1·17 m (45d t). It can be seen from the figure that multiple independent penetration zone (pots) are formed due to the multijets impacting the molten steel surface. The molten steel moves from the penetration zone towards the wall and then down into the bath. A large recirculation loop is formed in the centre of the bath (between the axis and the wall).
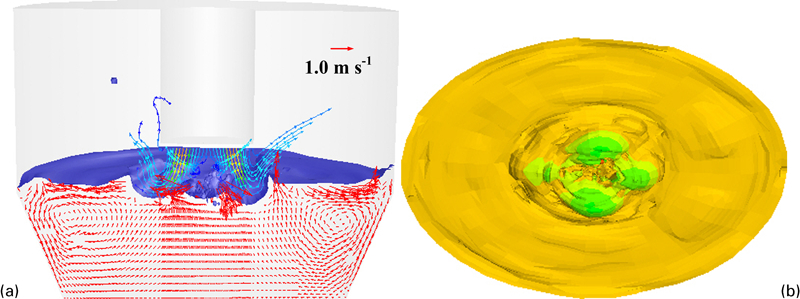
Predicted a flow field and b liquid surface of molten steel under pure top blowing
Figure 5a shows the flow field with top and bottom combined blowing, and Fig. 5b show the typical trajectory of bubbles predicted by DPM. The top blowing stagnation pressure is 0·83 MPa, and top lance height is 1·17 m (45d t). Bottom blowing is introduced through the three bottom tuyeres and the standard gas rate is 180 m3 h−1. Three hundred and twenty particle trajectories were calculated in each of the bottom tuyeres to ensure that the bubble trajectory is fully reflected and the bubbles turbulent fluctuations were superimposed by a stochastic tracking approach known as discrete random walk model. From Fig. 5, it can be seen that compared to the only top blowing, the bubbly plume flows are formed in the combined converter, and the bottom molten steel velocity increase due to bubbles buoyancy driven, which enhance the homogenisation of composition and temperature of the melt bath.
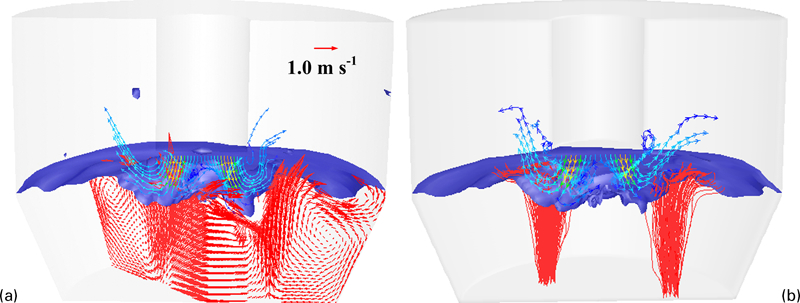
Predicted a flow field of molten steel and b typical trajectory of bubbles released from bottom tuyeres under combined blowing
Figure 6 shows the comparison between the only top blowing and combined blowing for contours of molten steel velocity. Clearly, under the top blown only, the stagnant region with the molten steel velocity less than 0·05 m s−1 appears at the bottom of the converter and it has a negative impact on the homogenisation of composition and temperature of the melt bath. But after combining with bottom blowing, the molten steel flow velocity at the bottom of the converter increases exponentially and more uniform in the converter bath.
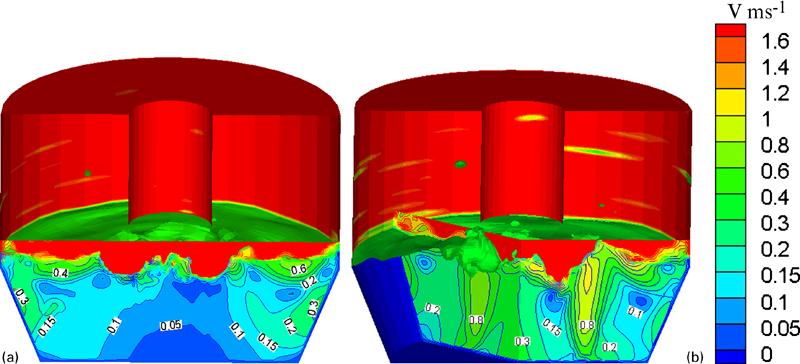
Comparison between a pure top blowing and b combined blowing for contours of molten steel velocity
The mixing process is evaluated by introducing a small amount of tracer into the domain at steady state flow conditions (t = t 0) and monitoring its dispersion at sampling positions. In the present model, t 0 = 240 s process of top and bottom combined blowing was calculated to ensure the full development of the flow field in converter. The initial time step was 10−4 s and the adaptive time step method of FLUENT was used according to global Courant Number. The global Courant Number was 2·0, the minimum time step was 10−4 s, and the maximum time step was 0·001 s. The calculation process required ∼150 h of CPU time on a 3·0 GHz PC. Then, the tracer was introduced into the domain at time t 0 = 240 s and the concentration of tracer (measurement of mass fraction at the point) at the five points had been monitored with the time (t−t 0). The schemes of the five monitoring points are shown in Fig. 7.
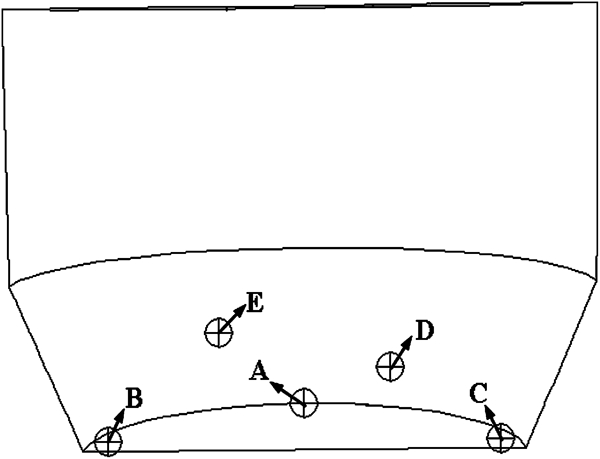
Arrangement of five monitoring points in converter
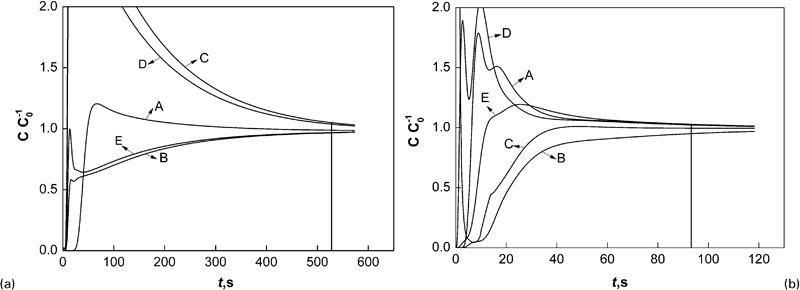
Figure 8 illustrates the process of uniform mixing time of top blowing only and combined blowing. In this picture, the C/C 0 represents the ratio of the mass fraction of the monitoring point at anytime and the average mass concentration. In the industrial experiment, the uniform mixing time is defined when the concentration ratio (C/C 0) of all monitoring points reach range of 0·95–1·05. From Fig. 8, it can been seen that the mixing time of the only top blown converter is ∼523 s and the mixing time of the combined blowing is ∼93 s. The top blowing oxygen jet energy mainly lost in non-elastic collisions and the agitation effect of top blowing for the bath is weak. The mixing power of the combined blowing converter comes mainly from buoyancy driven bubbles due to bottom blowing.
Mixing time of a pure top blowing and b combined blowing
Effect of number of bottom tuyeres
Figure 9 shows the arrangement of the different number of bottom tuyeres. In these cases, the top blowing parameters are identical, the number of bottom tuyeres increases from two to four and the distance from the tuyeres to the bottom centre of converter is 0·4D (D is the converter bottom diameter, m).
Arrangement of different numbers of bottom tuyeres
Figures 10 and 11 show the velocity vector and the contours of molten steel velocity under different number of bottom tuyeres for combined blowing converter. From Fig. 10, it can be seen that the fluid moves from bath bottom to the top surface and then towards the wall. Multiple large recirculation loops are formed between the bubbles plume flow and the side wall in the combined blowing converter.
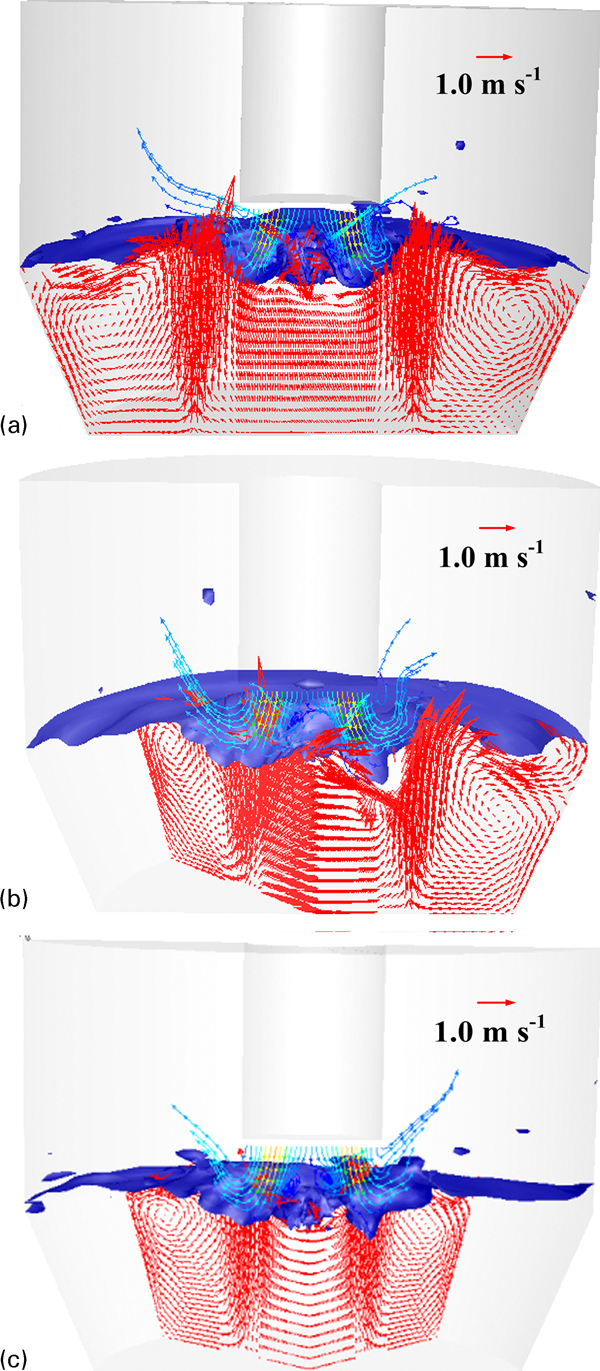
Flow field of molten steel under different numbers of bottom nozzles
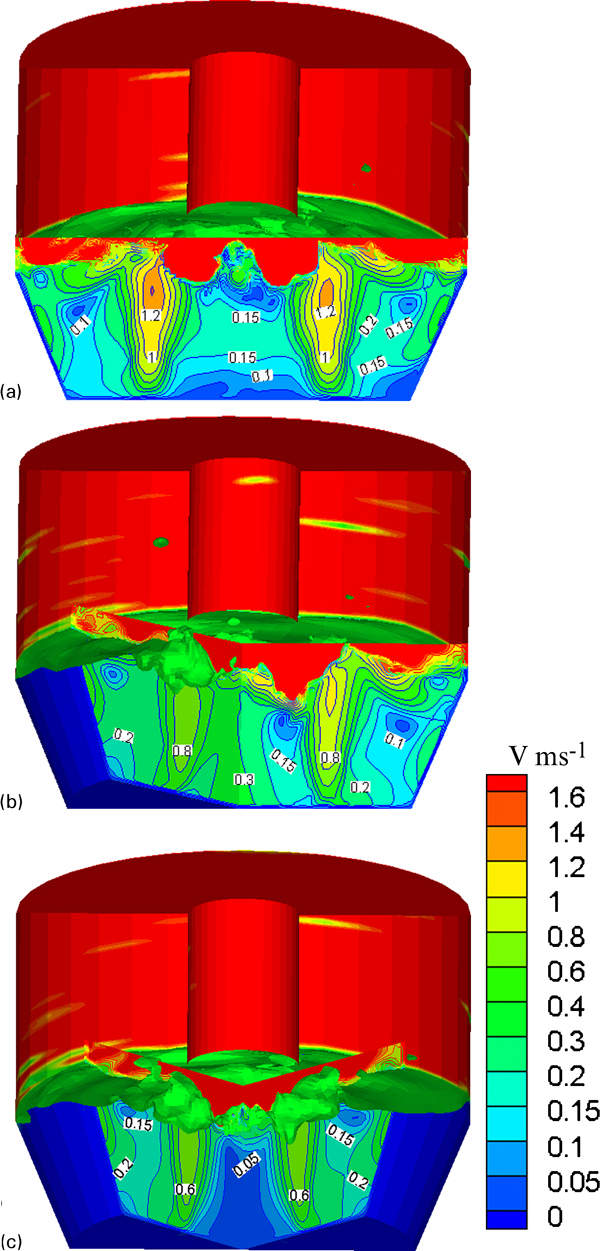
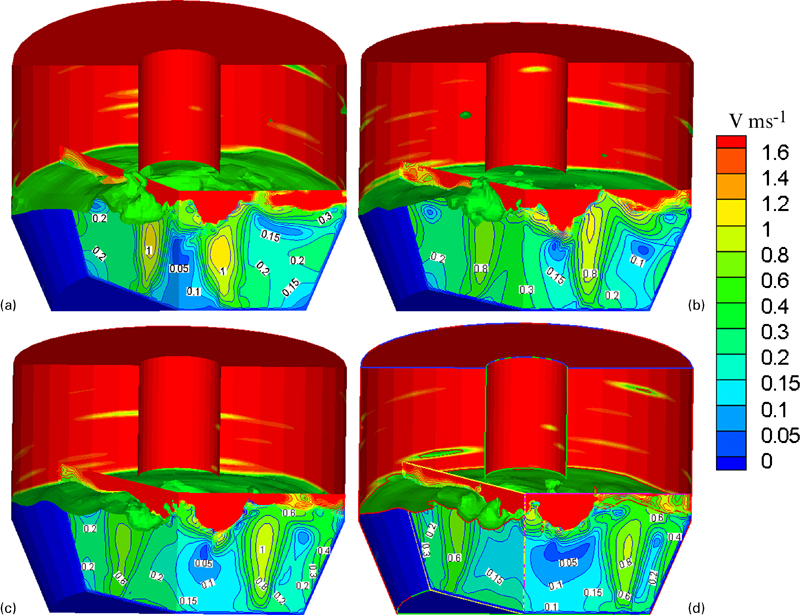
Contours of molten steel velocity under different numbers of bottom tuyeres
As can be seen from Fig. 11, with the four bottom tuyeres blowing, the molten steel flow of the pool centre is very weak, and the maximum velocity is ∼0·6 m s−1 in the gas–liquid phase plume centre. This is because, with the number of bottom tuyeres increases, the gas flow is dispersed and mixing power of each plume will decline and the entire pool area may be divided into multiple independent plumes zones among which the flow could not be mixed fully. However, when two bottom tuyeres are adopted for the combined blowing converter, the flow field is less uniform than the case with three tuyeres.
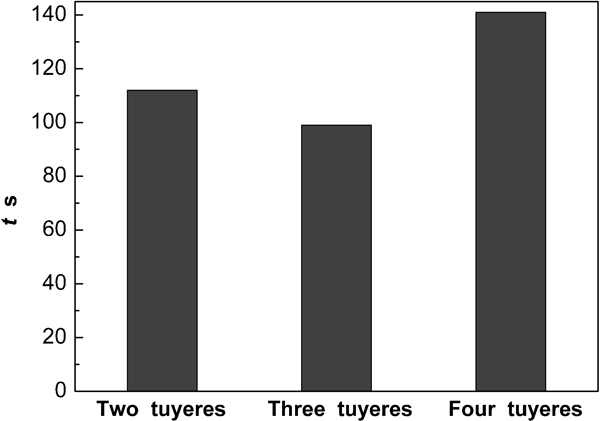
Figure 12 shows that, with the number of bottom tuyeres increasing from two to four, the mixing time firstly decreases, and then increases. The mixing time with three tuyeres is ∼99 s and the mixing time with four tuyeres is ∼141 s. The mixing efficiency using three bottom tuyeres performs better than the case of two or four bottom tuyeres.
Mixing time under different numbers of bottom tuyeres
Effect of locations of bottom tuyeres
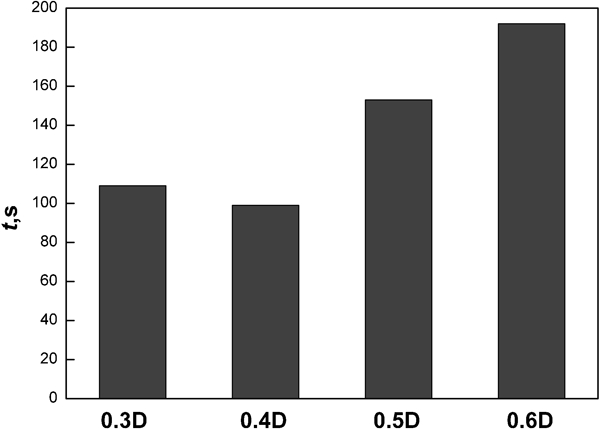
Figure 13 shows the arrangement of the different locations of the bottom tuyeres. In these cases, three bottom tuyeres adopted in the top bottom combined blowing converter are placed symmetrically to the trunnion of converter. The distances from the tuyeres to the bottom centre of converter are 0·3D, 0·4D, 0·5D and 0·6D respectively.
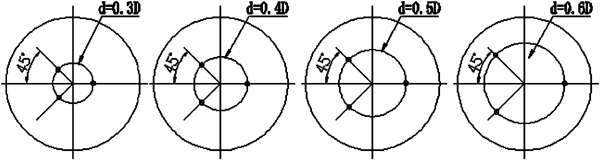
Arrangement of different locations of bottom tuyeres
Figure 14 shows the predicted contours of molten steel velocity under different bottom tuyere locations. It can be seen that with the increasing distance from the tuyeres to the bottom centre of converter, the low velocity area of the molten steel at the centre of the melting pool becomes larger. This is because that with the tuyeres near the furnace wall, the molten steel circulation within the pool is blocked by the wall and the role of bottom blowing is not fully utilised. However, when the bottom tuyeres are located at 0·3D, the lower velocity zone is also formed in the centre region of converter. The reason is that the distance of the tuyere arrangement from the bottom centre is too close, the bottom blowing bubbling and the top blown jet flows collide, thus the energy are consumed.
Contours of molten steel velocity under different location of bottom tuyeres
Figure 15 shows the mixing time for different distances from the tuyeres to the bottom centre of converter. It is seen that the mixing time decreases initially, then increases with increasing distance. When the bottom tuyeres are located at 0·4D, the minimum mixing time occurs in the converter, and the mixing time increases rapidly after the bottom tuyeres position more than 0·4D. The optimum range of the location of the bottom nozzle away from the axis is 0·3D to 0·4D.
Mixing time under different locations of bottom tuyeres
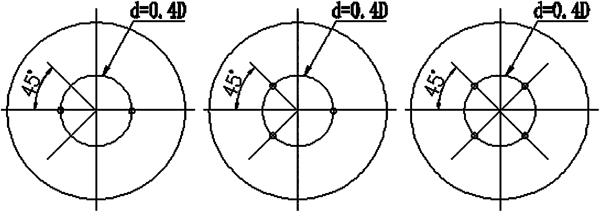
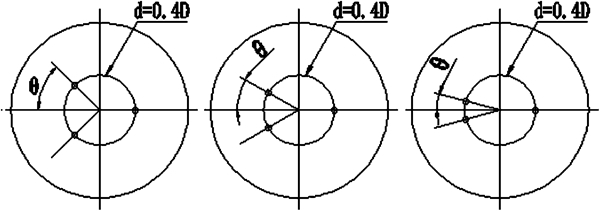
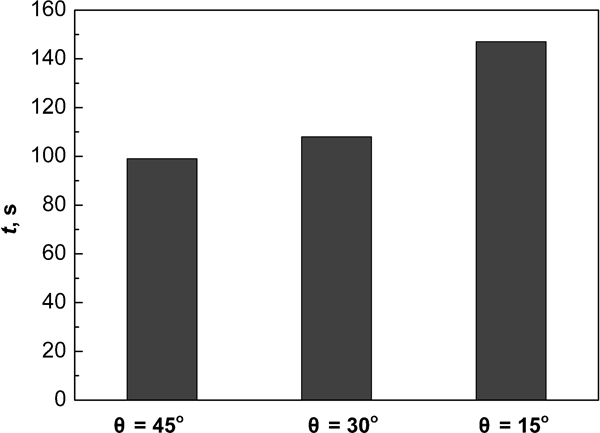
Figure 16 shows the arrangement of the different angles for the bottom tuyeres. In these three cases, the distance from the tuyeres to the bottom centre of converter is 0·4D. The values of the angles θ are 45, 30 and 15° respectively.
Arrangement of different angles θ for bottom tuyeres
Figure 17 shows the predicted contours of liquid velocity with different angles of θ. It can be seen that with angle θ reducing from 45 to 15°, the low velocity area of the molten steel in the centre of the melting pool becomes larger. Owing to the opposite circulation trends in the central region between the bubbly plume, molten steel, flow is weak in this region. The smaller the angle, the greater interaction between the bubble plumes and the lower the flow velocity of liquid steel. Furthermore, with the angle θ reducing, the bubble plume shifts to the centre of the combined blowing converter and the circulation flow between the bubbly plumes and side wall becomes weak.
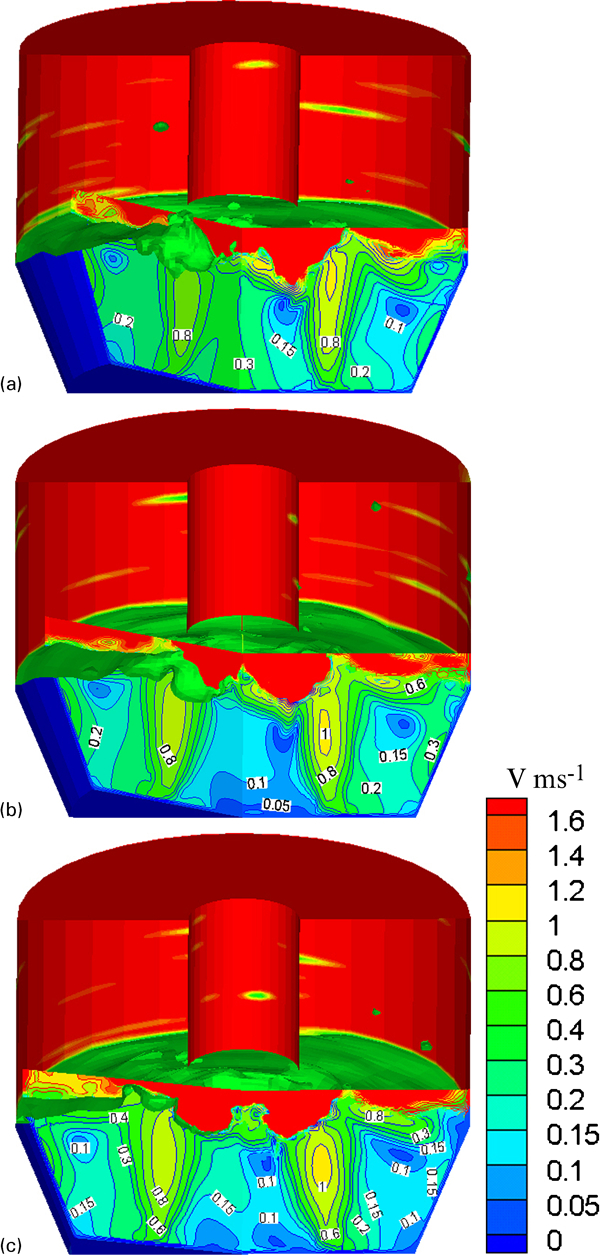
Contours of molten steel velocity under different angles θ of bottom tuyeres
The mixing time for different angles θ is shown in Fig. 18. It is seen that the mixing time increases with angle θ decreasing, and the mixing efficiency with 15° of the angle θ performs the worst and 45° is suggested for angle θ.
Mixing time under different locations of bottom tuyeres
Effect of top lance height
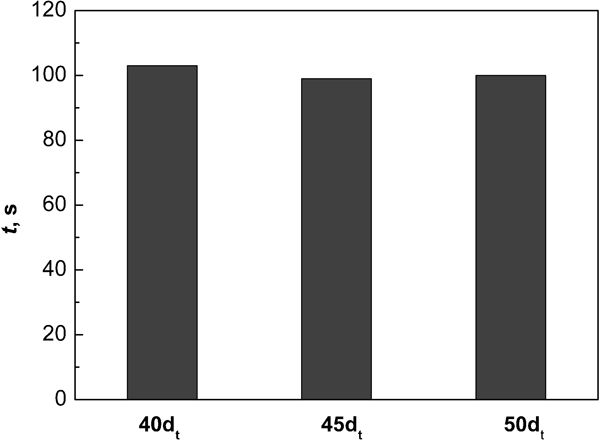
In order to investigate the impact of top lance height on the gas–liquid two phase flow of the combined blowing converter, all of the model parameters are identical except for the lance height. The value of lance heights are 40d t, 45d t, 55d t (d t is throat diameter of the laval nozzle) respectively.
Figure 19 provides the comparison of the simulated contours map of the steel velocity under different top lance height. It can be seen that with a decrease of lance height from 40d t to 50d t, the pots caused by the top blowing jets impacting the molten steel surface become shallower, but the steel liquid velocity has little increase. The reason is that the higher the top lance height, the smaller the impact force on the liquid surface and the less the energy losses due to the interaction between bottom blowing bubbling and the top blown jet.
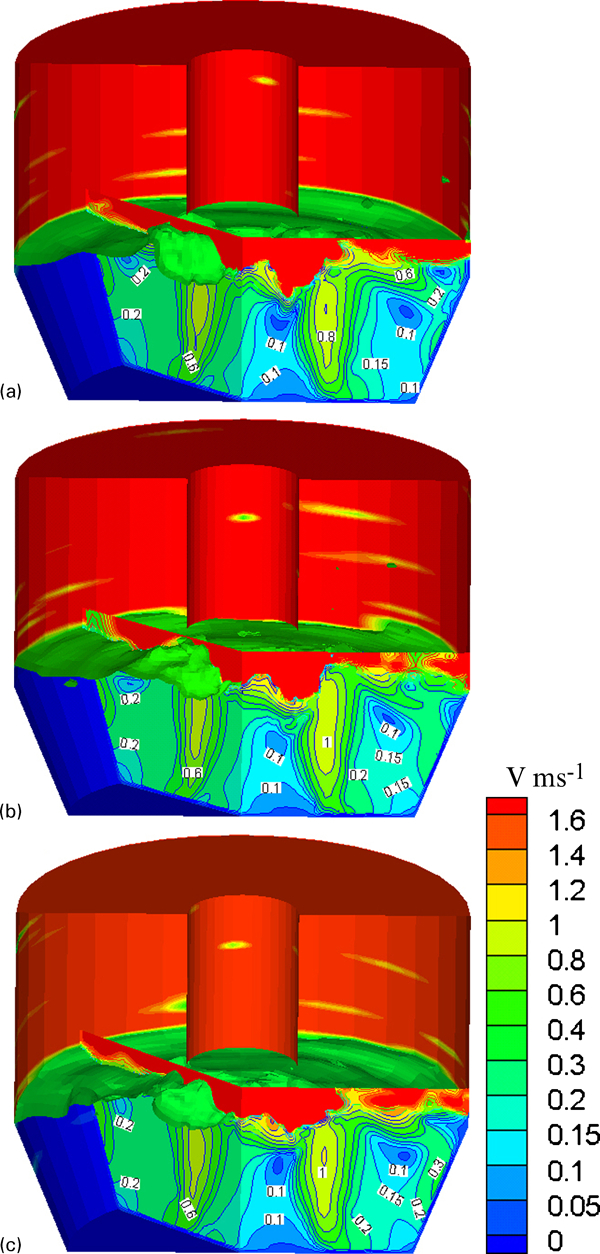
Contours of molten steel velocity under different top lance heights
Bath mixing time in the converter with different top lance heights is shown in Fig. 20. It is apparent that the mixing time decreases slightly as the top lance height increases; however, there is no big difference in bath mixing time. Overall, the lance height has little effect on the mixing time.
Mixing time under different top lance heights
Application
In the Fushun New Steel Company of China, the 40 t converter has been reconstructed with top and bottom combined blowing technology and the number and the arrangement of bottom tuyeres were adopted by the above mentioned optimisation. After the reconstruction of the converter, the homogenisation of composition and temperature of the melt bath have been enhanced due to superior dynamic conditions. The whole blowing process has become steadier and slag melting rate and decarburisation rate were improved with the reduced splashing. Additionally, unreacted lime in the slag has disappeared, the oxygen blowing time and converter melting cycle were reduced by 30–60 s and 90–120 s respectively. The cost of per ton of steel has reduced by about 10RMB.
Conclusions
A mathematical model is carried out to describe the gas and liquid two phase flow system in a steelmaking converter with the top and bottom combined blowing. By combining VOF and DPM multiphase flow models, the effect of the numbers and locations of the bottom tuyeres and top lance height on the liquid and gas flow are investigated and the prediction is validated by reported actual measured results. The results show that the mixing efficiency of only top blowing is weak and the mixing energy of the combined blowing converter is mainly from bottom blowing buoyancy driven bubbles and the bottom blowing parameters have a significant impact on the mixing efficiency. With the number of bottom tuyeres’ increasing from two to four, the mixing time firstly decreases, and then increases, and the mixing efficiency using three bottom tuyeres performs better. With an increasing distance of the tuyeres from the bottom centre of converter, the low velocity area of the molten steel at the centre of the melting pool becomes larger and the optimum placement of the bottom tuyeres should be local on 0·3D–0·4D. The mixing time increases with angle θ decreasing, and 45° is suggested for the angle θ. As the top lance height increases, the mixing time decreases slightly however there is no big difference in bath mixing time.