
Abstract
Coal box pressure has great significance in stamp charging car design. Because of the complexity of the dynamic constitutive relation of the coal powder, the pressure is usually considered in the design as a linear load, which presents neither the instantaneous maximum impact nor the variation during the stamping process, and therefore lacks accuracy. In this research, to obtain a more accurate box pressure, a series of field tests have been conducted, which included side wall tests, bottom plate tests and proof tests. The side wall and bottom plate pressures have been investigated through separating the pressure as ‘impulse pressure’ and ‘coal pressure’, which decouples the pressure curves from the side wall and bottom plate tests. As a consequence, a method to calculate box pressure at any time during the stamping has been derived through the analysis of statistic test results. To verify the method, a finite element method (FEM) model has been built and applied with pressures from the method. The FEM results fit well with the proof test result, which indicates that the method is capable of being used for stamp charging car design. In addition, the paper presents some statistic conclusions, such as stamping effect depth, which is useful for further researches.
Introduction
The stamp charging process is highly valued in coke making, for it not only increases the flexibility of the coal quality, but also improves the throughput of the oven.1 The stamping charging operation is accomplished in a coal box on a stamp charging car.
Recent research and experiments concerning stamp charging mainly focused on three aspects:
optimising the blending of material coal to improve coke quality2 – 4
elastic–plastic behaviour of a certain coal cake during stamping and effects such as stamping energy, to coal cake quality5 – 10
improvements on stamp charging manufacturing technique and car structure.11, 12
These researches concerned little about pressure on the coal box, which is the basis of a stamp charging car design. In current stamp coal box design, the pressure is usually considered as a linear load, which is not a true reflection of the process and lacks precision, e.g. the instantaneous stress of the structure cannot be identified and neither can the variation during the whole stamping process. As a result, the car design quality could be considered as flawed.
In civil engineering and soil mechanics, similar research has been carried out, especially on retaining walls13 and dynamic compaction;14 however, these achievements cannot easily be utilised directly because of the differences in either the boundary condition or the impact load. It should be noted that the coal cake stamping itself is a problem because of repeated impacting unsaturated material, which is difficult to solve by regular means.
Therefore, to determine the load on a stamp charging coal box, a test is necessary. In this research, the coal box pressure during stamping process was investigated through a field test. A methodology to analyse the coal box pressure is presented, in which the box pressure was split into ‘coal pressure’ p c and ‘impulse pressure’ p i, referring to ‘additional pressure’ as used in soil mechanics. Then, the two pressures, side wall pressure and bottom charging plate pressure, were investigated based on the results of the field test. Their p c and p i during the process were completed and reviewed. In addition, other factors, such as impact effect depth, were analysed. According to the analysis results, a method to calculate the coal box pressure at any time during the stamping process was derived and then verified by comparisons between finite element method (FEM) calculation results and proof test results.
This research provides direct support for stamp charging car design and sets a foundation for further studies on stamping coal stress and structure optimisation.
Field test
Introduction of stamp charging
The aim of the stamping operation is to compact coal powder to a density around 1100 kg m−3 by repeatedly hammering, before presenting the compacted coal into the oven. This process should make poorer quality coals available for coking and also increase the output. The whole process is accomplished in a metal box called the coal box.
A sketch of the coal box shown in Fig. 1 and consists of side walls, head and back boards. The side walls are supported by some frames (usually trusses) to counteract the impact load. Located above the box are a series of stamping hammers.
Sketch of stamp charging coal box
During stamping, moistured coal powder is poured continuously into the box from above, while the hammers fall periodically on the bulk surface in a certain order, compacting the powder into a solidified cake. The hammers are clamped to rolling cams to equal the falling distance (about 0·4 m). After stamping, the side walls are pulled back a little distance by four-bar linkages in the support frames and the head board is opened. Then the coal cake is pushed into the oven on the bottom charging plate.
Test situation
The in-site test was applied in a coke factory in north central China. The subject is an active 5·5 m stamp charging car with a coal box size of 16×0·5×5·5 m. The test aim was to determine the pressure on the side walls and the charging plate. The coke producing operation could not be interrupted and no modification to the car was allowed; otherwise, heavy economic losses would have been suffered.
Piezoresistive soil pressure sensors (Fig. 2) were used to acquire the coal pressure, with a measuring range up to 1 MPa according to the pretests, and the sampling frequency was 200 Hz.
Assembled sensor protect frame for side wall pressure test
Test procedure
The tests were categorised as side wall pressure test, bottom charging plate pressure test and proof test.
The side wall pressure is difficult to acquire in situ, because the coal box is too deep and narrow to set sensors. Even if fixed, there is a great chance that the sensors, or their leads, are crushed by the hammers during stamping, or scraped by the back board on charging. To solve this problem, a sensor protection frame was developed, which is a long board with 10 equidistant holes to fix 10 sensors and some magnets. Shown in Fig. 2 is an assembled frame. Leads are ranged inside, which are protected by the surface plate. Before stamping, the frame was put into the coal box and attached to the wall by magnets. The frame was pulled out before charging, to avoid the scraping and also to allow recycling of the sensors. Side wall pressures by the fourth, fifth, sixth and eighth hammer were tested three times for each.
In the bottom plate pressure test, the sensors were arranged on the charging plate, right under the middle of the stamping hammers. No locating device was needed, because the sensor position was held by the preloaded coal. It was noted that the leads were required to be attached to the wall tightly to avoid the hammer strike during stamping. Sensors in the bottom pressure test were disposable. The pressures under the fourth, fifth, sixth and eighth hammers were tested three times each.
The aim of the proof test was to verify the box pressure calculating method concluded from the results of pressure tests and to provide references for the side wall pressure during the field test to inspect the pressure result. The side wall proof test points were set on four-bar linkages inside the support frames; shown in Fig. 3 is a sketch of a four-bar linkage structure and its test points. There are four linkages arranged vertically inside one support frame. Three from the bottom were tested; the fourth was not tested as it was not possible to reach. The bottom plate proof test measured the strain at the bottom middle of the main beam, right under the charging plate. The proof tests were carried out three times, corresponding to the box pressure tests.
Four-bar linkage structure and test points for proof test
Test results
Analysing all the tests data, it can be concluded that the results by different hammers are similar.
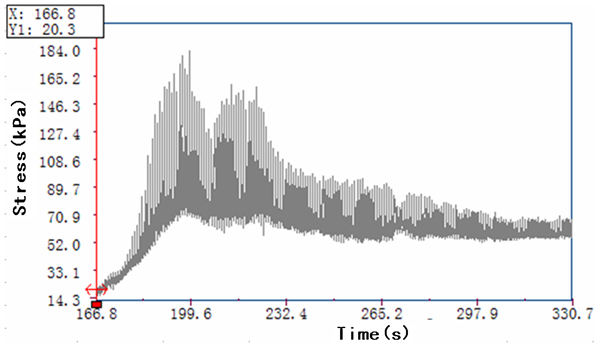
Shown in Fig. 4 are some of the original test data around the fifth stamping hammer in a single stamping process. The third truss (one of the proof tests) is located right beside the fifth hammer.
a side wall pressure test data at height 2 m by fifth hammer, b bottom charging plate test data under fifth hammer and c proof test data in third frame on bottom linkage bar (some of original test results)
Box pressure analysis
Splitting of box pressure
Shown in Fig. 5a is a box pressure curve from a single stamp, through which it can be concluded that the pressure is composed of an impulse pressure by stamping and a more stable pressure by compacted coal. Referring to ‘additional stress’ in soil mechanics, it is possible to define:
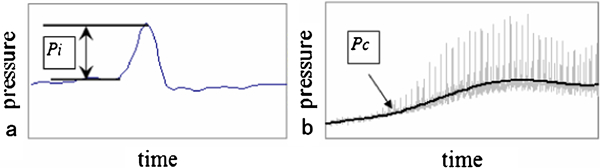
Sketch of impulse pressure and coal pressure
Bottom plate pressure
Overall tendency
Shown in Fig. 6 is a time history pressure on bottom plate in one stamping process, which can be divided into five stages:
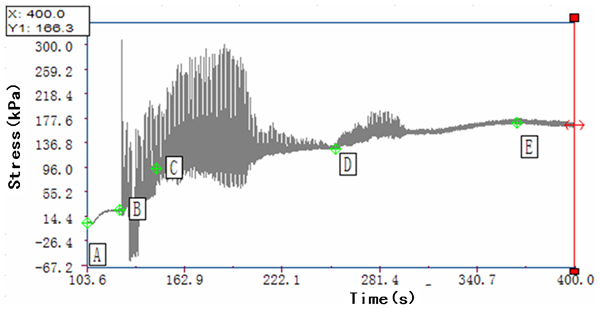
Stages of pressure on bottom charging plate
stage 1 (A–B): preload begins at A. Only p c exists
stage 2 (B–C): stamping begins at B. p c grows rapidly and p i decreases from maximum
stage 3 (C–D): p c grows at a much lower rate than in stage 2, while p i continues decreasing. The bottom plate pressure reaches maximum in this stage
stage 4 (D–E): p c increases stably, yet p i nearly vanished
stage 5 (after E): p c reaches maximum at E, then starting decreasing in the rest of the stamping process.
Impulse pressure on bottom plate
The p i on the bottom plate reaches maximum at the beginning of the stamping, then decreases quickly. Shown in Fig. 7, with abscissa representing the height of the coal cake and the ordinate the percentage p i from its maximum, is the statistical average result of the p i on the bottom plate, which shows that when the coal cake reaches 1·43 m, the impulse pressure falls to lower than 2% of its maximum value, which is considered as the point where the hammer stamping wave cannot reach the bottom plate. Thus, it can be concluded that the effective depth is about 1·43 m.
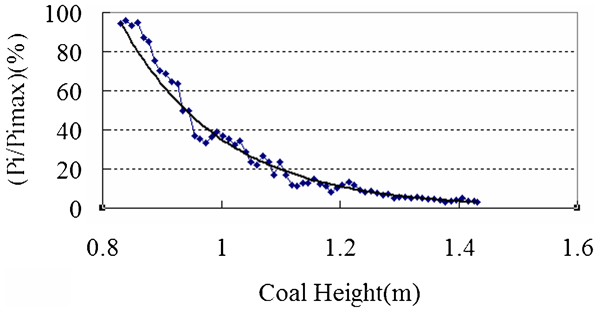
p i–coal height curve on bottom plate
Fitting the curve in Fig. 7 with an exponential function, it can be concluded that
Coal pressure on bottom plate
The statistical value of p c on the bottom plate from stage 2 to stage 4 is shown in Fig. 8, in which abscissa represents the height of the coal cake and ordinate the percentage p c from maximum p c. It can be concluded that the p c reaches maximum when the coal cake rises to a height of about 2·4 m and then starts to decrease.
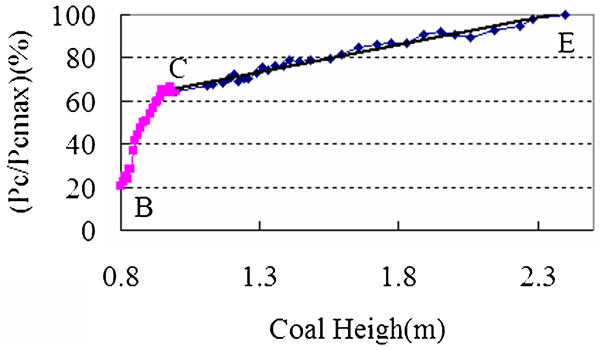
p c–height curve on bottom plate
In stage 2 (B–C), p
c grows rapidly but somehow irregularly. The overall maximum pressure on the bottom plate appears in period CE when p
c presents a good linearity. The formula for p
c in stage 3 and stage 4 (C–E) is
Side wall pressure
Overall tendency
The side wall pressure shows similar tendency at different heights. Figure 9 is a time history of the side wall pressure at the height of 2 m, which shows that both the p i and the p c on side walls first increase, then decrease. This is because the stress in the surface layer is low, which is affected by the surface wave (Rayleigh and Love waves); yet the deeper layer of the cake, though further from the hammers, is compacted by the longitudinal wave and produces more pressure on the side wall.
Pressure on side wall
Different from the pressure on bottom plate, the side wall pressure at any height has a remarkable impulse pressure throughout the process. It could be caused by the interaction between the cake and the side walls shaken by the hammer impact.
Pressure at single point
Shown in Fig. 10 is a statistical curve of p c and p i, varying with the coal height from a height of 2 m. The pressure curves at other heights are similar.
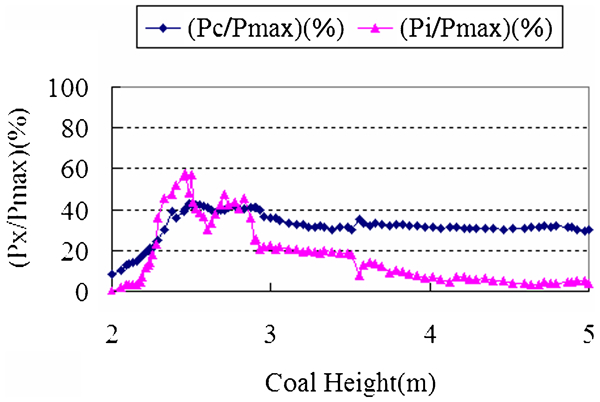
p c and p i on side wall
The abscissa in Fig. 10 is the height of the coal cake and ordinate the percents p c (or p i) in the max side wall pressure at the point during the whole stamping process. The following can be concluded from the curves, which also match the analysis in the section on ‘Overall tendency’:
p i and p c reach their maximum at nearly the same time, when obviously the side wall pressure reaches the maximum. The coal cake is about 0·36 m above the test point at the time
when the coal cake reaches about 1·91 m above the test point, the p i decreases to lower than 10% of the maximum pressure and then floats around 5%
p c increases to its maximum value and then decreases to about 30% of the maximum pressure.
Vertical distribution
Synthesising the pressures on all the test points at a certain time point, a distribution of side wall pressure can be obtained. Shown in Fig. 11 is a distribution when the coal cake reaches 2, 3 and 4 m. The ordinate is height and the abscissa the statistical pressure. The three curves in the figure present the same tendency and match the analysis in the section on ‘Pressure at single point’.
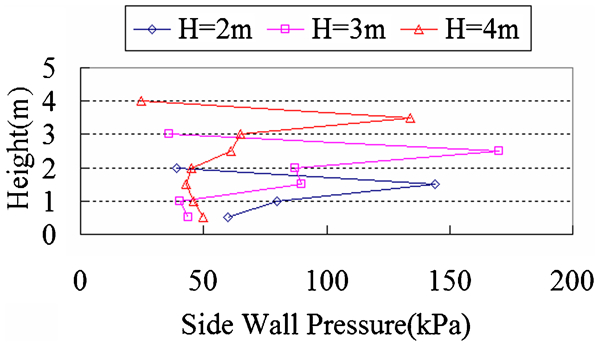
Distribution of side wall pressure
Coal box pressure calculation and its verification
Coal box pressure
Bottom plate pressure can be acquired by combining equations (1) and (2) linearly. After the coal cake reaches 2·4 m, the bottom plate pressure decreases. Because the decrease is slow, the p
c at coal height 2·4 m is regarded as the pressure thereafter.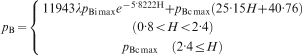
According to the analysis in the section on ‘Side wall pressure’, the polyline in Fig. 12 is set to describe the side wall pressure and the values for h1 and h2 in Fig. 12 is 0·36 and 1·9 m respectively.
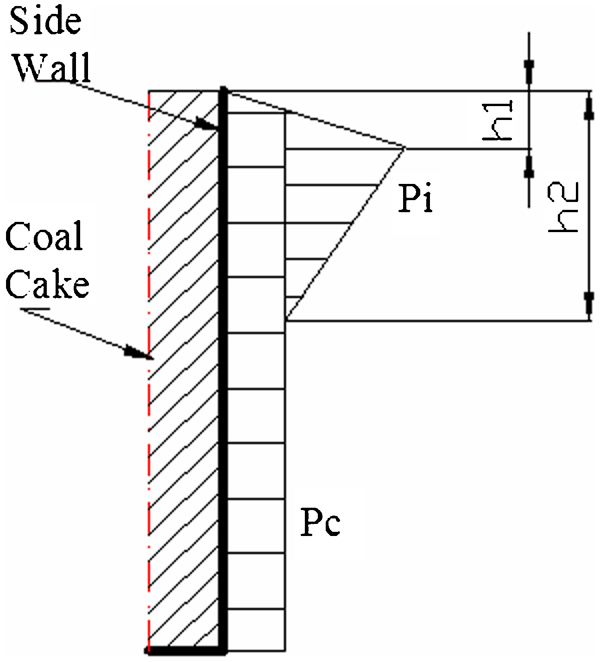
Polyline model for side wall pressure
Verification
For the complexity of the stamp charging car structure, a part calculation may not provide enough accuracy; therefore, an entire car FEM model has been built. The box pressures at different coal cake heights calculated by the method in the section on ‘Coal box pressure’ are loaded on the FEM model and the results of the whole car structure are obtained. Figure 13 is one of the displacement maps when the coal box is filled, in which different colours indicate different displacements.
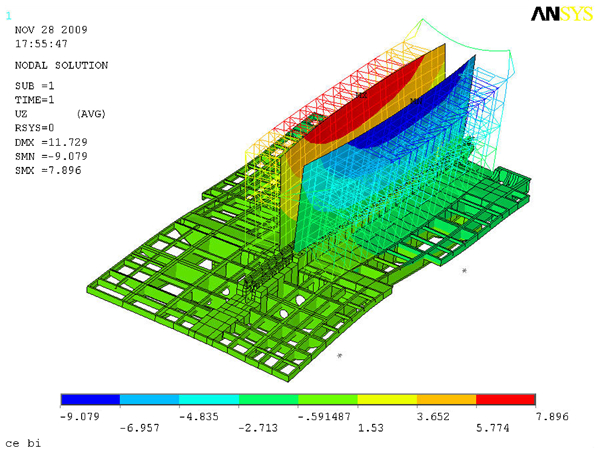
Displacement of stamp charging car side wall axial direction
According to the proof test, the maximum stress (ignoring the initial gravity stress) at the bottom middle of the main beam is 23·7 MPa, while the corresponding FEM result is 27·6 MPa, which shows that equation (3) is reasonable.
The side wall pressure model was verified through a series of comparisons between proof test and calculating results on reaction forces at the linkage bars in the support frames Fig. 14. The calculation result conforms to the proof test, which shows that the model is able to describe the side wall pressure and can be applied in design.
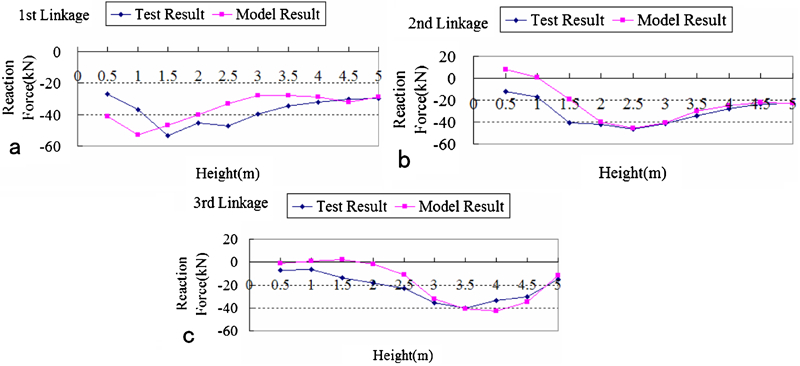
Comparison of linkage bar forces
Conclusions
The paper introduced a test on stamp charging car coal box pressures; the paper presents a way to evaluate the data, and the acquisition of the pressure calculations. The following conclusions can be drawn:
The box pressure during stamping can be split as impulse pressure and coal pressure, both of which present prominent regularity and can describe the pressure properly.
The impulse pressure and coal pressure on side walls and bottom plate were analysed and equations (1) and (2) developed for their calculation.
Some useful factors, such as stamping effect depth and maximum side wall pressure depth, were concluded.
A calculating method of box pressure at any height of the coal cake was built and verified, providing a direct support to the stamp charging car design.
Also the research provides a basis for the further investigation on impact dynamics of the coal cake.