
Abstract
To estimate the quality condition in continuously cast steel slabs, simple but accurate macrosegregation criteria have been proposed. The formation of macrosegregation phenomena in continuous casting of peritectic carbon steels has been investigated by metallographic study of collected slab samples. The metallographic study involved plant trails to collect the slab samples and to prepare them for chemical macrosegregation analysis. The experimental results show a fluctuation of carbon between positive and negative segregation with distance from slab surface based on the cooling conditions experienced by the slab. Via mathematical analysis, formulae of average macrosegregation level ASL, its fluctuation level FSL and its segregation quality number SQN have been developed. The results calculated by these formulae show good agreement with the description of the formation mechanisms of different continuous casting defects and their locations. Therefore, these calculations illustrated that macrosegregation criteria and their distributions can be considered by experimental, simple and vital tools to evaluate the conditions of surface and inner qualities in continuously cast steel slabs. The mechanisms of these criteria with some mechanisms of continuous casting defects have been explained and discussed.
List of symbols
average macrosegregation level
average macrosegregation level in cooling zone abc of equations (3a)–(3c)
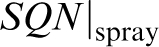
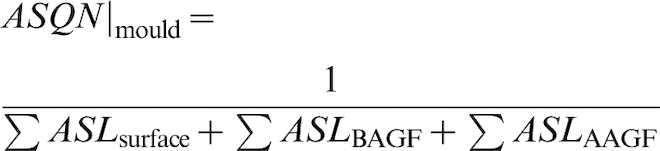
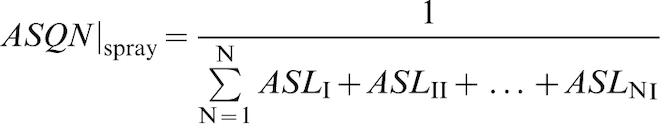
average segregation quality number of cooling zone

average segregation quality number of slab centre area
average segregation quality number of mould zone
average segregation quality number of spray zones
carbon concentration, wt-%

measured carbon concentration, wt-%

nominal carbon concentration, wt-%
macrosegregation fluctuation level
macrosegregation ratio of carbon
minimum segregation ratio of carbon within cooling zone j
maximum segregation ratio of carbon within cooling zone j
segregation quality number
Introduction
The advent of zero defects strategy for the commercial production of continuously cast steel slabs and worldwide efforts directed at elimination and avoidance of casting defects have shown the importance of macrosegregation level and its distribution. Successful hot rolling operations require that the macrosegregation level at different locations in the slab yields mechanical properties and defect free rolled products that are comparable or superior to traditional techniques for elimination these defects. 1–7 Lessons from conventional continuous casting pointed out the need for control of heat transfer during different cooling zones within the continuous caster to prevent crack formation, to promote uniform solid shell growth and to control cast structure. However, the need to minimise the macrosegregation level and its fluctuation took little attention from practical and industrial point of views, except the centreline segregation phenomenon. Therefore, the definition of minimum macrosegregation level and its fluctuation required to maximise the quality of continuously cast steel slabs and to give satisfactory mechanical, physical and chemical properties in the final product are still indistinct. However, the minimisation of macrosegregation levels leads to the successful interdendritic friction welding conditions to reweld interdendritic areas between the dendrites during or directly after the continuous casting process. 2,8
Over the period of three decades, many investigations have been developed experimentally and theoretically to help determine the origin of and assess means for controlling macrosegregation in continuous casting of steel. 9–13 The aspect of the problem which makes building a mathematical model for the macrosegregation is that the diffusion mechanism between the dendritic solid and interdendritic liquid is largely determined by the type of diffusion mechanism. 7,3,14 This is due to the critical and coupled effect of microsegregation/macrosegregation on the brittle–ductile transformation of dendrites and on the defect formation mechanisms, especially in carbon steel alloys. 7,14,15 Therefore, because the macrosegregation level, its fluctuation and microsegregation distribution in solid dendrites depend on the diffusion mechanism, casting and cooling conditions, the formulations for the problems of diffusion mechanisms and operating conditions are coupled. This is to describe the complicated defect mechanisms formed during dendritic solidification of continuously cast steel. 14,15
To overcome this problem, a number of researches have described experimentally and theoretically the factors affecting the macrosegregation level and means to control these phenomena in the different solidification stages of continuous casting of steel, such as mould, spray zones and axial zones. Industrial experience pointed out that the surface quality of continuously cast steel slabs is characterised mainly by the presence of surface cracks and oscillation marks. 9,16,17 Brimacombe and Sorimachi 10 stated that the positive segregation formed in the roots of interdendritic surface cracks. 17 Takeuchi and Brimacombe 1 revealed also that positive surface segregation often appears at the bottom of oscillation marks, which have adjacent subsurface hooks. Brimacombe et al. 17 also pointed out that a white line or a dendritic structure change observed at different positions from slab surface is due to washing of solidification front by metal stream discharging from the nozzle or is associated with movement of dendrite tips away from the steel nozzle centre and with interdendritic tensile strain distribution due to air gap formation. El-Bealy 13 reported that the macrosegregation fluctuates with distance from the surface due to fluctuation of interdendritic strain generation associated with different cooling zones in continuously cast steel slabs at the slab centreline. Miyazawa and Schwerdtfeger 11 concluded that centreline macrosegregation forms due to solid shell bulging of slabs. Sivesson et al. 12 and Jacobsson et al. 18 developed new techniques called thermal soft reduction and mechanical soft reduction respectively to minimise the centreline macrosegregation and therefore to improve the slab central quality. 2 In addition, one of the most important process developments in the control of central macrosegregation has been the application of electromagnetic stirring (EMS). 19–21 A review of this work, which has been conducted in plants and compared to the results of mathematical models, has shown that these investigations used a complete diffusion mechanism in the dendritic solid to simulate the macrosegregation phenomena. Moreover, they concluded that the macrosegregation phenomena are associated with continuously cast steel defects. Therefore, the need to assure high slab quality and minimum casting defects has drawn to the importance of macrosegregation phenomena for this purpose.
In the present work, an attempt is made to develop new criteria named average macrosegregation level ASL and its fluctuation level FSL to determine the slab quality at different cooling zones. This is by determining the segregation quality number SQN. For this purpose, a series of real scale casting plant trials were carried out. Then, the macrosegregation analysis of collected samples from plant trails was performed. A mathematical model has been developed to compute these criteria based on the macrosegregation measurements. The mechanism and analysis of different macrosegregation phenomena associated with different defects and their effects on the macrosegregation quality criteria are discussed extensively.
Plant trials, metallurgical study and results
Plant trials
The experimental work of this investigation involved sample collection from plant trails, samples preparation, measurements and experimental results. The plant trials were carried out during eight casting heats with 220×1680 mm rectangular section slabs. These heats were divided into four groups based on the steel composition where all of the steel grades examined were commercial peritectic carbon steels. Table 1 gives the compositions of the slabs, and Table 2 illustrates the operating conditions under which the samples were taken from the plant trails. The simulated slab caster is based on an actual industrial slab caster in use at Svenskt Stål (Oxelösund) in Sweden. The slab caster in this plant is curved with a radius of 8 m; the geometric detail of the slab caster is presented in Table 2.
Steel compositions for different group heats
Slab caster detail and operating conditions
The various cooling conditions of the mould and spray zones are summarised in Table 2, whereas the different spray cooling cycles are shown in Fig. 1. The details of water spray cooling cycles are described in Refs. 5, 13 and 22. In order to examine the effect of different cooling conditions on the macrosegregation distributions, the various cooling cycles and water flowrates were applied only to the upper side within the zone 4U. The details of the flowrates and cooling cycles of different plant trials are tabulated in Table 3.
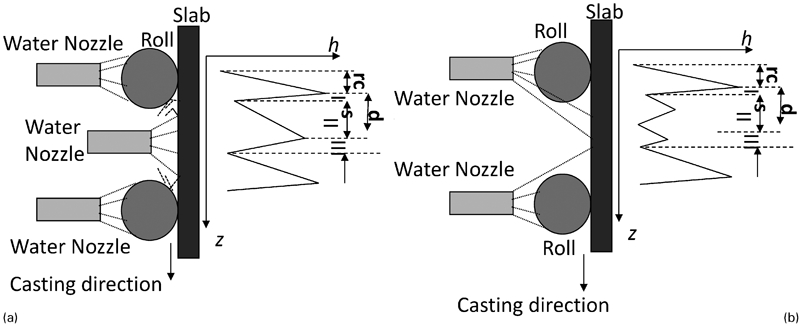
Schematic representation for different cooling cycles 13
Since the present study focuses only on the effect of cooling conditions in different spray zones on the formation of different macrosegregation phenomena, it was appropriate to examine only the centre of the longitudinal cross-section normal to the slab broad face. The location in the slab from which samples were obtained is shown schematically in Fig. 2, where three samples from each plant trail were collected and studied.
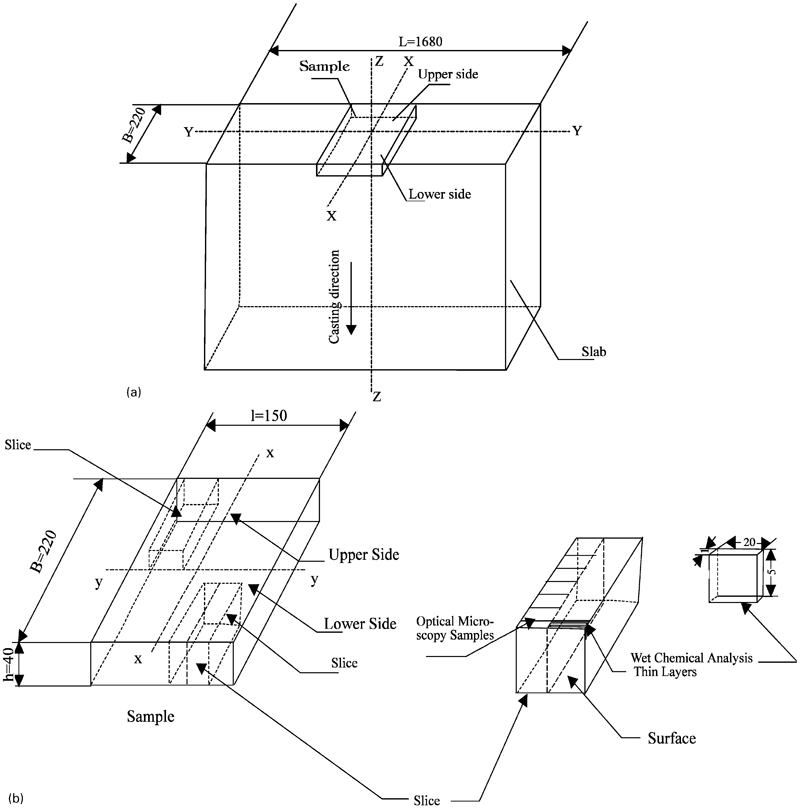
Sectioning of sample
Samples preparation and measurements
In this experimental study, the slab samples were first prepared by removing the oils and oxidised surface layers on these samples by sandblasting. These samples were then sectioned into small specimens of 20×20×115 mm from the samples of different slab sides as shown in Fig. 2b . The carbon concentration was then determined using chemical analysis on the small specimens of 20×20×115 mm. A thin layer was removed from these specimens by milling machine under suitable cutting conditions. This is to minimise the rising of chip temperature and then reduce the effect of chip reheating on the carbon concentration. Although this technique is very accurate and experimentally represents the macrosegregation distributions definitely, it is slow. The dimensions of these layers were 20×20×0·1 (x = 0 mm), 20×20×0·4 (x = 0·1 mm) and 20×20×1 (x = 0·5 mm) uniformly and continuously until the slab centreline. 13 This is to obtain five chip pieces for chemical analysis and take the mean average of every layer.
The carbon concentration of the chip samples was determined by the laboratory at AB Sandvik Steel, Sandvik, Sweden, and the reader is referred to the original references for the details of this chemical technique in Refs. 22 and 23. The macrosegregation ratio S
C is given by equation (1) for measurements of carbon consternations with distance from surface
Experimental results
The results of influence of varying cooling conditions during the continuous casting process on the macrosegregation ratio distributions are summarised in Fig. 3a–d for heats 1, 4, 6 and 8 respectively. These figures indicate generally that the macrosegregation ratio of carbon S C fluctuates up and down around the carbon nominal concentration of the peritectic steel alloy at varying distances from the slab surface.
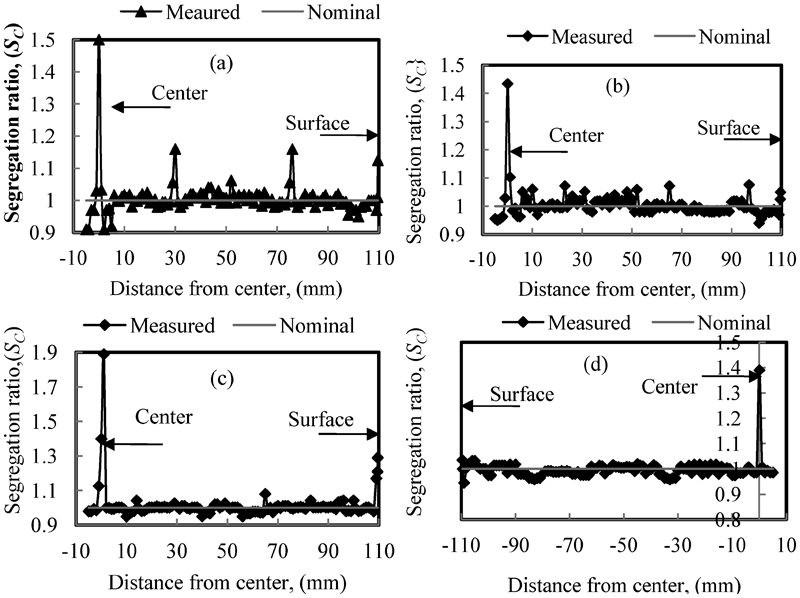
Variations of macrosegregation ratio for heats a 1, b 4 and c 6 for upper side and d 8 for lower side of slab
At the slab surface, these figures reveal small positive segregation ratios S C>1 of 1·13 and 1·05 and small negative segregation ratio SC <1 of 0·99 observed at the slab surface for heats 1, 4 and 8 respectively, as shown in Fig. 3a, b and d . However, a significant positive S C of 1·29 appears at the slab surface of heat 6 (see Fig. 3c ). The differences between the surface segregation levels of different heats are due to the variations in the interactions between the initial surface cooling and casting conditions such as alloy composition, the behaviour of mould powder, its characteristics and melt superheat. This generates different surface interdendritic strain on the slab surface, where this strain fluctuates between tensile strain with high surface cooling rate and compressive strain associated with low surface cooling. 13,24 - 27 As solidification continues, the segregation ratio reduces into negative S C or into very small positive S C just before the air gap cooling region in the mould zone. In this region, the negative S C is an average 0·99 up to 16, 13 and 12 mm respectively from slab surface for heats 1, 4 and 6 (see Fig. 3a–c ), whereas a very small positive S C of average 1·01 is observed up to 12 mm for heat 8 as illustrated in Fig. 3d . This is due to differences in the interdendritic strain hypothesis between the upper and lower slab sides associated with various mould cooling conditions generated in this region. 26 Then, the situation changes dramatically, and the effect of surface reheating due to the air gap formation forces the segregation ratios to go up into positive segregation ratios of 1·02, 1·02, 1·03 and 1·01 for heats 1, 4, 6 and 8 respectively. This is due to a tensile strain generated due to reheating surface temperature level associated with air gap formation and based on its propagation until the mould exit. 26–28
In the spray zones, the segregation ratios of carbon fluctuate between positive and negative continuously until the slab centre area for all the heat samples. This is based on the spray cooling pattern between the rolls, its location from the meniscus and its effect on the rate of growth of solid shell resistance. In addition, the effects of these parameters on the generation of the interdendritic thermomechanical strain become significant. This strain affects the distance between the dendrites and therefore the interdendritic fluid flow between the dendrites and the macrosegregation directly in the different spray zones. 13,29,30
In the upper spray zone, S C fluctuates between negative values of S C due to the rapid surface cooling and S C positive values. These values are 0·99, 1·02, 1·01 and 1·02 at 17 mm from the slab surface, whereas these values change into 1·02, 0·98, 1·01 and 0·98 at 20 mm from the slab surface as shown in Fig. 3a–d for heats 1, 4, 6 and 8 respectively. This situation continues, and S C fluctuates up and down until the straightening spray zone. The differences between S C patterns of different heats in this cooling zone are due to a direct result of solid shell growth and its thickness at the mould exit. Moreover, Flemings 31 and El-Bealy 6 concluded that the interdendritic flow is affected by positive and negative bulging shape where the movement of mushy dendrites affect the interdendritic liquid fluid flow between the dendrites.
In the straightening spray zone, the interdendritic thermomechanical strain hypothesis of slab sides becomes different due to a resultant elongation of the strand in the curved part of continuous caster. 32 Therefore, S C fluctuates between negative S C of 0·99 at 22 mm from the slab surface in the beginning of this area into a positive value of 1·06 at 34 mm from the surface as shown in Fig. 3. Another interesting phenomenon arises from the examinations of different macrosegregation analyses where S C raises steeply into a high positive value 1·2 at 33 mm from the slab surface for heat 1 as shown in Fig. 3a . This is because of the misalignment between support rolls and the effects of pinch rolls on the dendrite movement. 6,31,33 Dahl and Hengstenberg 34 have proposed a mechanism of crack formation associated with the high positive segregation of carbon based on the dendrite separation of columnar crystals due to the roll misalignment. This is compatible with the view that cracking occurs by bulging of the wide slab face owing to insufficient containment. This is in the high temperature zone of low ductility where the columnar dendrite is subjected to more severe plastic deformation, which increases the interdendritic carbon segregation level. Obviously, this high positive segregation level can be prevented by reduction in pinch roll pressure or a set of rolls is gapped optimally. 35
At the horizontal spray zones, S C takes different patterns based on the cooling conditions and type of slab side. Here, S C fluctuates between positive and positive values in the halfway crack area of heats 1 and 4 of upper slab sides (see Fig. 3a and b respectively). In the cases of heats 6 and 8 for the upper and lower slab sides, S C varies from positive to negative values in this area (see Fig. 3c and d respectively), where the slab solid shell bulges out significantly. In the heat 1 samples, S C remains mostly positive with slight fluctuation between positive and negative values from 49 to 100 mm from the surface as shown in Fig 3a . In heat 4, a small negative segregation ratio continues with fluctuating magnitude up to a distance of 68 mm from the surface. This is due to changes in the cooling cycle and increase in the water flowrate as illustrated in Table 2 Tables 2 and 3. At 69 mm from the surface, a positive S C appears again and continues to 76 mm, followed by fluctuations between negative and positive values up to 100 mm from the surface as seen in Fig. 3b . The results of heat 6 shown in Fig. 3c show that after a brief excursion to positive and negative values from 30 into 52 mm from the surface, S C changes its direction into negative values up to 100 mm from the surface. This is due to the change in the cooling conditions in spray zone 4U of heat 6 as summarised in Table 2 Tables 2 and 3. In the case of the lower slab side, Fig. 3d shows that the variation of S C is negative, and its negative values increase continuously into the high negative region at 100 mm from the surface.
At the final stages of slab solidification, the dendrites draw out and reject the rich solute into the slab centre as seen in Fig. 3a–d , which results in negative S C on both sides of the slab centre. This is followed by a steep increase in the positive S C in the slab centreline, which results in the centreline segregation shown in Fig. 3. 6,31,33 Negative S C areas take average values of 0·97, 0·95, 0·98 and 0·99, whereas in the high positive S C areas in the slab centre, these values are 1·5, 1·4, 1·4 and 1·41 for heats 1, 4, 6 and 8 respectively. It is interesting to note that the increasing cooling rate and changing of spray type in zone 4U improve the centreline segregation by ∼7%.
In general, these results point out that the fluctuation of macrosegregation with distance from the surface depends mainly on the variations of cooling conditions in the different cooling zones in continuously cast steel slabs. This is due to a difference in interdendritic thermometallurgical and mechanical strains associated with the differences in the cooling conditions where it subjects the solid shell and mushy zone to various strain hypothesises. 5,6,13 It is interesting to note also that the macrosegregation formation is very sensitive to operating and cooling conditions and therefore to interdendritic strain generation during the process. Therefore, it is concluded from these results that the distribution of macrosegregation may be considered as a significant indicator to reveal the different effects and variations of the casting, cooling and operating conditions on the surface and inner qualities of continuously cast steel slabs. 5,6,13
Quality model formulation
Even though a complete review of previous macrosegregation investigations and their relations with different defects had been carried out,
1–35
a major intention of this work was to simplify the mathematical description for quality of continuously cast steel slabs as much as possible. However, In order to examine slab quality criteria, new macrosegregation criteria were proposed to reveal slab macrosurface/microsurface defects level such as interdendritic cracks, oscillation marks, white band, bulging and related defects formed in the different cooling zones. These concepts can be defined by computing the proposed quality criteria such as average macrosegregation level ASL, its fluctuation level FSL and its segregation quality number SQN. The first step in these calculations is to define the average macrosegregation level ASL using the following equation
The second criterion is to define is the macrosegregation fluctuation level FSL within a certain cooling zone. This criterion can evaluate the fluctuation level of cooling conditions and therefore the degree of homogeneity of these cooling conditions, and the following equation was employed in these computations
5,6

Therefore, in order to define the fluctuation of macrosegregation accurately in the different cooling zones,
5
the strand quality based on the macrosegregation distribution can be classified by the three main areas as shown in Fig. 4. The first area is mould quality area 


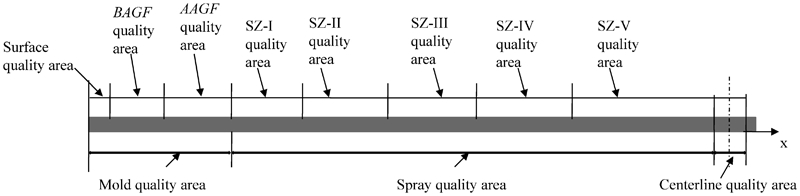
Schematic representation for quality regions
Simulated results and general discussion
To calculate the segregation quality criteria, the results of the present measurements were used to compute the segregation ratio distributions posed by equation (1), and then, equations (2), (4), (3) and (5) are used to describe, respectively, the average macrosegregation level ASL, its segregation quality number SQN, its fluctuation level FSL and, finally, the average segregation number ASQN distributions shown in Figure 5 Figure 6 Figure 7 Figs. 5–8 for different heats.
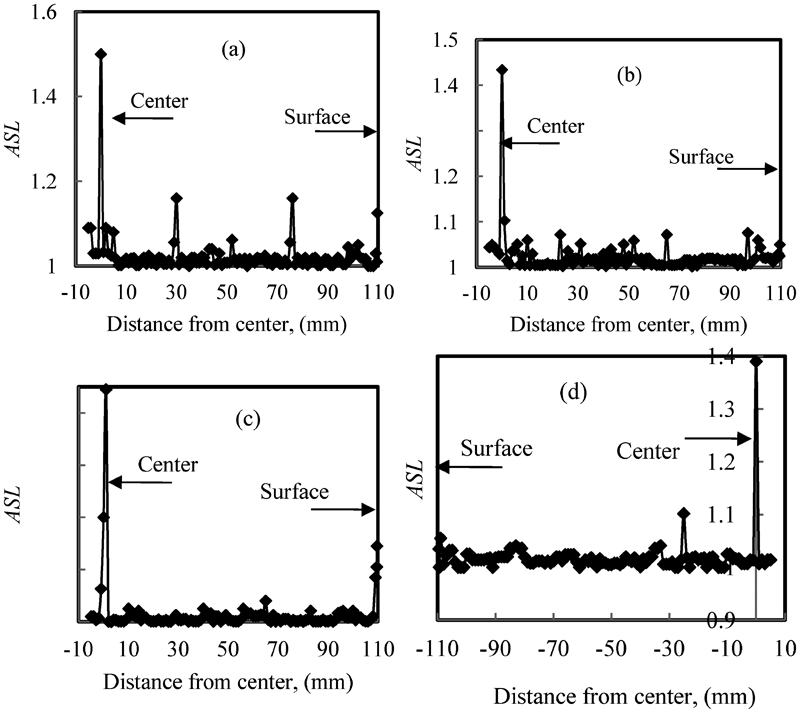
Variations of average macrosegregation level ASL for a heat 1, b heat 4 and c heat 6 for upper side and d heat 8 for lower side of slab
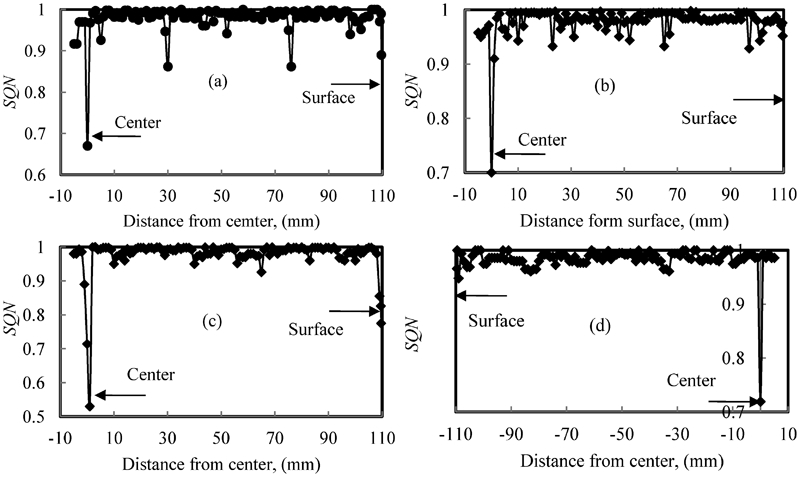
Variations of segregation quality number SQN for a heat 1, b heat 4 and c heat 6 for upper side and d heat 8 for lower side of slab
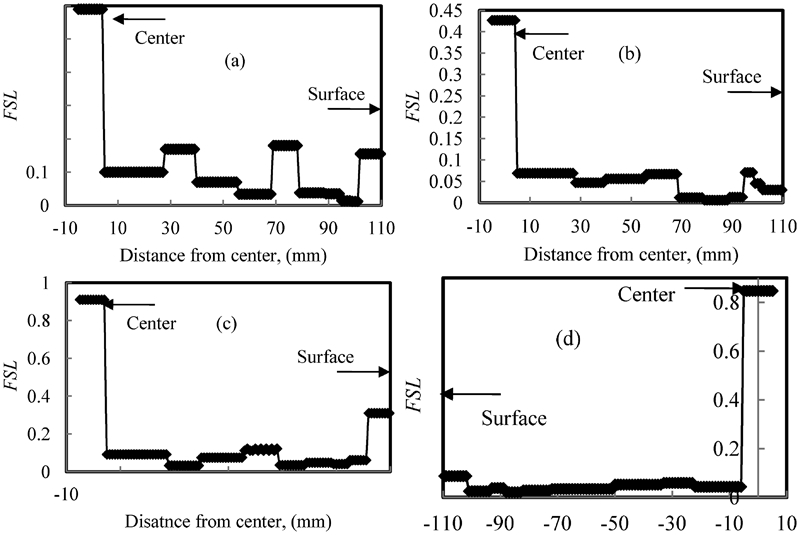
Variations of maximum fluctuation macrosegregation level FSL of different cooling zones for a heat 1, b heat 4 and c heat 6 for upper side and d heat 8 for lower side of slab
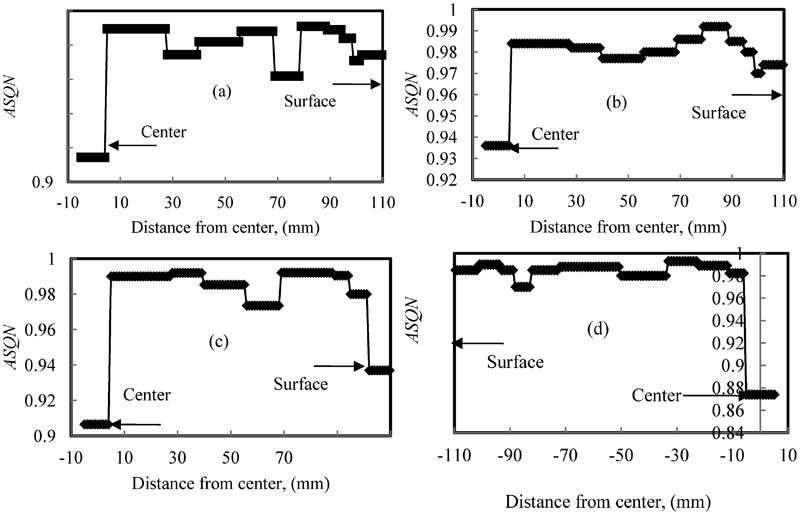
Variations of average segregation quality number ASQN of different cooling zones for a heat 1, b heat 4 and c heat 6 for upper side and d heat 8 for lower side of slab
Mould zone
Close to the meniscus, the dendritic solidification process initiates, and surface segregation begins to form. This surface segregation controls by inverse segregation theory where positive segregation starts to form due to the shrinkage/contraction mechanism associated with phase transformation and cooling. 38 Figure 5 shows different positive segregation levels due different initial interactions of mould cooling conditions, which control nucleation, growth and interdendritic strain generation in the incoherent mushy region. 14,37 Consequently, Fig. 6 reveals that the surface quality numbers of the slab take minimum values of 0·95, 0·95, 0·78 and 1 for heats 1, 4, 6 and 8 respectively. This agrees well with the measurements and observations by Takeuchi and Brimacombe 1,16 of the oscillation mark formation where the surface quality of continuously cast steel slabs is characterised by the presence of the oscillation mark that forms periodically at slab surface. They concluded that surface defects such as transverse cracks and positive segregation are associated with oscillation marks. It also consents with the observations of the metallurgical study by Brimacombe et al. 17 on longitudinal midface surface crack formation where the positive segregates of different rich solute alloying elements and mould powders appear at different locations on crack surface and in its root.
As the solidification continues, the dendrites grow and become coherent. This changes the heat transfer mode between the slab surface and mould wall, which enlarges the cooling rate on the slab surface. 37,39,40 Once the solidifying shell becomes self-supporting, the air gap starts to form, and its dynamics changes the heat flow between the slab surface and the mould wall randomly and continuously. 41–43 Evidence to this phenomenon can be found in the different fluctuated patterns of ASL and SQN shown in Figure 5 Figs. 5 and 6 respectively. These figures show an observed fluctuation of ASL or SQN in the region after air gap formation close to the mould exit, where the maximum fluctuation of segregation levels FSL in the mould zone are 0·16, 0·03, 0·31 and 0·09 as shown in Fig. 7a–d for heats 1, 4, 6 and 8 respectively. In addition to these numbers, Fig. 8a–d shows the average segregation numbers ASQN in the mould zone and takes values of 0·97, 0·97, 0·94 and 0·99 for heats 1, 4, 6 and 8 respectively. It is also interesting to note that these fluctuations agree well with the mould temperature measurements by Lima et al. 44 and the observations of the metallurgical study by Wolf. 45 The first group concluded that the slab surface temperature fluctuates continuously through the different mould levels, whereas the second author points out that the solid shell growth is not uniform during the mould zone and its thickness becomes thinner after air gap formation. 45,46 Therefore, the present and previous works may help to achieve smooth surface temperature and uniform solid shell growth and therefore to avoid the dangerous hot spots with low mechanical resistance, which accomplish minimum surface crack formation and breakout occurrence.
Another interesting phenomenon arises from the mould quality measurements using the macrosegregation distribution where the macrosegregation of carbon drops steeply into a high negative segregation (S C<<1). This defect results from unsuitable selection of the characteristics of EMS or due to improper parameters of nozzle design. A mechanism has been proposed by many investigators. 17,19–21 They concluded that the turbulent flows caused by EMS or steel nozzle penetrate the dendrite mesh and sweep out enriched interdendritic liquid and defined this as solute washing mechanism. This solute washing mechanism results in a white band defect and reduces the mould quality of continuously cast steel strands.
Spray zones
Below the mould, secondary spray cooling is applied in the traditional spray chamber to cool slab surface directly by different cooling patterns. The slab surface temperature fluctuates rapidly between rolls and takes different patterns in various spray cooling zones for different heats. 5–7,13,22,46 In the upper spray zones, Figure 5 Figs. 5a–d and 6a–d illustrate small fluctuations of average segregation level ASL and of segregation quality number SQN for heats 1, 4, 6 and 8 respectively. These fluctuations depend on the degree of surface reheating. In the previous measurements, 5–7,13 the surface reheating degree was within 41°C in the cases of upper slab sides, whereas in the case of lower slab side, this degree reaches a value of 250°C. This difference of reheating surface cannot be observed clearly in the fluctuated segregation level FSL illustrated in Fig. 7. However, this difference is obvious in the behaviour of the average segregation quality number ASQN shown in Fig. 8 of the upper spray zone. In the slab upper sides shown in Fig. 8a–c , these average increases ranged from 0·97, 0·97 and 0·98 to 0·99, 0·99 and 0·99 for heats 1, 4 and 6 respectively. However, this average varies down from 0·99 to 0·97 for slab lower side seen in Fig. 8d . These results agree well with many studies that investigated surface and internal defects. 5,17,47–52 The authors concluded that the cooling conditions of the upper spray zone control the propagation of surface cracks and the initiation of halfway crack by controlling the potentially low hot ductility spots. 49 Kohno et al. 48 and El-Bealy 5 pointed out that the air–water mist nozzle in the upper spray zones affect considerably the degree of homogeneity of the cooling pattern between rolls and therefore minimise the different surface crack propagation. Donaldson 51 reported that overcooling in the upper spray cooling zones as well as excessive pinch roll pressure, especially in the upper spray zone, are factors responsible for the formation of high positive segregation level and therefore halfway crack formation. As evidence to this, it can be seen visibly in Fig. 5a and b , where the segregation level jumps into a high positive segregation value, whereas the quality number drops to a low number as shown in Fig. 6a and b for heats 1 and 4 respectively. In addition, Korothov et al., 47 as well as Krainer and Tarmann, 52 have stated that excessive reheating of upper slab surface is the primary cause of halfway crack formation, whereas El-Bealy 6 has concluded that excessive reheating of lower slab surface is the reason for the increase in bulging level and therefore an increase in the centreline segregation and crack width.
As the slab comes down into the straightening spray zone, the strain hypothesises of solid shell and coherent mushy region enter into a critical area. This affects the segregation level and its pattern. In this zone, ASL patterns show a slight fluctuation; decreasing in ASL, constant ASL and a gradual decreasing in ASL as seen in Fig. 5a–d for heats 1, 4, 6 and 8 respectively. Consequently, Fig. 6 of SQN demonstrates these behaviours clearly, where SQN fluctuates and its patterns lead to a good indicator of the seriousness of internal and geometry defects of continuously cast steel slabs and their degrees. This can be seen in Fig. 7, where FSL increases to 0·18 and slightly to 0·02 and then drops into 0·03 for heat 1, as shown in Fig. 6a . In the case of heats 4, 6 and 8, FSL decreases slightly to 0·01, 0·04 and 0·02, whereas this situation changes in the final stage of the straightening spray zone and FSL increases again into 0·07 and 0·03 as shown Fig. 6b–d respectively. These differences may be due to the changes in the spray cooling conditions of 4U (see Table 3) and the different strain hypothesises of the upper and lower slab sides. These differences can be seen in the changing of the ASQN distributions shown in Fig. 8. The model predications illustrate that ASQN drops into small value of 0·96 and then increases again into 0·988 as shown in Fig. 8a for heat 1, whereas in the cases of heats 4, 6 and 8, ASQN increases gradually by different patterns based on the spray cooling conditions in this area. These results agree well with the predications by Uehara et al., 53 where they concluded that the resultant elongation of the strand results from the combined mechanical and thermal stresses due to ferrostatic head and the bending and cooling conditions, and this is the reason for internal crack formation. From these results, it can be seen that the previous work and the segregation quality criteria lead to an improved understanding of internal and geometry defect occurrences and their mechanisms in different stages.
As the slab becomes horizontal, the effect of ferrostatic head reaches a maximum value and consequently subjects the lower side of the slab to a significant increased load that helps the slab solid shell to bulge out, whereas this weight does not affect the upper part. These subject the slab sides into different strain hypothesises. In additional to the different hypothesises, various cooling conditions also affect the strain generation that affects the segregation formation and its distributions. 13 Figure 5 Figures 5 and 6 show observed fluctuations of ASL and SAN for heats 1 and 4 (shown in Figure 5 Figs. 5a and b and 6a and b ), whereas in cases of heats 6 and 8, ASL and SAN fluctuate slightly. This is due to an increase in the roll temperature. This results in observed roll deflection. 54,55 This deflection with different rapid cooling patterns between rolls generates steep variations in interdendritic strain in the coherent mushy region. In addition, this situation can arise if a set of rolls is too widely gapped or it may also result from rolls that are too narrowly gapped. In the latter case, bulging may occur at the next roll station; 35 this affects directly the macrosegregation formation and its distribution. 13 This can be seen in continuous and observed variations in FSL from 0·04 to 0·18 as shown in Fig. 7a . In the cases of heats 4 and 6 for slab upper sides, FSL distributions illustrate a continuous and gradually decreasing FSL from 0·07 to 0·05 and from 0·11 to 0·03, as illustrated in Fig. 7b and c respectively. This is due to an increase in the cooling rate and in the change in the type of cooling cycle in zone 4U. The situation changes dramatically on the lower side of heat 8, as seen in Fig. 7d , where FSL increases slightly and continuously from 0·052 to 0·059 until the final stages of slab solidification. Finally, Fig. 8a–d describes the ASQN for heats 1, 4, 6 and 8 respectively. The ASQN distributions show a continuous decrease in the halfway cracks area. This area moves inside the slab section with changing the cooling conditions of the 4U spray zone. This appears in the gradual deceasing ASQN from 0·99 to 0·97 and from 0·99 to 0·98 for heats 1 and 4 of upper slab sides as shown in Fig. 8a and b respectively. Owing to the increase in cooling condition in zone 4U, there is a gradual increase in the ASQN value from 0·97 to 0·99, and then this value decreases slightly. This agrees well with the measurements and predications by El-Bealy 7,13 of halfway crack formation and its location. This may help to deepen the understanding of the mechanism of halfway crack formation and to avoid its occurrence. However, in the case of lower side of the slab, the ASQN is approximately a constant of value of 0·99, and the small drop in ASQN into 0·98 appears in the final stage of this zone. In addition, this agrees well with the measurements and calculations of slab bulging by Miyazawa and Schwerdtfeger 56 as well as the predications of the strain distributions by Rammerstorfer et al., 57,58 where the bulging phenomenon is associated with negative strain distribution as illustrated in Refs. 13 and 56–58. This may help to avoid the slab width change defect and improve the slab quality. Another interesting phenomenon arises from the examinations of segregation distributions of different heats, where the positive segregation is observed in halfway crack area of the upper side as illustrated in Ref. 13 for heats 1 and 4 respectively. However, the negative segregation is observed in a positive bulging area of the upper and lower sides of heats 6 and 8 respectively and as illustrated in Refs. 7, 13 and 58.
Centreline zone
In the final stages of slab solidification, the slab moves horizontally, and its solid shell bulges out based on the shape of bulging line. Subsequently, the mushy dendrites draw out and squeeze the interdendritic liquid to flow into the slab centre against the high resistance of ferrostatic pressure. The preceding mechanism increases the possibility of negative segregation areas close to the slab centreline as shown in Fig. 3a–d . This mechanism continues until the location of maximum positive bulging between a pair of rolls where the width of this region controls the width of the negative segregation area. 6,59 Then, the solid shell starts to bulge in and pushes the mushy dendrites in the direction of slab centre. This draws the steel liquid from the hotter region in the liquid pool into the mushy zone just below the liquidus line. With decrease in bulging, the opening of dendrites increases, through which, the interdendritic liquid just below the liquidus isotherm, flows in against little resistance where the ferrostatic pressure helps to push the interdendritic liquid into cooler regions in the mushy zone to segregate. 6,59 These appear in Fig. 5, where the ASL jumps up from small to high values due to the mechanism of centreline segregation. Consequently, SQN drops into minimum values of 0·67, 0·7, 0·71 and 0·72, whereas the FSL increases steeply into values of 0·59, 0·43, 0·91 and 0·85 as shown in Figure 6 Figs. 6a–d and 7a–d for heats 1, 4, 6 and 8 respectively. Figure 8a–d reveals minimum average quality numbers in the slab centre areas, where these reach values of 0·92, 0·94, 0·91 and 0·87 for heats 1, 4, 6 and 8 respectively. It is interesting to note that the slab lower side has a lower ASQN compared with upper side values. This is due to a high accumulative compressed strain that generates positive bulging as illustrated in Refs. 13 and 58. This results in high negative interdendritic distances between the dendrites for heat 8. This agrees well with the measurements and predications of bulging level by Miyazawa and Schwerdtfeger, 60 where they concluded that the major cause of centreline macrosegregation is solid shell bulging. In addition to the bulging shape, several operational factors have been reported to increase the severity of centreline segregation such as steel composition, 61 structure crystal, 62 casting speed, 63 tundish superheat, 64 section size, 65 EMS 45 and, finally, the characteristics of mechanical soft reduction technique. 18 These factors affect the central quality of steel slabs by different segregation levels.
In general, the segregation quality criteria appear to be a good indicator to explain the different mechanisms of defect formations in continuously cast steel slabs and also may help to avoid the formation of these defects.
Conclusions
To evaluate the surface and inner qualities of continuously cast steels accurately, macrosegregation criteria were proposed. The macrosegregation measurements show that the macrosegregation occurrence is a very sensitive and accurate phenomenon to the variations of cooling conditions and is associated with defect formations during the continuously cast steel slabs. For example, positive segregation areas in the slab section are associated with interdendritic crack formation, whereas negative segregation areas are associated with mould EMS, and white band defect may occur with positive bulging where the slab surface bulges out and geometry defects may deform. Results from measurements and quality model predications reveal.
Average macrosegregation level criterion ASL defines the details and location of defect formation.
Macrosegregation fluctuation level criterion FSL defines the seriousness of defect.
Segregation quality number criterion SQN measures the quality at different locations of slab section qualitatively and quantitatively, whereas average segregation quality number ASQN deals with the quality within certain cooling zone. Both of these can measure the qualities of slab accurately within a certain cooling zone.
These criteria provide an accurate tool for engineers and researches to prevent defect formation in continuously cast steel slabs.
Although the predications of the quality model are generally supported by the previous published results, it is necessary to create more investigations by both experimental and numerical modelling to refine the model, solve the remaining problems and apply this quality technique in the global steel industries. Another important aspect of the future work is to simplify this technique to face the practical requirements in steel industries and to explain accurately some of complicated nano–micro–macrodefect mechanisms during casting processes. In this future work, it may be possible to improve the parameters affecting the stages of different defect types and levels that depend on both the thermal fields and metallurgical and mechanical sources.
Footnotes
Acknowledgements
The author wishes to express his sincere gratitude to Professor M. Flemings, MIT, former Head of Department of Materials Science and Engineering, Massachusetts, USA, for his early pioneer work in the solidification processes, macrosegregation/microsegregation and solidification crack fields, which guides the author to several facts in these fields. The author also wishes to express his sincere gratitude to Professor H. Fredriksson, Royal Institute of Technology, Department of Materials Science and Engineering, Division of Casting of Metals, Stockholm, Sweden, for his considerable supervision, guidance, helpful discussions throughout this work and valuable assistance in earlier days. The author is also especially grateful for financial support of the Companies’ Chair of the Swedish Iron Masters Association, Stockholm, Sweden. Finally, the cooperation and assistance of the operating personnel, especially Engineer N. Leskinen and Mr T. Sohlgren, OxelÖsund Works, OxelÖsund, Sweden, as well as Engineer Mikael Wallinder, KTH, Stockholm, Sweden, during plant trials are also gratefully acknowledged.