
Abstract
The aim of the paper is to design the new wide plate mill. The work on the new cooling technology was supported by extensive laboratory testing while a simulator with full scale testing of cooling units was used. The principal objective of the investigation was to establish the design specification of equipment for accelerated cooling, particularly with respect to the product dimensions and steel grades. The possibilities of accelerated cooling are limited by technical parameters of cooling equipment such as thickness of water layer, flowrate, spray height, position of cooled surface to the nozzles and water or plate speed. These parameters were studied for different product temperatures and water impingement densities from 50 to 110 l s−1 m−2. The heat transfer coefficient was determined and compared for each case. There were three recognised significant cooling regions: water layer region, impinging jet region without water layer and impinging region with water layer, which must be taken into account. The application of the new cooling technology showed better flatness product and productivity higher than previous accelerated cooling system, even shorter cooling length. The rejection ratio by flatness problem of new mill was nearly half of the previous one.
Introduction
POSCO has launched new wide plate mill in 2010 to supply material mainly for shipbuilding and energy sector. At present, there are three plate mills in POSCO with overall production capacity of ∼5 Mt/year. The new mill has a production capacity of 2 Mt/year in the first stage and is designed for high quality thermomechanical control process products with maximal width of 5·3 m and thickness ranging between 6 and 200 mm.
The knowledge and experience with the plate cooling technology were gathered by POSCO for the new wide plate mill to provide products with world best quality and to reach controllable and homogeneous cooling intensity. With respect to the product dimensions and steel grades, to establish the equipment for accelerated cooling was decided. The equipment for accelerated cooling is usually an integral part of modern plate mills and is situated in line at the end of the rolling process. The cooling equipment can have various designs and its technical parameters can limit the cooling rate of rolled material and thus limit the possibilities of accelerated cooling technologies. 1,2
Design work on the new cooling technology was supported by extensive laboratory testing while a simulator with full scale testing of cooling units was used. The research was performed in cooperation with Heat Transfer and Fluid Flow Laboratory experienced in experimental work focused on evaluation of heat transfer specially during rolling 3,4 or continuous casting 5 and cooling units design. 6
Previous studies of accelerated cooling
There are various technical means used for the cooling of hot steel surfaces in metallurgical industry. The cooling intensity is given by the heat transfer coefficient (HTC); hence this physical quantity is examined in works focused on design of any cooling equipment. In the research presented in this paper, the same as it was found in Al-Ahmadi et al., 7 the HTC is primarily dependent upon the local mass flux and the temperature of the cooled plate. In Brammer, 2 it is also assured that ‘in general, it has been found that the minimum film boiling heat flux and the maximum (critical) heat flux both increase with an increase in the mass flux’. This is in agreement with the results found here. The study in Brammer 2 has a disadvantage that the spray mass flux distributions are reported to be almost constant around the plate, while in the study presented in this paper, a certain inhomogeneity is considered.
In Al-Ahmadi et al., 7 the experimental results indicate that the heat flux, and therefore the HTC, tend to increase with the liquid mass flux when the mass flux is low, but does not increase proportionally at higher mass fluxes.
The experiments in Deb and Yao 8 show the growing relation between the volume flowrate per unit area and the heat flux for temperatures between 400 and 600°C. These results are in good agreement with the results of this study. The results in this study are shown for a wider range of temperatures then in Deb and Yao. 8
The studies by Cox and Yao 9 and Hariki et al. 10 present cooling characteristics for different spray heights. These data allow the analysis of the heat transfer around the strike point. The study in this paper is about the behaviour of specific set of nozzles. The information about thermal inhomogeneity generated during cooling by these nozzles is provided by measuring the HTC under the jets and in between the jets.
In Vader et al., 11 very similar experiment as in this paper is presented. The significant difference is only in direction of spraying jets. Comparison of both experiments will help find new results about spray cooling during rolling.
None of the papers mentioned and taken as a reference has precise information about the behaviour of the HTC for different temperatures and water impingement densities from 50 to 110 l s−1 m−2 that is studied in this paper.
Experimental
Experimental stand
An experimental stand was built to study the cooling of linearly moving objects. A 6 m long girder carrying a movable trolley and a driving mechanism (see Fig. 1) forms the basic part of the experimental device. An electronic device measuring the instant position of the trolley is embedded in the trolley. The driving mechanism consists of an electric motor controlled by a programmable unit, a gearbox, two rollers and a hauling rope. The girder is longitudinally divided into three sections. The marginal sections are used for the trolley’s acceleration or deceleration. The velocity of the trolley is constant in the mid-section and it is here where the spray nozzles quench the measured sample. As it is possible to spin the whole girder, this stand allows doing experiments of upper cooling, bottom cooling and lateral cooling.
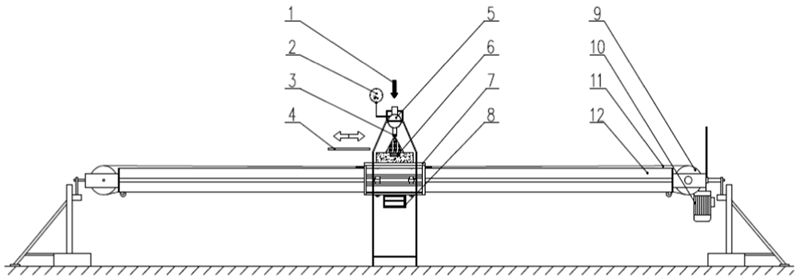
Principal scheme of linear test bench
The common procedure of the experiment is as follows:
an electric heater heats the test plate to an initial temperature of the experiment
the plunger water pump is switched on and the pressure is adjusted
a driving mechanism moves the test plate under the spraying nozzles. After recovering the temperature field in the plate, the movement of the plate under the spraying nozzles is repeated
the temperature is measured using K-thermocouples inside the investigated steel plate at a depth of 1 mm from the cooled surface and the temperature is recorded into data logger memory
the positions of the test plate and the thermocouples (in the direction of movement) are recorded together with the temperature values. The record of instant positions is used for computation of instant velocities and positions while moving under the spray.
There is another configuration of the experimental stand in which the test plate is stationary and the water flows at the plate. In this configuration, the trolley is stationary together with the cooled plate and there are no spraying nozzles. Water is supplied by a pump station and is distributed by a chamber, making a water layer of given thickness and adjustable velocity which is flowing over the plate. A scheme of this configuration is shown later in Fig. 2.
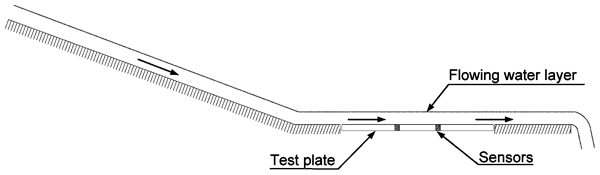
Scheme of experiment with moving water layer at hot steel surface
Nozzles and nozzle plate
The set of solid jet nozzles was placed in the nozzle plate sized 440×310 mm with 66 holes for nozzles. The main features of the nozzle plate are schematised in Fig. 3. Different nozzle spacings (30–60 mm) and nozzle diameters (3–20 mm) are studied. Zigzag pattern for the most uniform cooling was selected.
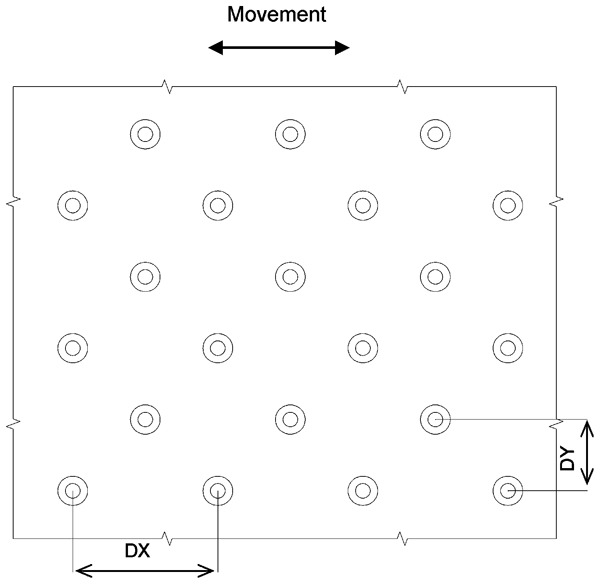
Scheme of nozzle plate, i.e. plate with holes for positioning solid jet nozzles
Evaluation by using inverse task
The pass under the nozzle causes temperature drop in the material sample. The temperatures measured by temperature sensors inside sample near the surface together with material properties and calibration characteristics of temperature sensors are used as an input for the inverse heat conduction task. Beck’s approach is used (1985). The method uses sequential estimation of the time varying heat flux at the surface and uses future time steps data to stabilise this ill posed problem. After determining the heat flux at the surface, the HTC and the surface temperature are found under Pohanka. 12
Experiments
There are several cooling modes in jet cooling system. The first one occurs under top header nozzle plate which is named ‘impinging jet region’, and the second occurs in ‘water layer region’ beyond impinging jet region. To include these modes, several different experimental configurations were selected. Thickness of water layer, flowrate, spray height, position of cooled surface to the nozzles and water or plate speed were the variables which were changed. The initial temperature of test plate was 900°C. There were five thermocouples in plate settled in two rows.
Results
Water layer region
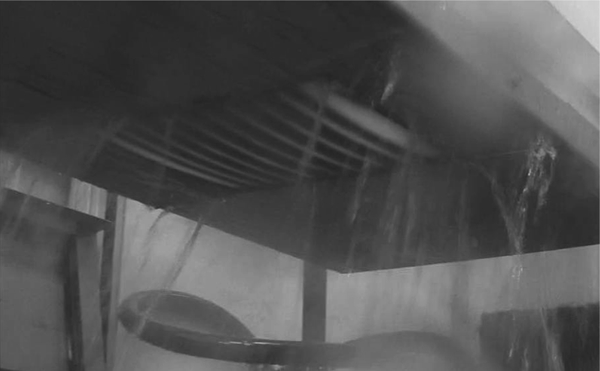
Cases when the test plate was stationary, no nozzles sprayed to the cooled surface, however, the water layer was formed at the surface are represented by experiments in Table 1. The plate was cooled at upper surface and the water layer thickness was ∼40 mm. The variable experimental condition was water flow velocity. The scheme of the experiments is shown in Fig. 2 and the photo of one of the experiments is in Fig. 4.
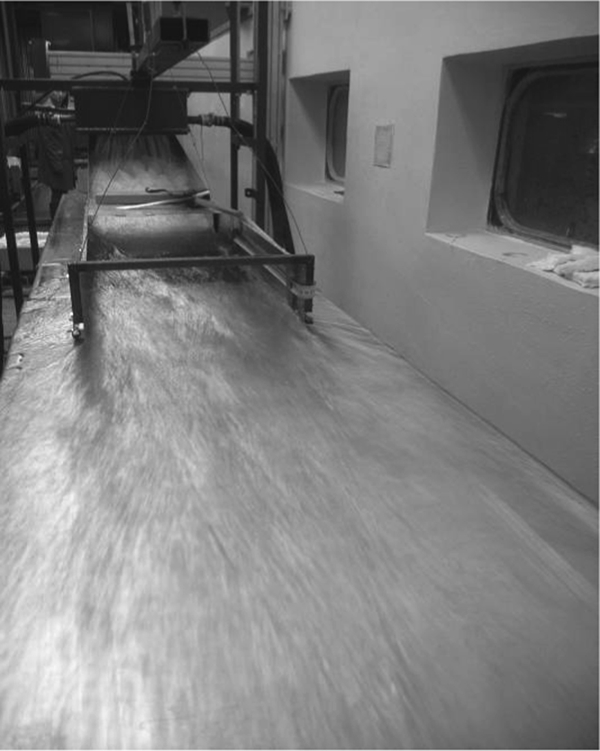
Photo of experiment with moving water layer and stationary test plate
Summary of experiments for water layer region
The resultant HTC dependence on the surface temperature for these experiments is shown in Fig. 5. There is a similar cooling behaviour for every water layer speed. The cooling can be divided into three areas according to the values of HTC in the graph. The first area of nearly constant HTC is approximately located between surface temperatures of 200 and 450°C. The second area is located between 450 and 700°C, and its main characteristic is the abrupt drop in the HTC when surface temperature increases. This drop is caused by formation of a steam layer between water and hot test plate, which makes the heat transfer difficult. The third area is approximately located >700°C when the Leidenfrost temperature is overcome, then the asymptotic HTC is assumed. From the results, an empirical formula for determination of HTC was evaluated by assuming that the steel plate surface temperature is 900°C and it is cooled by moving water layer thick enough. Considering an exponential behaviour of the HTC in dependence on velocity of the flowing water layer V, with a coefficient of determination of 0·9664, the following formula was deduced
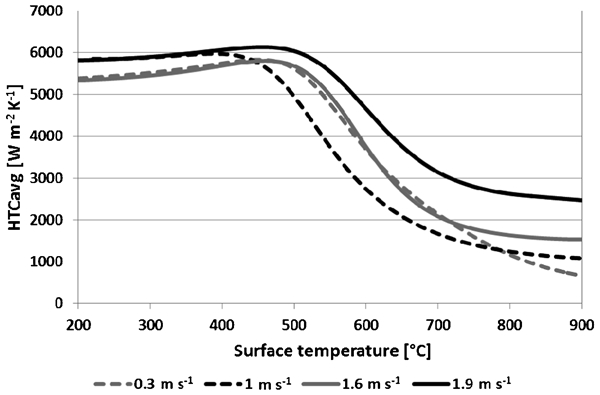
Measured HTC in dependence on surface temperature for experiments with free water stream without spraying nozzles at different water layer velocities
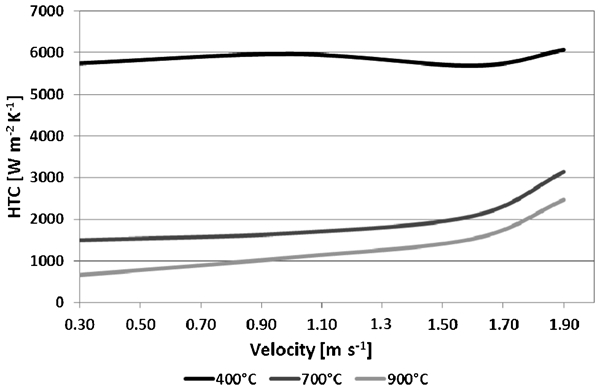
Calculated HTC in dependence on velocity of flowing water layer at different surface temperatures
Impinging jet region without water layer
The second regime is cooling by spraying nozzles and water layer is not formed at the surface. This phenomenon was simulated in experiments with bottom-up cooling without water layer with a number of different plate speeds (Table 2) where the spray height was 50 mm. The speeds of test plate were 0·5, 1 and 2 m s−1. As it was mentioned earlier, the cooled plate was cyclically moved under the area with the nozzles followed by the area without the nozzles. During several experiments, the inhomogeneity of cooling was observed as significant thermal strips (Fig. 7). These strips are a result of a design where the nozzles (see Fig. 3) are located in lines oriented in the direction of movement of the test plate. To measure the inhomogeneity of cooling, the HTC in between the thermal strips and the HTC inside the strips were determined.
Thermal strips during bottom spray cooling of steel plate for speed of test plate of 1 m s−1 and water impingement density of 186·9 l s−1 m−2
Summary of experiments for impingement jet region without water layer
The result from the tests with the test plate speed of 1 m s−1 is shown in Fig. 8 and is used to show the inhomogeneity of surface temperature calculated from measured data by inverse modelling. The higher surface temperature appertains to area between jets, and the lower temperature in the figure appertains to the jet impact area. The surface temperature abruptly decreases and after that it is partly recovered. This behaviour is cyclically repeated and is caused by the thermal inertia of the plate in the meantime without cooling. The meaningful finding is that the surface temperature decreases during cooling under jets much deeper than at area between jets where the boundary is surface temperature of 300°C. Above 300°C, the difference between surface temperatures of two discussed areas could be >150°C, while below 300°C, the surface temperatures tend to be the same. Similar was observed by Chester 9 for stationary plate. The further thermocouple positions are away from the centreline of the jet, the longer it took to see a rapid drop in temperature. After a given time, a sharp decrease in temperature is noted for each thermocouple outside the wetted zone. In the beginning, water is forced from the plate surface by gravity and by the formation of a stable vapour film barrier on the surface. As the cooling continues, the black zone grows. The results presented in this paper are also in agreement with investigation of Franco14 that the growth of the fully wetted region at the surface moving through the water spray is a function of entry temperature and distance from impinged area.
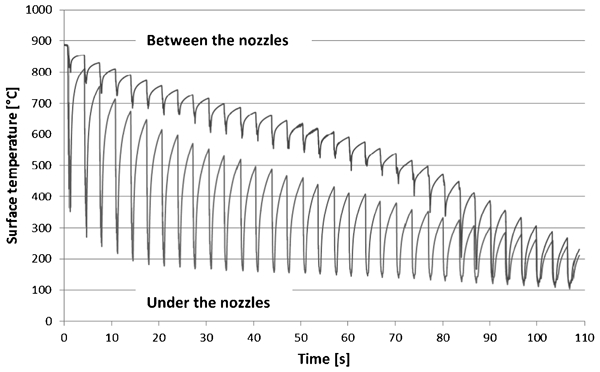
History of surface temperature of steel plate during spray cooling without water layer in impingement flow and in between flows: cooled plate went through area with water cooling (water impingement density of 186·9 l s−1 m−2 and speed of test plate of 1 m s−1) followed by area without water cooling
The differences in the HTC at surface of test plate have been discussed only in between rows, formed by nozzles, parallel to the movement. These rows are shown earlier in Fig. 7. However, Fig. 9 shows inhomogeneity of HTC through the rows. There are three curves in Fig. 9. The upper curve represents HTC along the row which is in Fig. 7 seen as the light strip. The lower curve represents HTC along the row seen in Fig. 7 as black strip. The curve between already mentioned curves corresponds to the place between the light and the black strip in Fig. 7.
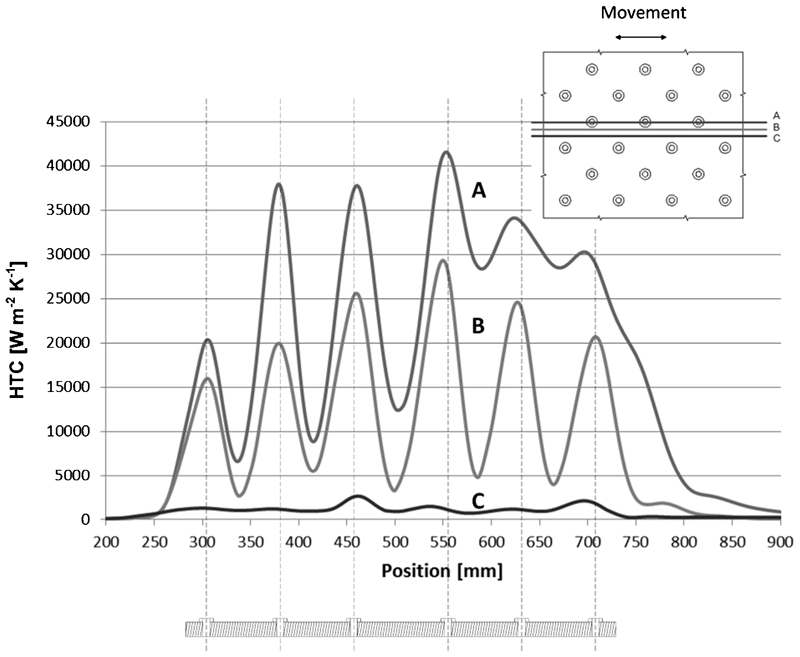
Heat transfer coefficient in dependence on position in direction of test plate movement for spray cooling without water layer
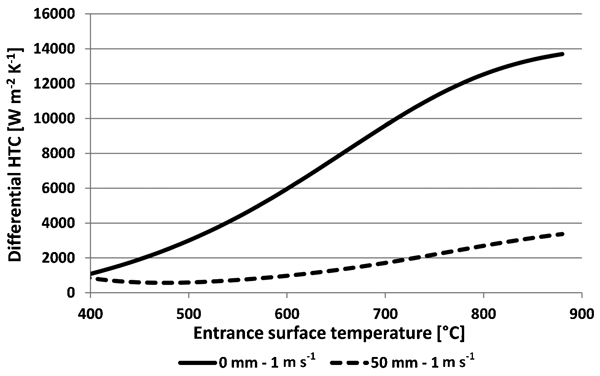
The resultant averaged HTC for three experiments at the test plate speed of 1 m s−1 (water impingement density of 49·6, 112·5 and 186·9 l s−1 m−2) dependent upon entrance surface temperature were presented separately for the area under the nozzle jets and for the area between the jets in Fig. 10. The entrance surface temperature is the temperature that surface of test plate had when it reached the first jet. The aim of the graph in Fig. 10 is to compare the inhomogeneity for different impingement densities and water flow regimes. The inhomogeneity was increased with an increase in the water impingement density.
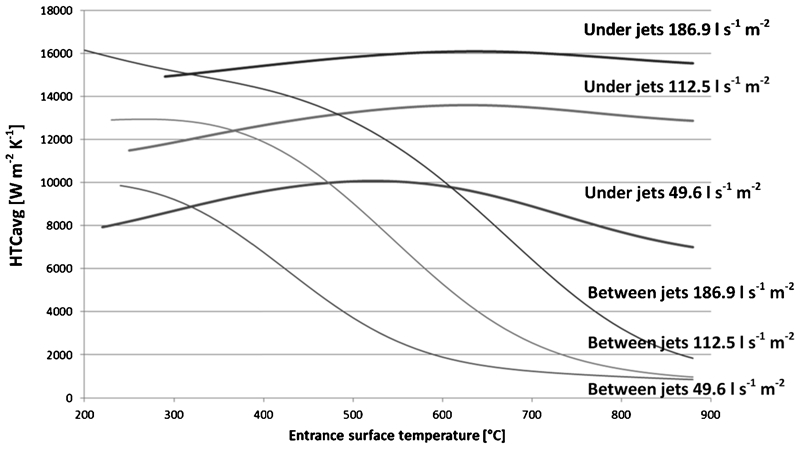
Averaged HTC in dependence on entrance surface temperature for spray bottom-up cooling without water layer at test plate speed of 1 m s−1 under jets and between jets
The experiments with the test plate speeds of 0·5 and 2 m s−1 will be discussed in the following chapter, and the results are shown in Fig. 11.
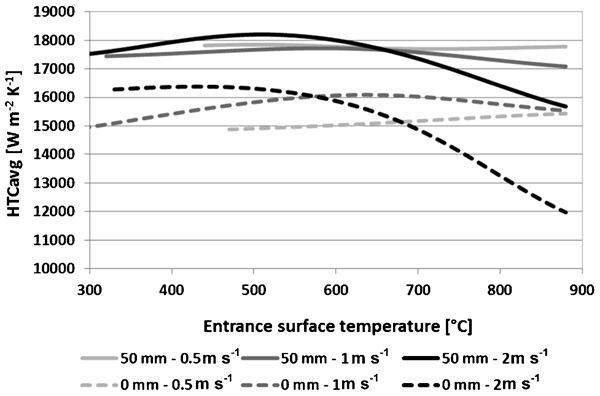
Effect of water pool (depth of water of 50 mm) on HTC in comparison with results without water pool (0 mm) during bottom spray cooling for three different test plate speeds
Impinging jet region with water layer
As mentioned above, the bottom-up spray cooling without water layer showed inhomogeneity. To determine the influence of presence of water layer on the homogeneity of cooling, the third group of experiments was performed. The third group of experiments also refers to the bottom-up spray cooling, but there is pool of water located in between the nozzle plate. The spray height was 50 mm, the water impingement density was 186·9 l s−1 m−2 and the depth of water in pool was 50 mm. The moving test plate (0·5, 1 and 2 m s−1) was tightly connected to deflector. The deflector is plate surrounding the test plate as it is shown in Fig. 12. The nozzle plate constituted the part of the bottom of pool. The water from the nozzles sprayed up through the water in pool where the flowrate per unit area was 186·9 l s−1 m−2. These experiments represent the fact that in a real mill the gap between the header and the cooled plate filled by water for high flowrates is expected.
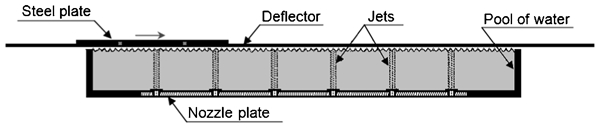
Scheme of experiments of bottom cooling through water pool
The results are shown in Fig. 11. The HTC averaged over the cooled plate in dependence on the entrance surface temperature for experiments with water pool are compared with the HTC for experiments without water layer at three different speeds of cooled plate. In Fig. 11, an increase in the HTC caused by water pool during spray cooling of the bottom surface is shown.
The water pool used during spray cooling has other effect that is a significant increase in the cooling homogeneity as it can be seen in Fig. 13. Each curve in this graph represents the differences between the HTC under the jets and the HTC in between the jets in dependence on the entrance surface temperature. Upper curve shows the differences in the HTC for the experiment without the water pool and the lower curve shows the differences in the HTC for the experiment with the water pool 50 mm deep. In the temperature range starting at 400°C, the differences in HTC for the experiment without water pool are always higher than the differences in HTC for the experiment with water pool. Also the differences in HTC increase with an increase in the entrance surface temperature much faster for the experiment without water pool than with water pool. This means that the spray cooling with water pool provides better cooling homogeneity as the temperature increases.
Cooling homogeneity for bottom spray cooling where test plate speed is 1 m s−1 with and without water pool
Spray cooling and numerical modelling
The example of numerical model in combination with plant measurement is shown in this paragraph. A plate of low carbon steel 16·4×4·1 m, with a thickness of 25·1 mm, was cooled. The plate moved to the cooling section in the direction of the arrow and only part of the cooling unit was used for cooling in this example. Six cooling units were on. The marks of P1, P2 and P3 on Fig. 14 denote temperature sensors used for monitoring of surface temperature. The temperature sensors serve as checking mechanism of and input to the numerical models. The plate surface is flooded in the cooling area where it is not possible to monitor directly the temperature field. The time history of plate temperature can be computed using knowledge of cooling intensity obtained in laboratory tests. The numerical model is adjusted to fit perfectly to the measured temperatures in points P1, P2 and P3. An example of computed temperature field in the cooled plate is shown in Fig. 14. It is obvious that the knowledge of the temperature field is necessary for metallurgist when designing and optimising the cooling strategy.
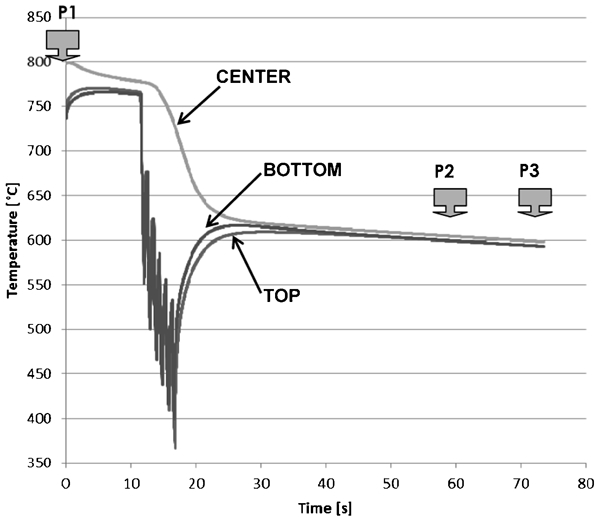
Temperature history in plate running through cooling unit
Comparison with other studies
The results presented in this paper are compared with the results presented in Al-Ahmadi et al., 3 Deb and Yao 4 and Cox and Yao. 9 Figure 15 shows the values of HTC in dependence on the volume flowrate per unit area. The graph was created using the logarithmical scale to make data more understandable due to the wide range of the presented data. The respective surface temperature of each point was included in the graph because it is considered as an important parameter that should be shown.
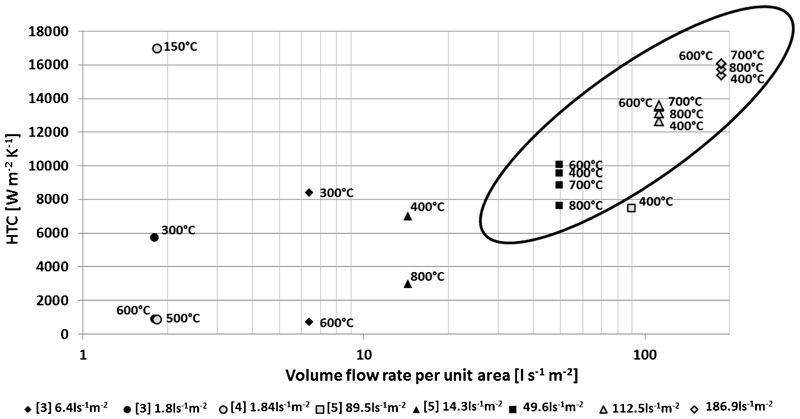
Comparative chart of different experiments
The circled points in Fig. 15 denote the data extracted from the experiments presented in this paper. These experiments are obviously located in the region where the volume flowrate per unit area and the HTC are highest. The other points describe data of others. While in this work the solid jet nozzles were used, in the work by Al-Ahmadi et al., 7 the full cone industrial sprays were used, in Deb and Yao, 8 horizontal sprays impinging on a vertical surface and in Cox and Yao 9 monodisperse sprays with large droplet diameters ranging from 3 to 25 mm.
The homogeneity of thermal field during spray cooling with water pool mentioned in this paper can be compared with Rivallin and Viannay15 where a steel plate is cooled from the top by spray through a water pool. Results published in Rivallin and Viannay15 show that the water layer increases the homogeneity of the cooling. These conclusions are extracted by comparing the curves for the different experiments which show the behaviour of the heat flux density through the sample. The same conclusions were found in the experiments explained in this paper; however, the steel plate was cooled from bottom. In conclusion of this chapter, the usage of water pool increases the overall HTC and the homogeneity of spray cooling.
Conclusion
Accelerated cooling technology and rolling model for thermomechanical controlled process has been developed as can be seen in Fig. 16. The study of HTC enlarged knowledge on HTC behaviour and contributed to development of new cooling technology. This new cooling technology gave better flatness product and productivity than previous accelerated cooling system, even shorter cooling length. The rejection ratio by flatness problem of new mill is nearly half of the previous one.
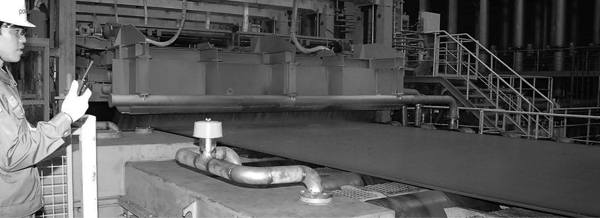
Reference photograph of new plate mill cooling system
Footnotes
Acknowledgements
The development of evaluation methods used in the present research has been supported within the project no. CZ·1·07/2·3·00/20·0188, HEATEAM-Multidisciplinary Team for Research and Development of Heat Processes.